Back

Dividend Adjustment Notice – Sep 24 ,2025

Dear Client,

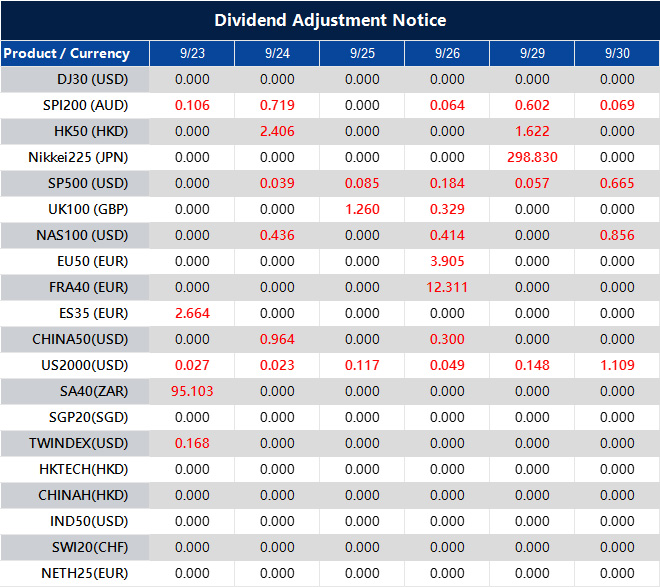
Please note that the dividends of the following products will be adjusted accordingly. Index dividends will be executed separately through a balance statement directly to your trading account, and the comment will be in the following format “Div & Product Name & Net Volume”.

Please refer to the table below for more details:

Dividend Adjustment Notice

The above data is for reference only, please refer to the MT4/MT5 software for specific data.

If you’d like more information, please don’t hesitate to contact [email protected].

Crude Oil Inches Higher On Supply Strains

Oil markets extended their cautious climb on Wednesday, with West Texas Intermediate (WTI) advancing 0.3% to $63.62 a barrel and Brent crude also up 0.3% at $67.82. It marked the second consecutive session of gains.

The move higher was driven by tightening supply conditions combined with renewed geopolitical uncertainty.

Fresh figures from the American Petroleum Institute (API) showed a drawdown of 3.82 million barrels in US crude inventories last week, adding fuel to already bullish sentiment.

Gasoline stocks fell by just over 1 million barrels, although distillates recorded a modest build. Traders are now awaiting official confirmation from the Energy Information Administration (EIA) later in the day, which is expected to set the tone more clearly.

On the supply side, progress in restarting oil exports from Iraq’s Kurdistan region has hit a stumbling block. Despite earlier optimism, leading producers are withholding around 230,000 barrels per day until debt repayment guarantees are secured.

The key pipeline to Turkey has been offline since March 2023, and this latest snag underscores fragility across the global supply chain.

Concerns were also heightened by Venezuela, where Chevron confirmed it would only be able to ship half of its 240,000 bpd quota due to newly imposed restrictions, tightening the flow of heavy crude into the US.

Technical Analysis

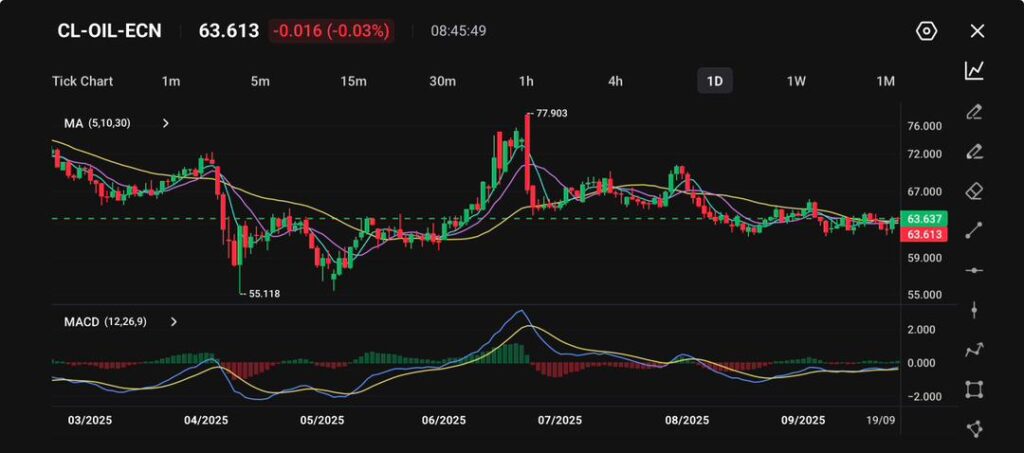
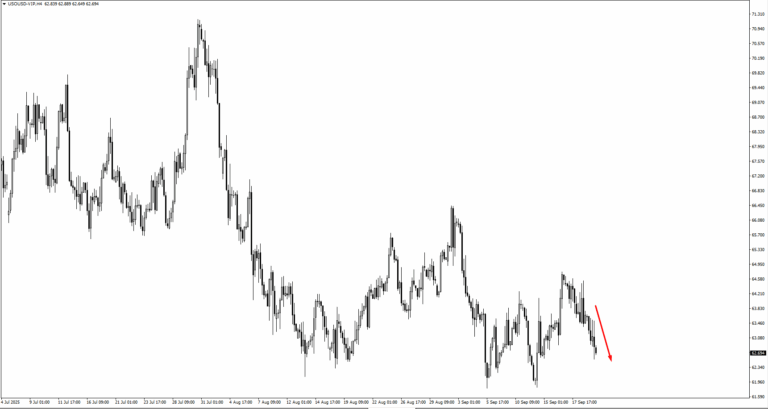
Crude oil (CL-OIL) is trading at $63.61, down 0.03% on the day, showing continued consolidation after a volatile year. Prices fell sharply to a low of $55.11 in April, before surging to $77.90 in July, only to retrace back into the low-to-mid 60s range.

The moving averages (5, 10, 30) are compressed and flat, suggesting a lack of clear momentum. The MACD histogram is hovering around the zero line, confirming neutral momentum and the absence of a decisive trend. This signals that oil is stuck in a sideways market, waiting for a catalyst.

Immediate support lies around $61.50–62.00, a zone that has held multiple times. A break below could reopen the path toward the $59.00 handle. On the upside, resistance sits at $66.50, followed by the more significant $70.00 level.

Overall, oil is consolidating within a tight range, with traders watching whether macroeconomic cues, such as US inventory data or OPEC+ policy will drive the next breakout.

Cautious Outlook

In the short term, crude prices are expected to trade within a $59–68 band, underpinned by ongoing supply constraints but limited by uncertainty over the US Federal Reserve’s policy direction.

As long as Kurdistan’s shipments remain halted and Venezuelan flows restricted, downside risks seem contained. Still, many market participants are waiting for confirmation from official US inventory figures before making firmer bets on a breakout.

Create your live VT Markets account and start trading today.

Monthly Analyst Scope: Spotting Insider Moves

From policy tweets to sudden token transfers, those with privileged knowledge often act ahead of time, leaving subtle hints that sharp-eyed investors can catch. Politicians, corporate executives, and crypto whales have all been known to shift assets before market-shaking announcements go public.

This leaves ordinary traders vulnerable when volatility strikes without warning. Yet, by learning to recognise unusual trading flows and whale activity, even newer investors can react quicker and potentially benefit from these signals.

This piece explains how insider trading differs from market manipulation, explores real-world examples from equities and crypto, and offers practical ways to identify the signs of an imminent ‘rug pull’ or a major market swing.

Insider Trading Vs Market Manipulation

First, some groundwork. The US Securities and Exchange Commission defines insider trading as the act of trading a security based on material, non-public information, thus violating a duty of trust.

Think of a government official privy to a forthcoming policy change who secretly buys stocks set to gain. Or a company CEO who quietly dumps shares before weak earnings are announced. Both fall under unlawful insider trading.

Market manipulation, by contrast, refers to artificially steering an asset’s price, demand, or supply. This could involve spreading false news, coordinating trades to trigger a deceptive rally, or tampering with quote data.

For instance, tweeting fake information to push a stock lower, only to scoop it up cheaply and profit once the truth surfaces, is market manipulation.

Both practices undermine trust and fairness in markets, which is why regulators and the public are increasingly questioning whether the powerful are ‘playing’ the system.

Important Note:

Retail traders should never engage in illegal insider trading. All methods discussed here rely solely on public data, like disclosures or on-chain analytics. Responding to such information, even if it points to someone else trading with insider knowledge, is entirely legal. It can, in fact, help to level the playing field.

Real-World Cases Of Suspicious Trades Ahead Of News

Trump’s Tariff Tweets And Well-Timed Bets

Back in April 2025, President Trump jolted markets by unveiling sweeping tariffs that initially sent stocks tumbling, only to reverse and suspend most of them, fueling a sharp rebound. The S&P 500 jumped more than 9% in a single session following his U-turn.

Just hours before that recovery, Trump had tweeted, ‘This is a great time to buy,’ raising eyebrows. At the same time, mystery traders had already placed enormous bets on a rally.

One anonymous trader snapped up 420,000 S&P E-mini futures right before Trump declared that talks with China were “back on track,” pocketing an estimated $1.8 billion.

Across several trades, these unidentified players reportedly made around $3.5 billion. As one veteran remarked, ‘There’s definitely funny business going on,’ pointing to how frequently someone seemed perfectly positioned for Trump’s announcements.

Congressional Trades Before Market Shifts

Lawmakers were not idle either. During the nine days surrounding Trump’s tariff flip, more than 30 members of Congress conducted over 1,200 stock transactions worth up to $28 million.

Many of these trades stood to gain from the rebound, executed even before Trump’s tone softened publicly.

While some insisted blind trusts or advisers were managing their portfolios, the timing raised suspicions. Representative Alexandria Ocasio-Cortez noted ‘interesting chatter on the floor’ and demanded full disclosure from any lawmaker trading within 48 hours of the events.

Today, tracking political trades has become a key red flag for switched-on retail investors.

Crypto Whale Dump: Ripple’s XRP

The crypto sphere has its share of insider manoeuvres, too. In July 2025, following a favourable court ruling that propelled XRP to $3.60, a multi-year peak, a wallet tied to Ripple’s co-founder Chris Larsen shifted 50 million XRP (worth $175 million) to exchanges and wallets.

Blockchain analysts found roughly $140 million of that stash was sold.

Within two weeks, XRP had collapsed 25% to $2.72.

Retail holders accused Larsen of ‘dumping’ at the top, sparking debate over whether Ripple’s leadership was acting in bad faith.

Regardless, blockchain data told the story: a major insider had moved vast sums ahead of a steep decline. For those monitoring whale wallets, the red flag was visible.

Tracking Insider Moves In US Equities

Follow The Smart Money On Capitol Hill

The 2012 STOCK Act requires members of Congress to disclose their trades, though they have 45 days to file them. Even with delays, these disclosures can reveal useful patterns.

Paul Pelosi, husband of former Speaker Nancy Pelosi, famously beat the market with returns of 65% in 2023 and 71% in 2024, largely from timely bets on Nvidia and Alphabet. His success inspired “Congress-tracking” ETFs such as NANC (Democrats) and KRUZ (Republicans).

Retail traders can access free resources like Capitol Trades or Quiver Quant to see what politicians are buying or selling. Watching clusters of trades in sectors linked to upcoming policy can be telling. For example, multiple lawmakers piling into defence stocks before a Pentagon contract announcement is hardly a coincidence.

Monitor Corporate Insider Filings

Corporate insiders, from CEOs to major shareholders, must submit Form 4 to the SEC whenever they trade company stock. These filings are public, providing insight into executive sentiment.

Sites like OpenInsider, Finviz, or the SEC’s EDGAR system make it easy to track such transactions. A cluster of insider buys often signals confidence. Heavy or sudden selling may indicate worries, or simply profit-taking. Context is crucial, but unusual activity often precedes bigger moves.

Watch Unusual Options Activity

Options markets can act as a canary in the coal mine. Surges in call or put volume sometimes flag that someone is betting on a large price swing.

For instance, Nasdaq call volumes spiked the day before Trump scrapped tariffs, hinting that some traders had advance knowledge. Platforms like Unusual Whales, Barchart, or broker tools can help you monitor these trends.

Remember, not every big options move is insider-driven. Some may be hedges. Treat it as one clue among many.

Crypto: Spotting The Whales Before They Strike

Track Whale Wallets With On-Chain Tools

Blockchain is transparent. Large transfers, especially from private wallets to exchanges, often foreshadow market action. Tools like Whale Alert broadcast these moves in real time.

If a founder or major holder shifts coins onto an exchange, it could signal upcoming selling pressure. Block explorers, such as Etherscan or advanced platforms like Nansen, make it easier to follow the trail of smart money.

Watch Token Unlocks And Distribution Schedules

Founders and early investors often hold locked tokens that eventually become tradable. Websites like TokenUnlocks track when these events occur.

If large unlocks line up right after a price surge, expect potential selling pressure.

Spot the Red Flags of Rug Pulls

A ‘rug pull’ happens when project developers drain liquidity and abandon a token. Warning signs include:

– Concentrated ownership, with just a few wallets holding the majority.

– Developers controlling the liquidity pool.

– Suspicious wallet transfers into mixers or exchanges.

– Sudden radio silence or vague communication from the project team.

Conclusion: Staying One Step Ahead As A Retail Trader

In today’s markets, a single tweet or whale transfer can send prices swinging. While retail traders don’t have insider access, monitoring public signals can sharpen their edge. Blockchain flows, congressional disclosures, and options activity all provide breadcrumbs.

Not every unusual trade ends in a headline. But many headlines leave traces. The goal is to catch those signs early, adjust your strategy, and avoid being blindsided.

Stay alert. Stay informed. And trade with purpose.

Dividend Adjustment Notice – Sep 23 ,2025

Dear Client,

Please note that the dividends of the following products will be adjusted accordingly. Index dividends will be executed separately through a balance statement directly to your trading account, and the comment will be in the following format “Div & Product Name & Net Volume”.

Please refer to the table below for more details:

Dividend Adjustment Notice

The above data is for reference only, please refer to the MT4/MT5 software for specific data.

If you’d like more information, please don’t hesitate to contact [email protected].

Week Ahead: Coins Move Into Spotlight

Forget the hype and the memes. Bitcoin has powered its way to $120,000, more than doubling over the past year. Yet this rally carries a different tone.

The speculative mania that once defined crypto booms has taken a back seat. Instead, late 2025 is being driven by global liquidity, institutional demand, and a regulatory landscape that is at last opening the door to mainstream finance.

Liquidity And Scarcity

Liquidity worldwide is expanding at an unprecedented pace, with central banks injecting trillions into economies to plug fiscal holes and offset sluggish growth.

In the United States, the federal deficit has already topped $1 trillion in just nine months, pushing money supply to fresh records.

As currencies lose purchasing power, investors have been rotating into scarce assets. Gold has long played that role, but Bitcoin’s finite supply of 21 million coins gives it a digital scarcity that appeals to those seeking protection.

With a market capitalisation of $2.3 trillion, Bitcoin still represents only a fraction of gold’s $23 trillion. The gulf highlights both the scope for further upside and the risks involved.

Persistently high inflation and loose monetary policy continue to suppress real yields, creating favourable conditions for alternatives. However, should central banks shift course, the balance could change quickly, keeping forecasts on the cautious side.

Institutional Flows

Institutions are spearheading this cycle. US-listed spot Bitcoin ETFs have already pulled in over $100 billion within just a few months.

Another milestone arrived in August when the US government authorised crypto allocations within 401(k) retirement schemes, unlocking access to trillions of household savings.

Large asset managers, including BlackRock and Fidelit,y are developing retirement-oriented crypto products, embedding digital assets into the fabric of long-term investment planning.

Unlike past surges, these inflows represent patient, regulated, and more persistent capital. That could help temper volatility, but the picture depends heavily on political and regulatory stability.

A shift in the tone of lawmakers or watchdogs could slow momentum, keeping the outlook evenly balanced between optimism and caution.

Retail On The Sidelines

Retail traders, once the lifeblood of parabolic rallies, have yet to re-engage. Downloads for trading apps like Coinbase and Robinhood remain subdued, while Google search activity lags behind prior bull markets.

This is striking given Bitcoin has outpaced the S&P 500 by a factor of five over the past year. The muted retail presence suggests pent-up demand; traders waiting for a catalyst.

If headlines of record highs or big corporate adoption hit the mainstream, retail flows could return rapidly. With ETFs and fintech apps lowering barriers to entry, participation has never been easier.

Most analysts expect retail involvement to reappear eventually, though when it does, it could revive the volatility seen in earlier cycles.

Regulation Opens The Door

The regulatory backdrop is shifting, too. The US Securities and Exchange Commission has streamlined rules for commodity-based ETFs, explicitly extending coverage to digital assets.

Exchanges such as Nasdaq, NYSE Arca, and Cboe can now list funds much faster, sidestepping the lengthy approval process.

Grayscale’s Digital Large Cap Fund, holding Bitcoin, Ethereum, Solana, and XRP, has already reaped the benefits.

This sets the stage for a wave of multi-crypto ETFs, giving institutions fresh allocation routes and retail investors simpler access through established brokerage accounts.

The cautious take is that while more products will attract flows, demand could thin out if too many arrive at once.

Market Movements This Week

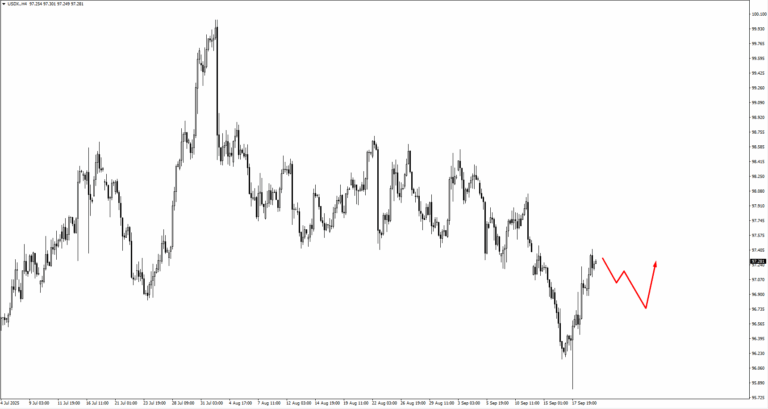
The dollar index is holding near 96.60, with bullish setups possible if consolidation continues.

EURUSD risks slipping below 1.17932, while GBPUSD faces pressure near 1.3540, with 1.3515 and 1.3605 also in play.

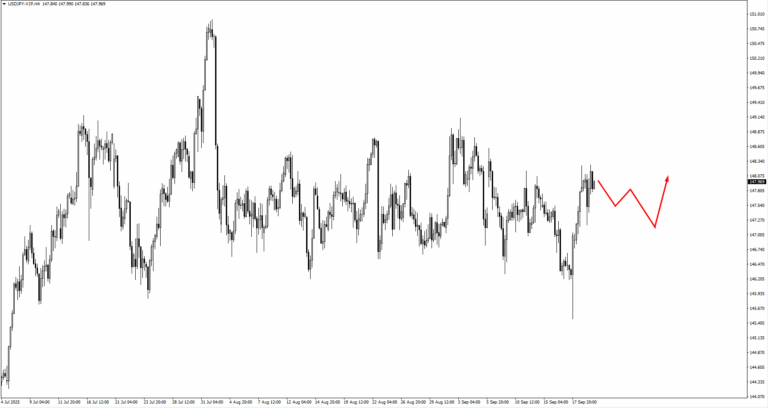
USDJPY broke the 146.298 swing low before rebounding, leaving 147.00–147.35 as key levels to monitor.

USDCHF is building support at 0.7915–0.7890, while AUDUSD and NZDUSD remain under pressure near 0.6640 and 0.5900–0.5920 respectively. USDCAD could break higher through 1.37666 or attract buyers near 1.3700.

Oil is balanced at 62.40, or 61.825 if it breaks lower. Gold retains scope toward 3740, 3810, and 3835, while supports sit at 3590 and 3550.

Natural gas stays weak after breaking 2.84, with 2.95–2.98 acting as short-term resistance. The S&P 500 is aiming for 6750 and 6840, though stretched valuations may weigh.

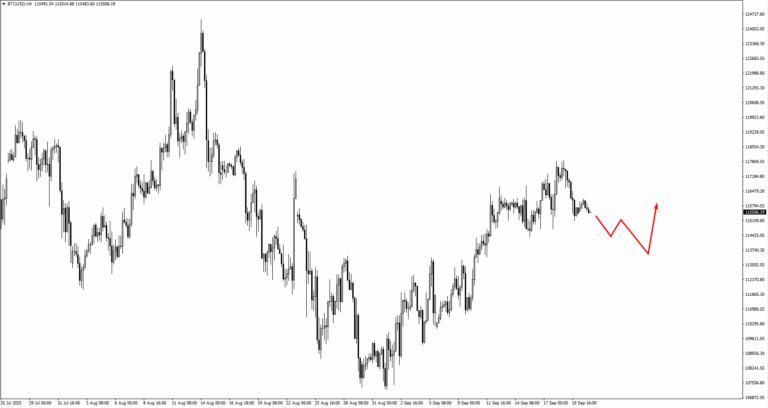
Bitcoin is consolidating after trading down from 118,050, with 112,650 the next area to test.

Key Events This Week

The week begins in Australia, where RBA Governor Michele Bullock is due to speak on Monday, 22 September. Markets will listen closely for any hints that the central bank is leaning toward cutting rates. With growth slowing and external headwinds mounting, even a small shift in language could move the Australian dollar.

On Tuesday, 23 September, attention turns to the UK, where Bank of England Governor Andrew Bailey is expected to speak. Most analysts see no further cuts from the BoE this year, and traders will be watching closely to see whether his remarks confirm that stance.

The same day brings a heavy run of flash PMIs. In Germany, manufacturing is forecast at 50.0 versus 48.8 previously, while services are seen at 49.5 versus 49.3.

For the eurozone, manufacturing is expected at 47.2 versus 47.0, and services at 53.6 compared with 54.2 prior. The UK’s own releases are forecast at 47.2 for manufacturing and 53.6 for services. In the US, manufacturing is projected at 51.8 versus 53.0 previously, with services at 53.8 compared with 54.5. These figures will provide a crucial test of global momentum after the softer US jobs report raised expectations for Fed cuts.

Midweek on Wednesday, 24 September, the calendar is quiet, offering markets a pause to digest the PMI releases before the next round of central bank decisions.

Thursday, 25 September, sees the Swiss National Bank policy decision, with the rate expected to remain steady at 2.15 percent. Later in the day, the US publishes its final Q2 GDP print, with forecasts unchanged at 3.30 percent. While the headline is steady, traders will be combing through the details for clues on underlying demand.

The week concludes on Friday, 26 September, with the release of the Core PCE Price Index, the Fed’s preferred inflation measure. A reading of 0.2 percent month-on-month versus 0.3 percent previously would reinforce expectations that the central bank could cut rates twice before the end of the year. An upside surprise, however, could challenge that view and slow the dollar’s recent decline.

Next week brings further tests, with the RBA cash rate, US JOLTS job openings, and the key non-farm payrolls report on October 3. These releases will be decisive in shaping central bank expectations into the final quarter of the year.

Create your live VT Markets account and start trading now.

Auto manufacturers succeed as technology faces challenges, pushing investors to rethink their sector strategies.

The US stock market showed mixed results. Auto manufacturers gained, while big tech struggled. Analysts are examining these trends to improve their strategies. Tesla’s stock rose by 4.32%, thanks to strong quarterly production figures and a positive outlook. This increase in the auto sector highlights a renewed emphasis on electric vehicles and sustainable transportation, suggesting potential for growth.

Tech Sector Overview

Microsoft’s stock decreased by 0.60%, reflecting cautious sentiment in the tech sector. In contrast, Oracle’s stock rose by 1.83%, showing strength in cloud services. ServiceNow saw a decline of 2.22%, likely due to profit-taking and market adjustments. Consumer sectors sent mixed signals. Apple’s stock rose by 2.96% due to strong demand and growth strategies. However, Amazon’s stock fell by 0.55%, possibly indicating concerns over retail performance or logistics. Today’s market atmosphere is cautious yet open to opportunities, focusing on sector-specific news and economic indicators. The growth in the auto sector indicates a shift towards forward-looking industries, while the decline in tech suggests the need for strategy adjustments. Analysts recommend attention to the evolving auto sector, capitalizing on electric vehicle trends. Maintaining a balanced portfolio could help manage risks from tech market fluctuations, while keeping an eye on tech innovations could reveal future opportunities.

Trading Strategies and Market Conditions

With the strength in the auto sector, bullish options strategies on Tesla could be beneficial. The recent 4.32% jump is supported by production numbers that exceeded estimates and a strong September jobs report suggesting ongoing consumer spending. Traders might consider buying call debit spreads on TSLA to leverage this momentum while managing risk. The tech sector’s struggles, especially in software, seem to stem from broader economic concerns. With inflation rising to 3.1% last month, the market appears to be pricing in a more hawkish Federal Reserve, which can pressure growth-oriented tech valuations. We are exploring put spreads on tech ETFs to hedge against potential declines ahead of the November Fed meeting. However, the strength in Apple and Oracle indicates that this isn’t an overall tech sell-off but rather a strategic rotation. Apple’s 2.96% gain follows reports of record pre-orders for its new product line, showing its brand strength is protecting it from wider consumer concerns. This variation within the sector makes pairs trading appealing, such as going long AAPL calls while taking puts on a broader software index. Amazon’s slight dip could signal caution for the upcoming holiday retail season. The market seems worried about renewed supply chain issues, particularly with national shipping union negotiations beginning again. This uncertainty may create opportunities for bearish calendar spreads on AMZN, playing on near-term concerns. Overall market volatility is higher, with the VIX steady around 19, reflecting a mix of caution and opportunity. This environment may be favorable for traders who sell premium, as we believe the broader market could remain range-bound while these sector rotations unfold. An iron condor on the SPX could be a useful strategy to generate income from sideways movement. We’ve seen similar rotations before, particularly in late 2021 and early 2022 when the Fed started its last major tightening cycle. During that time, value and cyclical stocks outperformed high-growth tech for several quarters. This historical context gives us added confidence that the ongoing shift toward industrial and auto manufacturers has further potential. Create your live VT Markets account and start trading now.

here to set up a live account on VT Markets now

Musalem acknowledged Congress’s appreciation for the independence of the central bank and its awareness of the potential inflationary effects of tariffs.

Musalem pointed out that Congress recognizes the need for central bank independence, but he questioned their views on aspects like tariffs. He believes the impact of tariffs on inflation will last for 2-3 quarters. He also suggested that many economists might overlook the upcoming renegotiation of the USMCA, starting in mid-2026 and expected to continue until the end of the year. Since 28% of U.S. imports come from this area, rising tariff rates could spark another wave of inflation, which might feel more like a long-lasting issue rather than a one-time event.

Inflation and Tariffs

Recent signs indicate that inflation might be more persistent due to tariffs. The expected impact over the next couple of quarters could mean the Federal Reserve may need to postpone any planned rate cuts, challenging the market’s recent optimistic outlook. This perspective is strengthened by the latest inflation data from August 2025, which showed core CPI unexpectedly rising to 3.8%. In 2023, total U.S. trade with Mexico and Canada exceeded $1.5 trillion, highlighting the importance of this trade area. Even a slight increase in tariffs on the 28% of U.S. imports from this region could significantly impact prices. In the upcoming weeks, it might be wise to adjust positions in interest rate derivatives. We could consider lowering expectations for early 2026 rate cuts by selling SOFR futures contracts set for March and June 2026. This strategy could pay off if the Fed needs to maintain higher rates longer than what the market currently expects.

Positioning for Long Term Risks

It’s also important to start factoring in the long-term risks from the USMCA renegotiation scheduled for mid-2026. One effective approach could be to buy longer-dated options on interest rate futures, which would benefit from increased uncertainty and inflation concerns. This “second wave” of inflation risk appears to be underestimated by the market right now. The currency market also presents opportunities, especially regarding the USMCA region. If the U.S. experiences sustained inflation while neighboring countries do not, it could result in a stronger U.S. dollar. We might explore long positions in USD/MXN or USD/CAD call options expiring in mid-2026 to take advantage of potential negotiation disruptions. Create your live VT Markets account and start trading now.

here to set up a live account on VT Markets now

Musalem advises caution on easing and supports careful monetary policy due to rising inflation pressures

The President of the St. Louis Fed prefers to take a careful approach regarding further interest rate cuts. He supports a small, quarter-point cut as a precaution but stresses the importance of maintaining monetary policy to tackle inflation that is above target. He recognizes the impact of tariffs on inflation, noting that their effects are still unfolding. Focusing too much on the labor market could lead to overly loose policies, which might backfire.

Current Financial Conditions

Loose financial conditions suggest that the Federal Reserve should be careful before making more cuts. This perspective contrasts with the current trends in policy. These comments challenge the market’s expectations for additional rate cuts. The recent Consumer Price Index (CPI) report for August 2025 shows inflation remains strong at 2.8%. This raises questions about strategies that rely heavily on a more aggressive easing cycle. It’s a clear warning to prepare for a potential hawkish surprise from the Federal Reserve. We should consider interest rate derivatives that anticipate a longer period of higher rates. For instance, selling SOFR futures contracts set for early 2026 might be a good move if the market has to adjust and remove one of the expected cuts. This situation is similar to late 2023 when traders underestimated the Fed’s commitment to keeping rates high to combat inflation.

Volatility and Market Strategy

In this climate of increasing policy uncertainty, volatility may be undervalued. We should think about purchasing VIX call options or using option spreads on the S&P 500 to safeguard against a market dip if the Fed indicates a pause. The strong job report for August, showing 190,000 new payrolls, supports cautious actions from officials like Musalem. The commentary also points to a stronger U.S. dollar in the coming weeks. A less accommodative Fed compared to other central banks will likely attract investment, pushing the DXY closer to its highs from earlier this year. We can act on this view by buying call options on the dollar index or puts on currencies impacted by U.S. policy, like the Japanese Yen. The mention of tariffs raising inflation is an important reminder of ongoing structural price pressures. This supports the notion that inflation may not quickly return to the 2% target as many expect. This environment favors strategies that thrive in sustained, moderate inflation, with a central bank that must remain watchful. Create your live VT Markets account and start trading now.

here to set up a live account on VT Markets now

Wishing a Shanah Tovah to celebrants; stock markets often perform poorly during this festive period

US stock market futures are down as Rosh Hashanah begins. Late September hasn’t been good for stocks historically, with an average decline of 1.1% over the last ten days since 1928. The time between Rosh Hashanah and Yom Kippur usually sees an average drop of 0.5% in the S&P 500. Yom Kippur ends at sunset on October 2. This year, the S&P 500 has mostly broken this pattern, even though current futures have fallen by 0.3%.

Historically Weak Period for Stocks

We’re entering a historically weak time for stocks, highlighted by the saying “Sell Rosh Hashanah, buy Yom Kippur.” Since 1928, the S&P 500 has often dropped over 1% in the last ten days of September. Following last week’s hawkish comments from the Federal Reserve, this seasonal trend feels even more significant. In this context, expected volatility is rising. The VIX has risen to over 17 this past week, a noticeable increase from summer lows near 13 back in July 2025. Traders might consider buying call options on the VIX, expecting it to spike towards 20 if this seasonal dip happens.

Equity Strategies and Market Positioning

On the equity side, more traders are seeking downside protection. The CBOE put/call ratio has recently reached 0.95, indicating traders are preparing for a market drop. We could consider buying near-term put options on major indices, aiming for expirations right after Yom Kippur ends on October 2 to take advantage of this weak period. For those who think any downturn will be small, selling out-of-the-money call spreads could be a good strategy. This approach allows us to earn premium, betting that the market will stay flat or dip slightly instead of making a strong rally before early October. The limited risk with a spread is appealing given the current uncertainty. Create your live VT Markets account and start trading now.

here to set up a live account on VT Markets now

Canada’s producer price index rises 0.5% monthly, surprising analysts despite falling oil prices and increasing raw materials

Canada’s producer price index went up by 0.5% in August, exceeding the expected increase of 0.2%. Previously, it had risen by 0.7%. Meanwhile, US producer prices increased by 4.0% year-on-year, up from 2.6% before. The raw materials price index fell by 0.6% from the previous month but rose by 3.2% over the year. When excluding crude energy, the raw materials price index jumped by 15.5% in the last year.

Market Reaction to Oil Prices

Falling oil prices have helped stabilize producer prices, but recent rises caught the market off guard. Key contributors to this increase included chemicals, meat, fish and dairy, motor vehicles, and non-ferrous metals like gold and silver. Energy costs dampened their effect. Meat prices, especially beef, rose sharply by 5.2% from the previous month. Even though crude oil prices dropped by 16.2% year-on-year, their impact on the index remains significant, as low oil prices may not last. If we disregard crude oil, we might uncover more inflation issues, similar to trends seen in 2021-22. This highlights how oil prices affect broader economic indicators. The latest producer price data from Canada is unexpectedly high, indicating that inflation pressures are not easing as quickly as many hoped. We need to reconsider the idea that the Bank of Canada might lower rates soon.

Implications for the Canadian Economy

The main point is that decreasing oil prices have been hiding a larger problem. While WTI crude is significantly down from last year, around $75 per barrel, the raw materials index (without crude energy) has surged by 15.5%. This pattern resembles the inflation spike of 2021-2022, suggesting widespread price pressures that the market may be underestimating. For those trading interest rates, this signals a shift towards a more hawkish Bank of Canada. The market had anticipated steady rates through early 2026, but may now need to rethink this outlook. Consider preparing for higher yields by selling Canadian 10-year bond futures (CGB) or using options to bet on a possible rate hike before the year ends. This situation also affects the Canadian dollar. A central bank that needs to act more aggressively typically strengthens its currency. This makes a compelling case for buying the Canadian dollar against the US dollar, possibly through call options or by selling USD/CAD futures. The report highlights strength in meat and precious metals like gold and silver, indicating specific commodity opportunities. We should look into long positions in gold and silver futures as a direct way to hedge against persistent inflation, which is now evident in official data. Finally, the gap between overall inflation and the underlying details adds uncertainty. This environment could lead to higher volatility in Canadian markets. Buying options that benefit from bigger price movements, such as straddles on the S&P/TSX 60 index, might be a smart strategy in the coming weeks as the market processes this new information. Create your live VT Markets account and start trading now.

here to set up a live account on VT Markets now

Back To Top
server

Hello there 👋

How can I help you?

Chat with our team instantly

Live Chat

Start a live conversation through...

  • Telegram
    hold On hold
  • Coming Soon...

Hello there 👋

How can I help you?

telegram

Scan the QR code with your smartphone to start a chat with us, or click here.

Don’t have the Telegram App or Desktop installed? Use Web Telegram instead.

QR code