

Key Points
- TSLA traded near $395.25, down 3.45%, after hitting a one-month low.
- Traders are watching speculation around a possible Tesla and SpaceX merger ahead of SpaceX’s planned IPO.
- Traders are watching $404.36 resistance and $384.21 support as the next key range.
TSLA came under pressure on Tuesday as Tesla shares fell to a one-month low, with traders weighing growing speculation around a possible Tesla and SpaceX merger.
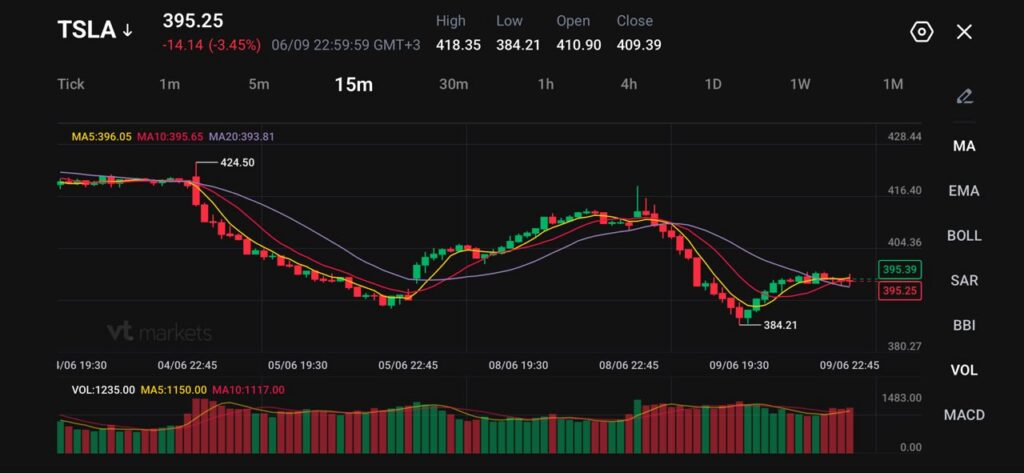
The stock closed near $396.68, down about 3%, before slipping slightly in extended trading. On the 15-minute chart, TSLA traded near $395.25, down 3.45%, after falling from an intraday high of $418.35.
The weakness comes as traders look ahead to SpaceX’s planned IPO, which has fuelled talk of whether Elon Musk may eventually combine his automotive, AI, and space businesses.
Why Traders Are Watching This
Traders are watching TSLA because the merger story has created a fresh layer of uncertainty around the stock.
SpaceX is reportedly seeking to raise $75 billion at a valuation of $1.8 trillion, with investor demand said to be far above available shares. Tesla is also mentioned heavily in SpaceX’s latest filing, while the two companies already share links across AI tools, chip development, computing infrastructure, and supply chains.
Some analysts see a merger as a way to create a broader AI and infrastructure powerhouse. Tesla could bring real-world vehicle data and autonomous driving assets, while SpaceX could add satellite, computing, and aerospace infrastructure.
However, the market is also weighing the risks. A deal could require a premium, face pushback from SpaceX traders, attract regulatory scrutiny, and raise dilution concerns for Tesla shareholders.
That uncertainty has left TSLA under pressure, even as some research firms argue Tesla shareholders could gain strong leverage in any combined entity.
Key Trading Levels
| Level | What Traders Are Watching |
| 424.5 | Previous upper swing and wider recovery level |
| 418.35 | Intraday high and stronger resistance |
| 410.9 | Session open reference |
| 404.36 | Key resistance from the chart |
| 396.05 | 5-period moving average |
| 395.65 | 10-period moving average |
| 395.25 | Current trade zone |
| 393.81 | 20-period moving average and short-term support |
| 384.21 | Intraday low and key downside support |
TSLA is trading near its short-term moving averages, with the 5-period MA at 396.05, the 10-period MA at 395.65, and the 20-period MA at 393.81.
The chart shows a sharp drop from the $418 area, followed by a rebound from $384.21. However, the recovery has started to flatten near $395, which suggests traders are waiting for a clearer signal.
A move above $404.36 would improve the short-term recovery setup. A break below $393.81 would weaken the rebound, while a drop below $384.21 could bring sellers back into control.
Bullish and Bearish Setups
| Setup | Trigger | Potential Market Reaction |
| Bullish Recovery | Move above 404.36 | Buyers may target 410.90, then 418.35 |
| Pullback Setup | Hold above 393.81 | Traders may watch for renewed buying interest |
| Bearish Break | Move below 393.81 | Sellers may target 384.21 |
| Deeper Sell-Off | Break below 384.21 | Downside may extend toward 380.27 |
The bullish setup depends on TSLA reclaiming $404.36. That would show buyers are gaining confidence after the SpaceX-driven sell-off.
The pullback setup may become cleaner if TSLA holds above $393.81 and stabilises. That would suggest sellers are losing short-term control.
The bearish setup builds if price breaks below $393.81. A move under that level could bring $384.21 back into focus and keep the stock under pressure.
Disclaimer
The price levels and trade scenarios above reflect the author’s view at the time of writing and do not represent financial advice or an official recommendation from VT Markets. Traders should conduct their own analysis and manage risk carefully.
Trade TSLA CFDs With VT Markets
TSLA remains active when traders react to Elon Musk headlines, AI developments, EV demand, SpaceX speculation, and broader US tech sentiment.
With VT Markets, traders can access TSLA share CFDs alongside major indices, forex, gold, oil, ETFs, and other global CFD markets from one platform. This helps traders follow Tesla’s price action while also tracking related moves in the Nasdaq, mega-cap tech, and risk sentiment.
Use VT Markets’ charting tools to monitor support, resistance, moving averages, and breakout behaviour as the next TSLA setup develops.
Create a live VT Markets account today to access our platform features, including market insights and educational content.
Why Trade TSLA as a CFD?
TSLA CFDs allow traders to take a view on rising or falling Tesla price moves without owning the underlying shares.
That flexibility can be useful when the stock reacts quickly to merger rumours, IPO headlines, AI updates, delivery data, or broader tech volatility. If TSLA breaks higher, traders can watch bullish continuation. If merger concerns deepen, traders can monitor downside setups.
With VT Markets, traders can follow TSLA price action in real time and compare it with other major CFD markets from one account.
Join our upcoming webinar and learn how to trade candlestick patterns with confidence, clarity, and real market confirmation.

What to Watch Next
Traders should watch $404.36 resistance and $393.81 short-term support.
A break above $404.36 could support a recovery toward $410.90 and $418.35. A move below $393.81 would weaken the rebound and shift focus back to $384.21.
Beyond the chart, traders should watch SpaceX IPO headlines, any fresh comments from Elon Musk, analyst views on merger odds, and broader sentiment across US tech stocks.
FAQs
Why is TSLA Falling?
TSLA is falling as traders react to speculation around a possible Tesla and SpaceX merger. The uncertainty has pressured sentiment, even though some analysts believe Tesla shareholders could benefit from a future deal.
What is the Key Level to Watch for TSLA?
The key upside level is $404.36. A move above this area could support a recovery toward $410.90. On the downside, $393.81 is the first short-term support level, followed by $384.21.
Could TSLA Recover?
TSLA could recover if buyers defend the $393.81 area and push price above $404.36. A stronger recovery would need renewed confidence around the SpaceX IPO, merger speculation, or broader tech sentiment.
What Could Push TSLA Lower?
TSLA could move lower if merger concerns grow, SpaceX IPO headlines raise dilution fears, or broader tech sentiment weakens. A break below $384.21 would strengthen the bearish setup.
Can I Trade TSLA With VT Markets?
Yes. VT Markets offers access to TSLA share CFDs, allowing traders to take a view on rising or falling Tesla price moves without owning the underlying stock. Traders can also access forex, gold, oil, indices, ETFs, and other CFD markets from one platform.
Start trading now – Click here to create your real VT Markets account


