

Key Points
- The Dow Jones Industrial Average surged 874 points, or 1.7%, to a record close of 51,561.93.
- Value sectors led the move, while the Nasdaq slipped 0.1% as traders rotated out of high-growth tech names.
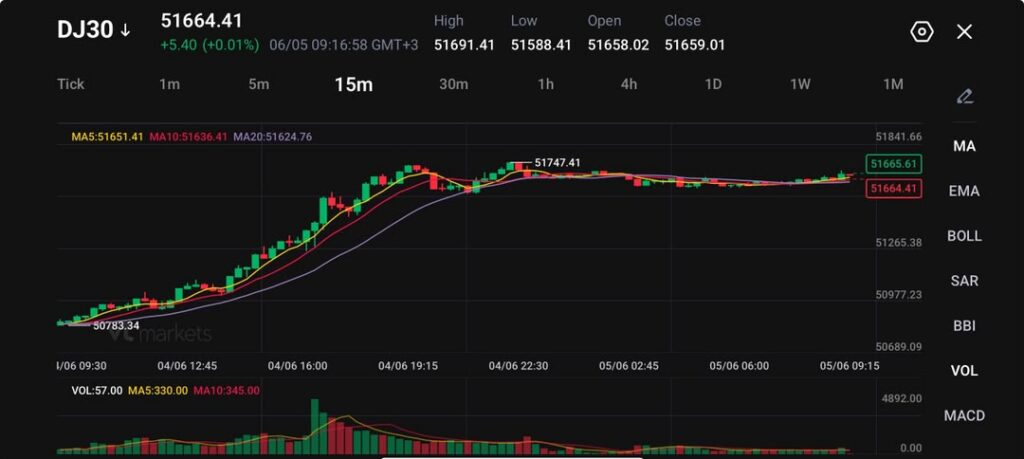
- DJ30 is holding near 51,665, with traders watching 51,747 resistance and 51,266 support.
The Market Move
DJ30 held near 51,665 after the Dow Jones Industrial Average rallied to a fresh record close, supported by strong gains in healthcare, banks, and consumer staples.
The move showed a clear rotation beneath the surface. Traders did not abandon equities. Instead, they shifted away from stretched AI and semiconductor names and moved into value-linked stocks that had lagged the broader market rally.
UnitedHealth Group rose more than 5%, JPMorgan Chase gained 3%, and Walmart added nearly 1%. The rally helped the Dow outperform the S&P 500, which gained 0.4%, while the Nasdaq Composite slipped 0.1%.
Why Traders Are Watching This
Traders are watching DJ30 because the Dow is gaining while tech momentum cools.
Broadcom’s sharp drop of more than 12% after a revenue miss triggered profit-taking across semiconductor stocks. That gave traders a reason to reduce exposure to crowded AI names and rotate into steadier areas of the market.
This shift changes the leadership structure across US equities. If value stocks keep attracting inflows, DJ30 may stay supported even if tech-heavy indices struggle. If tech selling deepens, broader risk appetite could weaken and pull the index back from record levels.
Friday’s US jobs report now becomes the next major trigger. Economists expect 80,000 new jobs in May, down from 115,000 previously, while the unemployment rate is expected to hold at 4.3%. A softer labour market print could support rate-cut hopes, while a hotter reading may revive yield pressure.
Key Trading Levels
| Level | What Traders Are Watching |
| 51,747 | Recent swing high and breakout resistance |
| 51,665 | Current trade zone |
| 51,634 | 10-period moving average |
| 51,624 | 20-period moving average |
| 51,561 | Dow record close reference |
| 51,266 | First key downside support |
| 50,783 | Lower chart support |
DJ30 is trading above its short-term moving averages, with the 5-period MA at 51,651, the 10-period MA at 51,634, and the 20-period MA at 51,625.
That keeps the short-term structure tilted toward buyers. However, price has started to flatten after the sharp rally, which suggests traders may be waiting for confirmation before pushing the index higher.
A clean break above 51,747 would strengthen the bullish setup and keep record highs in focus. A drop below the moving average cluster near 51,624 to 51,651 would suggest momentum is cooling.
Bullish and Bearish Setups
| Setup | Trigger | Potential Market Reaction |
| Bullish Breakout | Move above 51,747 | Buyers may target fresh record highs |
| Pullback Setup | Dip toward 51,624 to 51,651 | Traders may watch for renewed buying interest |
| Bearish Break | Move below 51,266 | Sellers may target 50,783 |
| Range Setup | Hold between 51,266 and 51,747 | Traders may wait for the jobs report |
The bullish setup depends on DJ30 holding above its moving average cluster and breaking above 51,747. That would suggest buyers are still willing to chase Dow strength despite tech weakness.
The pullback setup may become cleaner if price dips toward 51,624 to 51,651 and stabilises. This would show whether buyers are defending the new higher range.
The bearish setup only builds if DJ30 loses 51,266. A break below that level would suggest the value-led rally is starting to lose momentum.
Disclaimer
The price levels and trade scenarios above reflect the author’s view at the time of writing and do not represent financial advice or an official recommendation from VT Markets. Traders should conduct their own analysis and manage risk carefully.
Trade DJ30 CFDs With VT Markets
DJ30 remains active when traders rotate between tech, value stocks, defensive sectors, and rate-sensitive equities.
With VT Markets, traders can access DJ30 alongside major indices, forex, gold, oil, shares, ETFs, and other global CFD markets from one platform. This gives traders a wider view of market rotation, from Dow strength to Nasdaq weakness and broader S&P 500 momentum.
Use VT Markets’ charting tools to monitor support, resistance, moving averages, and breakout behaviour as the next DJ30 setup develops.
Join our upcoming webinar and learn how to trade candlestick patterns with confidence, clarity, and real market confirmation.

Start trading indices with VT Markets today.
Why Trade DJ30?
DJ30 CFDs allow traders to take a view on rising or falling Dow price moves without owning the underlying index constituents.
That flexibility can be useful when market leadership changes quickly. If value stocks keep outperforming, traders can watch bullish setups in DJ30. If jobs data pressures equities, traders can also monitor downside moves as volatility builds.
With VT Markets, traders can follow DJ30 price action in real time and compare it with other major CFD markets from one account.
What To Watch Next
Traders should watch the 51,747 resistance level and the 51,266 support level.
A break above 51,747 could extend the record-setting move and keep buyers in control. A move below 51,266 would weaken the short-term setup and bring 50,783 back into focus.
The next major catalyst is the US jobs report. A soft print could support rate-cut expectations and help equities hold their gains. A stronger print may lift yields and test whether the Dow’s value-led rally has enough strength to continue.
FAQs
Why Is DJ30 Rising?
DJ30 is rising as traders rotate into value stocks, including healthcare, banks, and consumer staples. The move helped the Dow outperform tech-heavy indices as semiconductor stocks came under pressure.
What Is the Key Level to Watch for DJ30?
The key upside level is 51,747. A move above this area could support another push into record territory. On the downside, 51,266 is the first major support level to watch.
Why Are Value Stocks Outperforming Tech?
Value stocks are outperforming as traders take profit from crowded AI and semiconductor names. Broadcom’s revenue miss added pressure to chip stocks and pushed investors toward steadier sectors such as healthcare, banks, and consumer staples.
Can DJ30 Continue Higher?
DJ30 could continue higher if buyers hold the moving average cluster near 51,624 to 51,651 and push price above 51,747. A strong breakout would keep the bullish setup active.
Can I Trade DJ30 With VT Markets?
Yes. VT Markets offers access to DJ30 CFDs, allowing traders to take a view on rising or falling Dow price moves without owning the underlying index. Traders can also access forex, gold, oil, shares, ETFs, and other CFD markets from one platform.
Start trading now – Click here to create your real VT Markets account


