


Key Points
- ETH/USD traded at 2,300.71, up 17.07, or 0.75%, after reaching a session high of 2,301.92.
- Ethereum slipped below $2,300 and the 100-hourly Simple Moving Average, with bearish trend-line resistance near $2,300.
- Traders are watching $2,320, $2,335, and $2,375 as recovery levels, while $2,250 remains the main downside line.
- The US Senate Banking Committee is reviewing the CLARITY Act, keeping crypto regulation in focus for ETH, Bitcoin, XRP, and the wider market.
Ethereum is struggling to regain control after slipping below $2,300. ETH/USD traded at 2,300.71, up 17.07, or 0.75%, at 05/13 06:47:10 GMT+3. The session high stood at 2,301.92, with a low of 2,272.05, an open at 2,288.63, and a close at 2,283.64.
The short-term setup remains fragile. Ethereum started a downside correction below the $2,280 zone and traded under $2,300 and the 100-hourly Simple Moving Average. A bearish trend line is forming with resistance at $2,300 on the hourly ETH/USD chart, using Kraken data.
That keeps the market stuck between dip buyers and sellers near resistance. Bulls need to push ETH above $2,320 before the recovery looks more convincing. Until then, the rebound remains a pause inside a weaker short-term structure rather than a clear trend reversal.
Macro Pressure Keeps Crypto Cautious
Ethereum is also trading against a tougher global backdrop. Asian markets weakened on Wednesday after hot US inflation data and a shaky Iran ceasefire hit risk appetite. The MSCI Asia-Pacific index outside Japan fell 0.6%, while Japan’s Nikkei 225 dropped 0.2% and US equity futures also slipped.
That risk-off tone can cap crypto rebounds. Higher inflation reduces the case for near-term Federal Reserve easing, while Middle East tensions keep oil and the dollar sensitive to fresh headlines. Wall Street closed lower after US inflation posted its sharpest rise in three years, raising expectations of a possible Fed rate hike.
Crypto tends to perform better when liquidity improves, the dollar weakens, and traders seek higher-risk assets. Hot inflation and renewed geopolitical risk push the market in the opposite direction. ETH can still rebound from support, but a stronger macro headwind may limit momentum above $2,300.
CLARITY Act Adds A Policy Catalyst
US crypto regulation is now another near-term driver. The Senate Banking Committee introduced the CLARITY Act, a major crypto market-structure bill designed to create a clearer regulatory framework for digital assets. The bill is set for committee review and addresses rules across stablecoins, anti-money laundering controls, DeFi, tokenisation, and SEC fundraising exemptions.
For Ethereum, clearer market rules could support institutional interest over time. ETH sits at the centre of DeFi, tokenisation, stablecoin settlement, and smart-contract activity, so regulation can affect demand for the wider Ethereum ecosystem.
The bill also introduces risk. The proposal would classify crypto exchanges, brokers, and dealers as financial institutions under the Bank Secrecy Act, which would bring anti-money laundering and customer due diligence duties closer to traditional finance standards.
It also says tokenised traditional financial assets would still fall under securities-law treatment.
Progress on the CLARITY Act could lift confidence across major crypto assets. Delays, stricter language, or political pushback could keep traders cautious, especially while ETH is already struggling at resistance.
Ethereum’s Long-Term Story Remains Intact
Ethereum still has a long-term structural story, even as price action stays weak. The Pectra upgrade, which activated on Ethereum mainnet at epoch 364032 on 07 May 2025 at 10:05 UTC, brought changes to both the execution and consensus layers. Ethereum.org says Pectra followed Dencun and improved the network for users, developers, and validators.
That roadmap supports Ethereum’s role as a settlement and smart-contract network. Yet upgrades do not always translate into immediate price strength. Traders still respond to liquidity, ETF flows, regulation, the dollar, and Bitcoin-led sentiment.
For now, ETH’s long-term utility is not enough to overpower short-term resistance. The market needs a stronger break above $2,320 and better volume before buyers can build a cleaner bullish case.
Technical Analysis
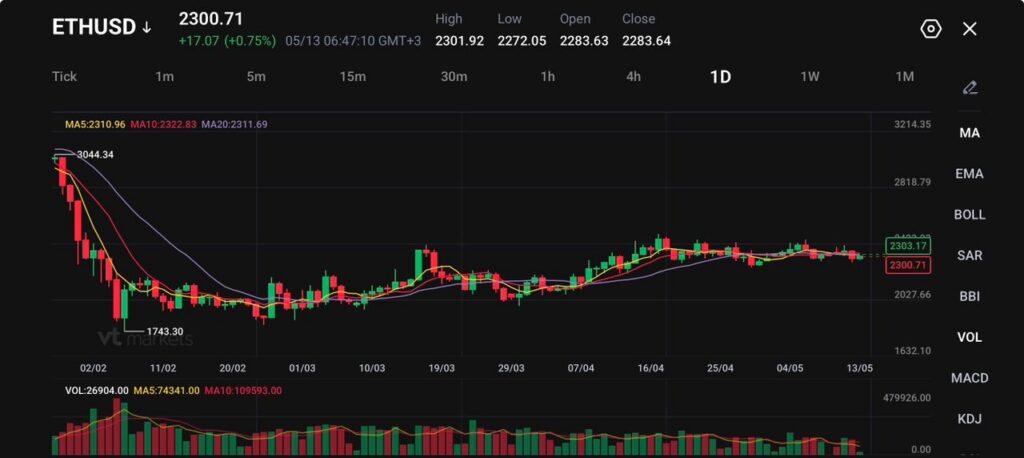
ETHUSD is continuing to consolidate around the 2,300 region, with price action stabilising after recovering from the sharp February selloff that dragged Ethereum down toward 1,743. The market has spent the past several weeks building a broad sideways base, suggesting volatility is cooling while traders wait for the next directional catalyst.
Technically, Ethereum is trading in a relatively balanced structure:
- MA5: 2,310.96
- MA10: 2,322.83
- MA20: 2,311.69
The moving averages are now tightly compressed around current price, which usually reflects consolidation and declining short-term momentum. Unlike Bitcoin, Ethereum has struggled to generate a strong breakout trend during the recent recovery phase, with rallies repeatedly fading near the 2,400–2,500 zone.
Key levels to watch:
- Immediate support: 2,250 → 2,100
- Major support: 2,000 → 1,740
- Resistance: 2,400 → 2,550 → 2,820
The 2,250–2,300 region remains the key near-term pivot. Buyers have consistently defended this area throughout April and early May, preventing a deeper retracement. As long as ETH continues holding above that zone, the broader recovery structure remains intact.
On the upside, bulls still need a decisive breakout above 2,400–2,550 to shift momentum more aggressively higher. A successful break there could reopen a move toward the broader resistance region near 2,800, which also aligns with the larger February breakdown area.
Volume has steadily declined during the consolidation phase, reinforcing the idea that the market is waiting for stronger macro or crypto-specific catalysts before committing to a larger move. Ethereum also continues to underperform some higher-beta crypto assets, reflecting cautious sentiment around network activity and institutional flows.
That said, the broader crypto environment remains relatively supportive. Bitcoin stability above key support levels has helped reduce downside pressure across the altcoin space, while expectations around regulatory clarity and continued ETF-related developments remain part of the longer-term narrative supporting digital assets.
For now, ETHUSD carries a neutral-to-cautiously bullish bias while holding above 2,250, though momentum remains range-bound until price can decisively clear the 2,400–2,550 resistance zone.
Cautious Forecast
Ethereum keeps a fragile recovery bias while it holds above $2,250. A move above $2,320 would strengthen the short-term setup, while a break above $2,335 would put $2,375 back in focus.
A failure at $2,300 to $2,320 keeps ETH exposed to another test of $2,265 and $2,250. A clean break below $2,250 would shift momentum toward $2,200, then $2,150 and $2,120. Stronger upside needs three signals to align: cooler macro pressure, constructive CLARITY Act progress, and a daily close back above the 2,310.96 to 2,322.83 moving-average zone.
Create a live VT Markets account today to access our platform features, including market insights and educational content.
Trader Questions
What Is Ethereum Trading At Today?
ETH/USD traded at 2,300.71, up 17.07, or 0.75%. The session high stood at 2,301.92, with a low of 2,272.05, an open at 2,288.63, and a close at 2,283.64.
Why Is Ethereum Struggling Near $2,300?
Ethereum is struggling near $2,300 because sellers are defending that area as short-term resistance. ETH is also trading below the 100-hourly Simple Moving Average, which keeps the near-term setup fragile.
A bearish trend line is forming with resistance near $2,300 on the hourly ETH/USD chart.
What Are The Key Ethereum Resistance Levels?
The first Ethereum resistance level is $2,300, followed by $2,320. The $2,320 level also aligns with the 50% Fibonacci retracement of the move from the $2,382 swing high to the $2,256 low.
Above $2,320, traders should watch $2,335, then $2,375. A break above $2,375 could open the path toward $2,420 and $2,440.
Where Is Ethereum Support?
Ethereum support sits first near $2,265, followed by the major support zone at $2,250.
A break below $2,250 could pull ETH toward $2,200. Further losses may expose $2,150, with the main support sitting near $2,120.
Is Ethereum Still In A Bullish Trend?
Ethereum’s short-term trend remains weak while price trades below the $2,300 resistance zone and below the 100-hourly Simple Moving Average.
On the daily chart, ETH is also trading below its short-term moving-average cluster. The 5-day moving average sits at 2,310.96, the 10-day moving average at 2,322.83, and the 20-day moving average at 2,311.69.
Start trading now – Click here to create your real VT Markets account


