


Key Points
- EU50 trades at 5845.64, down 50.22 (-0.85%), as selling pressure returns to European equities.
- The STOXX 600 is down about 0.5% at 610 points, though still above the 600.64 low seen earlier this week.
- Market breadth is weak, with about two-thirds of stocks declining and one-third rising, while travel and leisure (.SXTP) leads losses.
European equities weakened again on Thursday, with the EU50 index falling to 5845.64, down 50.22 (-0.85%). The decline follows a brief pause in selling on Wednesday as traders reassessed rising energy prices and the broader implications for Europe’s inflation outlook.
The wider European market shows similar pressure. The pan-European STOXX 600 is down about 0.5% at 610 points, although the index remains above the 600.64 low recorded earlier this week. Traders remain wary that elevated oil and gas prices could trigger another inflation wave across the region if supply disruptions linked to the Middle East conflict persist.
Europe remains highly sensitive to energy costs. Higher fuel prices can quickly affect manufacturing, transport, and household consumption. As a result, even modest increases in oil and gas prices can push traders to trim equity exposure. The cautious expectation is that EU50 may remain volatile while energy markets stay unstable.
Breadth Signals Weak Market Participation
Market breadth confirms that selling pressure extends across the index. About two-thirds of stocks are declining while one-third are rising, indicating that weakness spreads across multiple sectors rather than a single industry.
When breadth turns negative, rallies often struggle to gain traction because fewer stocks support the index. For EU50, this environment can lead to sharp but short-lived rebounds followed by renewed selling if macro risks remain unresolved.
A cautious forecast is that EU50 may continue trading unevenly in the near term, with traders responding quickly to shifts in energy prices and geopolitical developments.
Technical Analysis
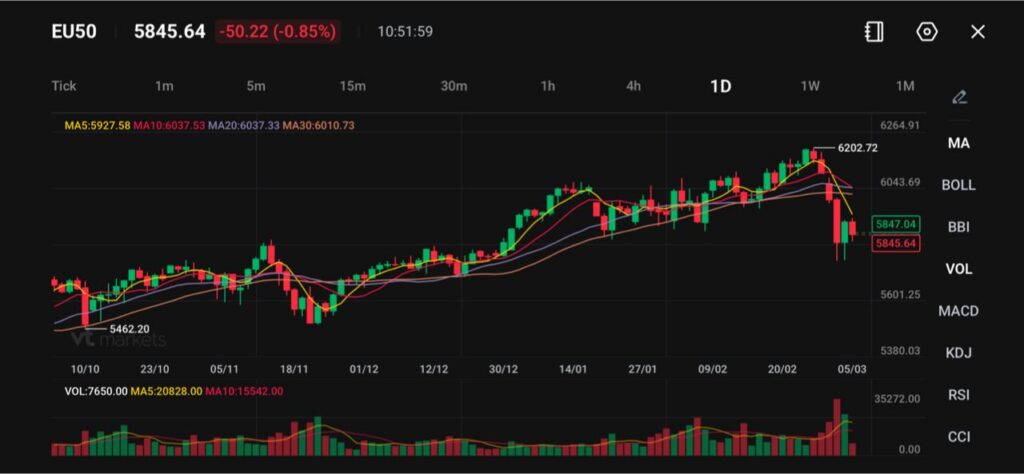
The EU50 index is trading near 5,845, down about 0.85%, as European equities extend their pullback after failing to hold above the recent peak around 6,202. The decline marks a notable shift in short-term momentum following the steady rally that had been building since late December.
From a technical standpoint, the index has fallen below its key short-term moving averages, with the 5-day moving average at 5,927 and the 10-day at 6,037, both now trending downward.
Price is also trading below the 20-day moving average (6,037) and approaching the 30-day average near 6,010, suggesting the recent bullish momentum has weakened and the market may be transitioning into a corrective phase.
The sharp drop earlier in the session pushed the index toward the 5,780–5,800 region before a modest rebound, indicating that buyers are attempting to stabilise the market around this support zone. If this level fails to hold, the next downside target could emerge around 5,600, where the broader uptrend previously found support.
On the upside, immediate resistance now sits near 5,900–5,930, followed by stronger resistance around 6,040, which aligns with the cluster of short-term moving averages.
Overall, the EU50’s broader trend remains constructive over the medium term, but the recent rejection near 6,200 and the break below short-term averages suggest that near-term consolidation or further downside pressure could persist before the index attempts another push higher.
What Traders Are Watching Next
Traders will closely monitor energy markets and geopolitical developments for signals that could influence European equities. Rising oil and gas prices remain a key risk for the EU50 because they affect inflation expectations and corporate costs across the region.
If energy prices continue climbing, the EU50 may struggle to regain upward momentum. If energy markets stabilise and geopolitical tensions ease, equity markets could attempt a recovery toward recent highs near 6202.72.
Learn more about trading Indices on VT Markets today.
Frequently Asked Questions (FAQs)
- What is the EU50 Index, and What Does It Represent?
EU50 tracks 50 large, liquid blue-chip companies across the euro area. Traders use it as a quick read on euro zone risk appetite, because it blends banks, industrials, consumer names, and energy-heavy firms into one price. - Why Does the EU50 React So Fast to Energy Shocks?
Energy costs flow into European inflation and corporate margins quickly. When oil and gas prices rise, investors often reprice rate expectations and earnings risk at the same time, which can pressure EU50 even if company news stays quiet. - What Does Today’s Move Tell Us About Risk Mood in Europe?
The drop to 5845.64, down 50.22 (-0.85%) says sellers still control the tape. The breadth picture reinforces that message, with about two-thirds of stocks declining and one-third rising, which usually points to broad de-risking rather than one-off profit taking. - Which Sectors Tend to Drive EU50 in This Setup?
In an energy-risk tape, energy-linked names can support the index while cyclicals drag. That fits the current sector split where energy (.SXEP) is rising, while travel and leisure (.SXTP) sits at the bottom. Defensives like utilities (.SX6P) and food and beverages (.SX3P) can reduce the downside but rarely lead a fast rebound. - How Do Traders Use the Moving Averages on EU50 Right Now?
Moving averages help traders judge whether a selloff stays tactical or turns into a trend shift. With price at 5845.64, the market sits below: MA5 5927.58, MA10 6037.53, MA20 6037.33, and MA30 6010.73. If EU50 fails to recover above 5927.58, many short-term traders treat rallies as sellable until price structure improves.
Start trading now – Click here to create your real VT Markets account


