


Key Points
- Nikkei225 traded near 66,593 after the Nikkei 225 fell 1.3% to close at 66,588.12.
- The index pulled back from Wednesday’s record close of 68,402.13, though it still gained 0.3% for the week.
- Traders are watching 66,614 resistance and 65,929 support as the next short-term range.
The Market Move
Nikkei225 came under pressure on Friday as Japan’s benchmark index retreated for a second straight session after hitting a record high earlier in the week.
The Nikkei 225 fell 1.3% to close at 66,588.12, while the broader Topix slipped 0.07% to 3,949.09. The pullback followed weaker sentiment in US tech, after Broadcom’s revenue miss cooled enthusiasm across AI and semiconductor stocks.
The move was not a full risk-off sell-off. The Nikkei still ended the week up 0.3%, and the index remains up 34% so far this year. However, the short-term chart shows pressure building as traders take profit from crowded technology names.
Why Traders Are Watching This
Traders are watching Nikkei225 because Japan’s equity rally is starting to split.
AI and semiconductor-linked stocks dragged the index lower, with Sumco down 7.4%, Ibiden falling 6.9%, and Tokyo Electron losing 6.6%. These names had helped fuel the Nikkei’s record-breaking run, so their weakness weighed heavily on the benchmark.
At the same time, the broader market held up better. Real wages in Japan rose 1.9% in April, marking a fourth straight monthly gain. Stronger wage growth can support household spending, which may help domestic-facing companies and keep wider Japanese equities resilient.
That creates a mixed setup for index CFD traders. Nikkei225 is under pressure from tech profit-taking, but stronger wages and broader sector gains may limit downside if buyers rotate into other areas of the market.
Key Trading Levels
| Level | What Traders Are Watching |
| 67,924 | Recent swing high and stronger recovery level |
| 66,614 | 20-period moving average resistance |
| 66,593 | Current trade zone |
| 66,588 | Nikkei 225 close reference |
| 66,485 | 10-period moving average |
| 65,929 | Intraday low and first key support |
| 65,734 | Lower chart support |
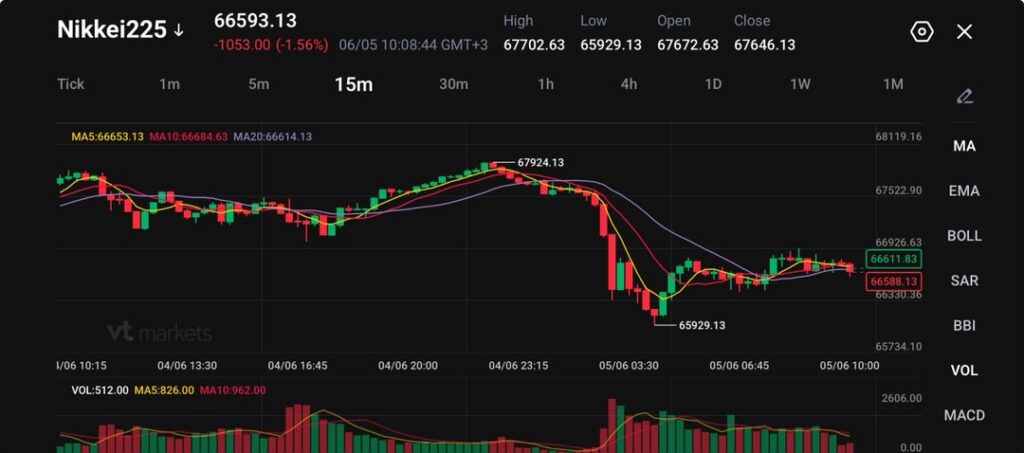
Nikkei225 is trading below its short-term moving averages, with the 5-period MA at 66,653, the 10-period MA at 66,485, and the 20-period MA at 66,614.
The index is currently sitting between the 10-period and 20-period moving averages, which shows a lack of clean direction after the sharp drop. Buyers have defended the low near 65,929, but price has not yet reclaimed the stronger resistance area near 66,614.
A clean move above 66,614 would suggest the index is stabilising. A break below 65,929 would keep sellers in control and expose 65,734.
Bullish and Bearish Setups
| Setup | Trigger | Potential Market Reaction |
| Bullish Recovery | Move above 66,614 | Buyers may target 67,522, then 67,924 |
| Pullback Setup | Hold above 65,929 | Traders may watch for renewed buying interest |
| Bearish Break | Move below 65,929 | Sellers may target 65,734 |
| Range Setup | Hold between 65,929 and 66,614 | Traders may wait for confirmation |
The bullish setup needs Nikkei225 to reclaim 66,614 and hold above the 20-period moving average. That would show buyers are returning after the tech-led sell-off.
The bearish setup builds if price falls below 65,929. A break under that level would suggest the pullback is extending beyond short-term profit-taking.
The range setup remains likely if Nikkei225 stays trapped between 65,929 and 66,614. In that case, traders may wait for a stronger signal before taking a clearer view.
Disclaimer
The price levels and trade scenarios above reflect the author’s view at the time of writing and do not represent financial advice or an official recommendation from VT Markets. Traders should conduct their own analysis and manage risk carefully.
Trade Nikkei225 CFDs With VT Markets
Nikkei225 remains active when traders rotate between AI, semiconductors, domestic demand stocks, and broader Asian equity sentiment.
With VT Markets, traders can access Nikkei225 CFDs alongside major indices, forex, gold, oil, shares, ETFs, and other global CFD markets from one platform. This helps traders follow Japan’s equity story while also tracking related moves in US tech, the yen, and wider risk sentiment.
Use VT Markets’ charting tools to monitor support, resistance, moving averages, and breakout behaviour as the next Nikkei225 setup develops.
Join our upcoming webinar and learn how to trade candlestick patterns with confidence, clarity, and real market confirmation.

Start trading indices with VT Markets today.
Why Trade Nikkei225 as a CFD?
Nikkei225 CFDs allow traders to take a view on rising or falling Japanese index moves without owning the underlying index constituents.
That flexibility can be useful when the market is reacting to fast sector rotation. If tech stocks recover, traders can watch bullish setups in Nikkei225. If semiconductor weakness deepens, traders can monitor downside moves as selling pressure builds.
With VT Markets, traders can follow Nikkei225 price action in real time and compare it with other global CFD markets from one account.
What to Watch Next
Traders should watch the 66,614 resistance level and the 65,929 support level.
A break above 66,614 could show that Nikkei225 is stabilising after the tech-led pullback. A stronger move above 67,522 would improve the recovery case.
A break below 65,929 would keep sellers in control and bring 65,734 into focus. Beyond the chart, traders should watch US semiconductor sentiment, Japanese wage data, yen movement, and whether domestic sectors continue to offset weakness in technology shares.
FAQs
Why Is Nikkei225 Falling?
Nikkei225 is falling as traders take profit from AI and semiconductor-related stocks after a strong rally. Weakness in US tech sentiment also weighed on Japanese chip-linked names.
What Is the Key Level to Watch for Nikkei225?
The key upside level is 66,614, which marks the 20-period moving average. A move above this area could support a short-term recovery. On the downside, 65,929 is the first key support level.
Can Nikkei225 Recover?
Nikkei225 could recover if buyers reclaim 66,614 and push price back toward 67,522. Stronger wage growth and broader sector gains may also help support the index if tech selling slows.
Why Are Japanese Tech Stocks Under Pressure?
Japanese tech stocks are under pressure after Broadcom’s revenue miss cooled sentiment across AI and semiconductor shares. Traders often take profit across related chip stocks when one major sector leader disappoints.
Can I Trade Nikkei225 With VT Markets?
Yes. VT Markets offers access to Nikkei225 CFDs, allowing traders to take a view on rising or falling Japanese index moves without owning the underlying stocks. Traders can also access forex, gold, oil, shares, ETFs, and other CFD markets from one platform.
Start trading now – Click here to create your real VT Markets account


