


Key Points
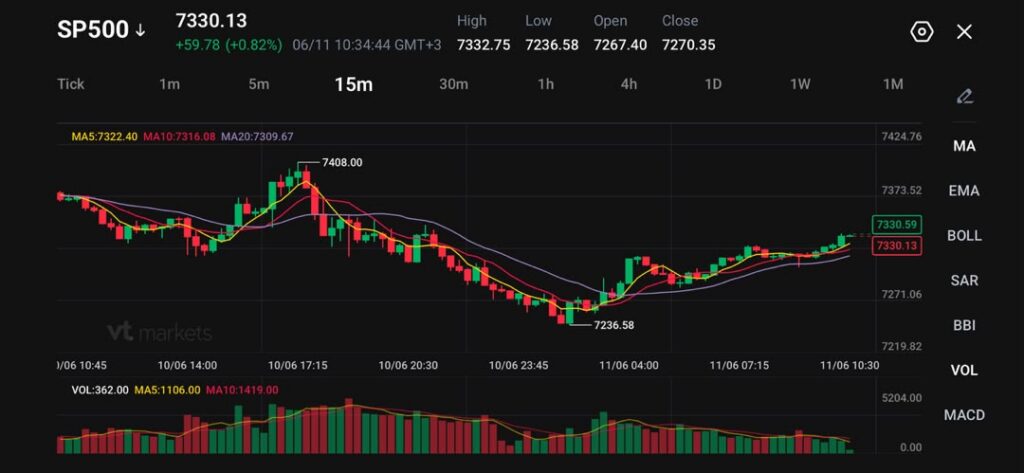
- SP500 traded near 7,330, up 0.82%, after recovering from an intraday low of 7,236.58.
- US futures pointed higher, with S&P 500 futures and Dow futures both up 0.6%.
- Traders are watching 7,332 resistance and 7,310 support as the next key range.
SP500 pushed higher on Wednesday as US futures gained and bond yields eased.
S&P 500 futures rose 0.6%, while Dow Jones Industrial Average futures also climbed 0.6%. European markets were broadly firmer, with the Stoxx Europe 600 up 0.3% and the FTSE 100 also adding 0.3%.
The move came as the US 10-year Treasury yield slipped by 2 basis points to 4.54%, while the German 10-year Bund yield edged lower to 3.074%. Softer yields helped support equity sentiment, especially after the SP500 recovered from the 7,236.58 low on the 15-minute chart.
Why Traders Are Watching This
Traders are watching SP500 because the index is trying to extend its rebound while global markets remain mixed.
The US dollar eased slightly, with the Wall Street Journal Dollar Index down 0.1% to 96.54. A softer dollar and lower yields can support risk assets by easing pressure on valuations and improving appetite for equities.
Still, the global picture is not fully risk-on. Asian markets were mixed, with Japan’s Nikkei 225 up 0.1%, while Hong Kong’s Hang Seng fell 0.8% and China’s Shanghai Composite slipped 0.2%.
Commodities also stayed firm, with Brent crude rising 0.2% to $93.30 and WTI crude gaining 0.4% to $90.40. Higher oil prices remain a key risk because they can feed inflation expectations and complicate the rate outlook.
Key Trading Levels
| Level | What Traders Are Watching |
| 7,408 | Previous upper swing and wider resistance |
| 7,373 | Stronger recovery level |
| 7,332 | Intraday high and immediate resistance |
| 7,330 | Current trade zone |
| 7,322 | 5-period moving average |
| 7,316 | 10-period moving average |
| 7,310 | 20-period moving average and key support |
| 7,236 | Intraday low |
| 7,219 | Lower chart support |
SP500 is trading above its short-term moving averages, with the 5-period MA at 7,322.40, the 10-period MA at 7,316.08, and the 20-period MA at 7,309.67.
That keeps the short-term structure tilted toward buyers. The index has recovered strongly from the 7,236.58 low and is now testing the upper end of the latest range.
A clean move above 7,332 would strengthen the bullish setup and bring 7,373 into focus. A drop below 7,310 would suggest momentum is cooling and could pull price back toward 7,271.
Bullish and Bearish Setups
| Setup | Trigger | Potential Market Reaction |
| Bullish Breakout | Move above 7,332 | Buyers may target 7,373, then 7,408 |
| Pullback Setup | Hold above 7,310 | Traders may watch for renewed buying interest |
| Bearish Break | Move below 7,310 | Sellers may target 7,271 |
| Deeper Pullback | Break below 7,236 | Downside may extend toward 7,219 |
The bullish setup depends on SP500 holding above the moving average cluster and breaking 7,332. That would show buyers are still willing to chase the recovery as yields ease.
The pullback setup may become cleaner if price dips toward 7,310 and stabilises. This would show whether buyers are defending the latest higher range.
The bearish setup builds if SP500 falls below 7,310. A break under that level would weaken short-term momentum and bring 7,271 back into focus.
Disclaimer
The price levels and trade scenarios above reflect the author’s view at the time of writing and do not represent financial advice or an official recommendation from VT Markets. Traders should conduct their own analysis and manage risk carefully.
Trade SP500 CFDs With VT Markets
SP500 remains active when US futures, Treasury yields, dollar movement, earnings sentiment, and global risk appetite move together.
With VT Markets, traders can access SP500 CFDs alongside DJ30, NAS100, forex, gold, oil, shares, ETFs, and other global CFD markets from one platform. This helps traders follow the wider equity picture while also tracking cross-market drivers such as yields, commodities, and the US dollar.
Use VT Markets’ charting tools to monitor support, resistance, moving averages, and breakout behaviour as the next SP500 setup develops.
Start trading indices with VT Markets today.
Why Trade SP500 as a CFD?
SP500 CFDs allow traders to take a view on rising or falling S&P 500 price moves without owning the underlying index constituents.
That flexibility can be useful when markets react quickly to futures, bond yields, inflation expectations, oil prices, and global equity sentiment. If SP500 breaks higher, traders can watch bullish continuation. If yields or inflation risks return, traders can monitor downside setups.
With VT Markets, traders can follow SP500 price action in real time and compare it with other major CFD markets from one account.
Join our upcoming webinar and learn how to trade candlestick patterns with confidence, clarity, and real market confirmation.

What To Watch Next
Traders should watch 7,332 resistance and 7,310 support.
A break above 7,332 could strengthen the recovery and bring 7,373 into focus. A move below 7,310 would weaken the setup and shift attention back toward 7,271.
Beyond the chart, traders should watch Treasury yields, oil prices, US dollar movement, and whether global equity sentiment can stay firm despite mixed Asian market performance.
FAQs
Why Is SP500 Rising Today?
SP500 is rising as US futures move higher and Treasury yields ease. Softer yields can support equity sentiment by reducing pressure on stock valuations.
What Is the Key Level to Watch for SP500?
The key upside level is 7,332. A move above this area could support a push toward 7,373. On the downside, 7,310 is the first major support level to watch.
Can SP500 Continue Higher?
SP500 could continue higher if buyers hold above 7,310 and push price above 7,332. A stronger breakout may bring 7,373 and 7,408 back into focus.
What Could Push SP500 Lower?
SP500 could move lower if Treasury yields rebound, oil prices raise inflation concerns, or global risk sentiment weakens. A break below 7,310 would weaken the short-term setup.
Can I Trade SP500 With VT Markets?
Yes. VT Markets offers access to SP500 CFDs, allowing traders to take a view on rising or falling S&P 500 price moves without owning the underlying index. Traders can also access forex, gold, oil, shares, ETFs, and other CFD markets from one platform.
Start trading now – Click here to create your real VT Markets account


