


Key Points
- Australia’s Q1 GDP rose 0.3%, missing the 0.5% forecast.
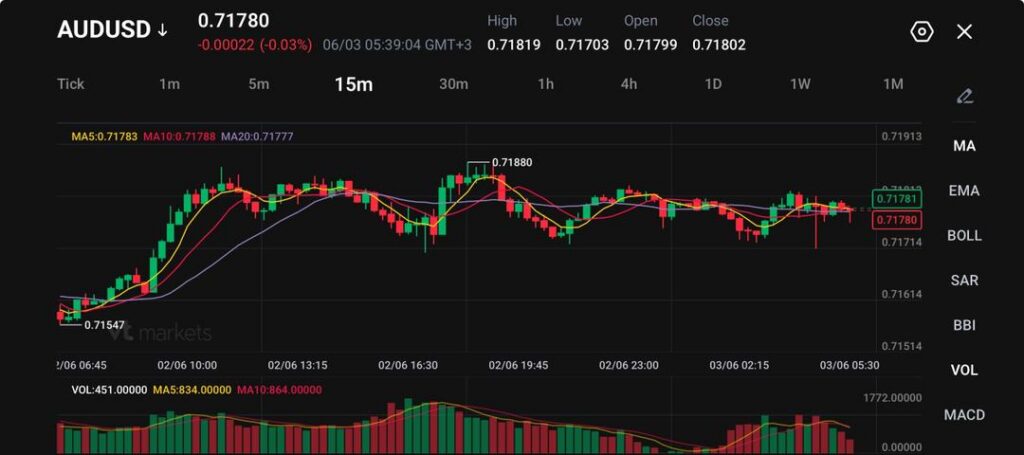
- AUD/USD stayed flat near 0.7178, showing that traders have not fully repriced the RBA outlook.
- The next trading signal may come from a break above 0.71819 or below 0.71703.
The Setup
AUD/USD is holding near 0.7178 after weaker Australian GDP data failed to trigger a major market reaction.
The Australian economy grew 0.3% in the March quarter, slowing from 0.9% in the previous quarter. Annual growth held at 2.5%, while the RBA still sees growth above roughly 2.0% as a risk for inflation.
That puts AUD/USD in a tradeable holding pattern. Growth is slowing, but domestic demand remains firm. The pair is now waiting for a clearer signal from RBA pricing, US dollar movement, or broader risk sentiment.
The Trade Zone
| Zone | Level | Action Signal |
| Breakout Zone | 0.71819 | Watch for bullish continuation |
| Pivot Zone | 0.718 | Price needs to reclaim and hold this area |
| Short-Term Support | 0.71703 | A break may trigger fresh selling |
| Deeper Support | 0.71614 | Next downside target if sellers take control |
| Lower Risk Zone | 0.71547 | Bearish extension area |
AUD/USD is trading close to its short-term moving averages. The 5-period MA sits at 0.71783, the 10-period MA at 0.71788, and the 20-period MA at 0.71777.
That tight cluster shows compression. In simple terms, the pair is coiling. Traders may want to watch for a clean break rather than chasing price inside the range.
How Traders Can Approach AUD/USD Now
A move above 0.71819 could give buyers the upper hand. This would show that the market has absorbed the GDP miss and is ready to test higher levels.
A move below 0.71703 would shift pressure back to sellers. This could suggest that weaker growth, lower rate-hike odds, or risk-off sentiment is starting to weigh on the Aussie dollar.
A sideways move between those levels keeps AUD/USD in wait-and-see mode. In that case, traders may focus on short-term range behaviour until a stronger catalyst appears.
Join our upcoming webinar and learn how to trade candlestick patterns with confidence, clarity, and real market confirmation.

Why This Market is Active
Australia’s GDP data delivered a split message.
Headline growth slowed, but domestic demand stayed strong. Domestic demand added 1 percentage point to GDP growth, while net trade subtracted 0.8 percentage points as imports of data centre equipment and fuel surged.
That matters because the RBA has already raised rates three times this year to tame inflation. Swap markets now price only a 7% chance of another hike next month, but they still imply around 23 basis points of tightening for the year.
This gives AUD/USD a clear catalyst mix: slower growth, sticky demand, cautious RBA pricing, and global risk pressure from the Middle East conflict.
Trade Forex CFDs With VT Markets
AUD/USD is one of the major forex pairs traders watch when Australian data, RBA policy, commodity sentiment, and US dollar flows collide.
With VT Markets, traders can access AUD/USD and other major forex CFDs from one platform, alongside gold, oil, indices, shares, ETFs, and more.
Track the next breakout, compare AUD/USD with other major pairs, and use advanced charting tools to follow support, resistance, and momentum shifts in real time.
Start trading AUD/USD CFDs with VT Markets today.
Why Trade AUD/USD as A CFD?
AUD/USD CFDs let traders act on both upward and downward price moves.
That flexibility can be useful when the pair is sitting near a clear technical range. Traders can watch for long setups if AUD/USD breaks higher, or monitor short setups if the pair loses support.
What to Watch Next
The next short-term signal sits at 0.71819 on the upside and 0.71703 on the downside.
A break above 0.71819 could point to a recovery attempt. A break below 0.71703 may bring 0.71614 into focus.
Traders should also watch RBA commentary, US dollar direction, and any shift in risk sentiment tied to the Middle East conflict.
Start trading now – Click here to create your real VT Markets account


