

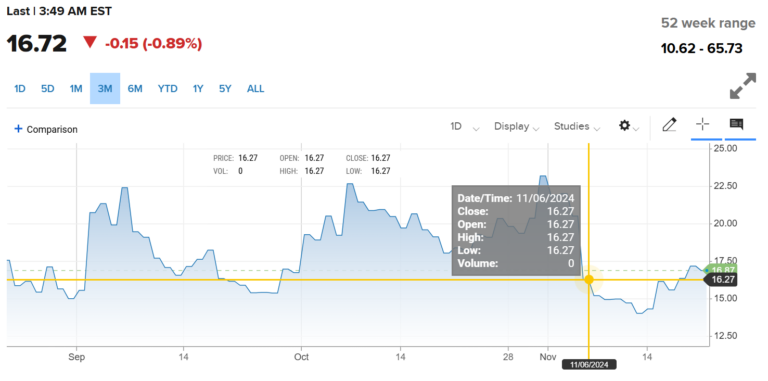
Immediately after Donald Trump became the 47th President of the United States on 6 November 2024, the main indices recorded impressive gains.
The Dow Jones Industrial Average surged over 1,500 points, reaching an all-time high. The last time the Dow jumped over 1,000 points in a single day was in November 2022.
The S&P 500 rose by 2.5%, while the Nasdaq climbed 3%, with both indices hitting record highs.
The Russell 2000 Index, which tracks 2,000 small-cap companies, recorded a 5.8% increase.
Major bank stocks also strengthened, with gains of 11.5%, 8.4%, and 13% for JPMorgan, Bank of America, and Wells Fargo, respectively.
The question is: why did the US stock market exhibit bullish behaviour following the election result announcement?
The answer is simple – market sentiment.
What Is Market Sentiment?
Imagine overhearing a conversation between two of your colleagues who are active forex traders.
Colleague A says, “I’m confident the market will be bullish today.”
Colleague B disagrees, replying, “Who says so? Today is going to be a sell-off!”

This opposing sentiment between the two reflects the reality of the financial market: a collective outcome of all market participants’ views, ideas, and opinions.
This mixed emotional state is referred to as market sentiment because financial markets are driven by emotion.
When sentiment analysis is given equal attention alongside technical and fundamental analysis, traders move closer to making more accurate decisions.
Sentiment Analysis As A Means To Measure Market Sentiment
Market sentiment can be gauged using sentiment analysis. This involves assessing the emotions and opinions of market participants towards a particular asset or market.
Sentiment analysis is essential for understanding market dynamics, as it helps traders evaluate the prevailing mood of the market, whether bullish (optimistic) or bearish (pessimistic).
It uses computational techniques to determine whether information from news sources and social media forms a positive, negative, or neutral sentiment.
In trading, this analysis offers insights into market emotions and behaviours. When combined with technical and fundamental indicators, sentiment analysis can assist traders in making more precise market entry decisions.
Types Of Indicators In Sentiment Analysis
1. CBOE Volatility Index (VIX)
Also known as the ‘fear index’, the VIX measures market volatility and investor sentiment regarding future price movements.
A high VIX indicates increased fear or uncertainty in a market with bearish sentiment.
2. Bullish Percent Index (BPI)
BPI shows the percentage of stocks in an index with bullish momentum. The higher the BPI, the stronger the bullish sentiment among investors.
3. High-Low Index
This indicator compares the number of stocks reaching 52-week highs with those hitting 52-week lows. A high ratio indicates bullish sentiment, while a low ratio signals bearish sentiment.
4. Put/Call Ratio
This indicator compares the volume of put options to call options. A high put/call ratio suggests bearish sentiment, while a low ratio indicates bullish sentiment.
5. Advance-Decline Line (ADL)
The ADL tracks the difference between the number of advancing and declining stocks. An upward trend in ADL implies bullish sentiment; a downward trend suggests bearish sentiment.
6. Social Media Sentiment Analysis
Traders can use algorithms to assess sentiment on social media platforms, like Twitter and Reddit. This analysis is useful for gauging public opinion on a particular asset.
7. News Sentiment Analysis
News headlines and articles can provide insight into traders’ views on the market. Optimistic, pessimistic, or neutral tones in the news can shift public perception.
8. Commitment of Traders (COT) Report
This report holds unique importance in the futures market, offering valuable insights into the positions held by traders.
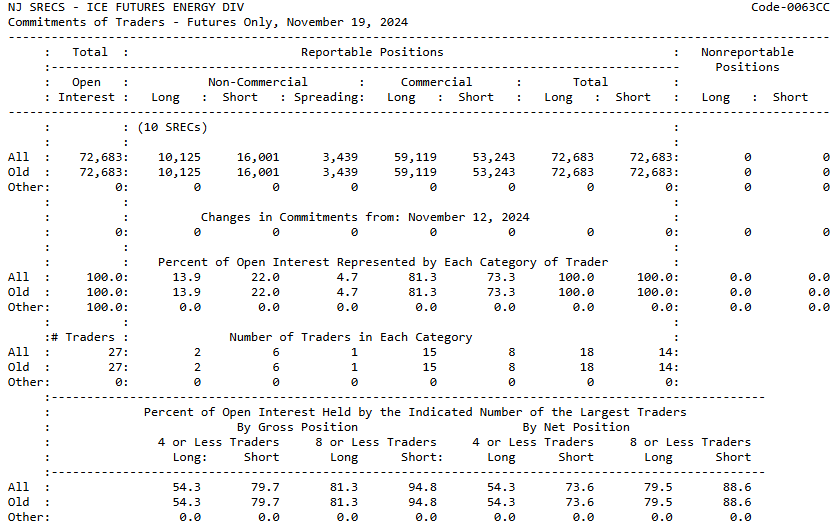
It can be used to inform buy or sell decisions. There are four types of COT reports: Legacy, Supplemental, Disaggregated, and Traders in Financial Futures.
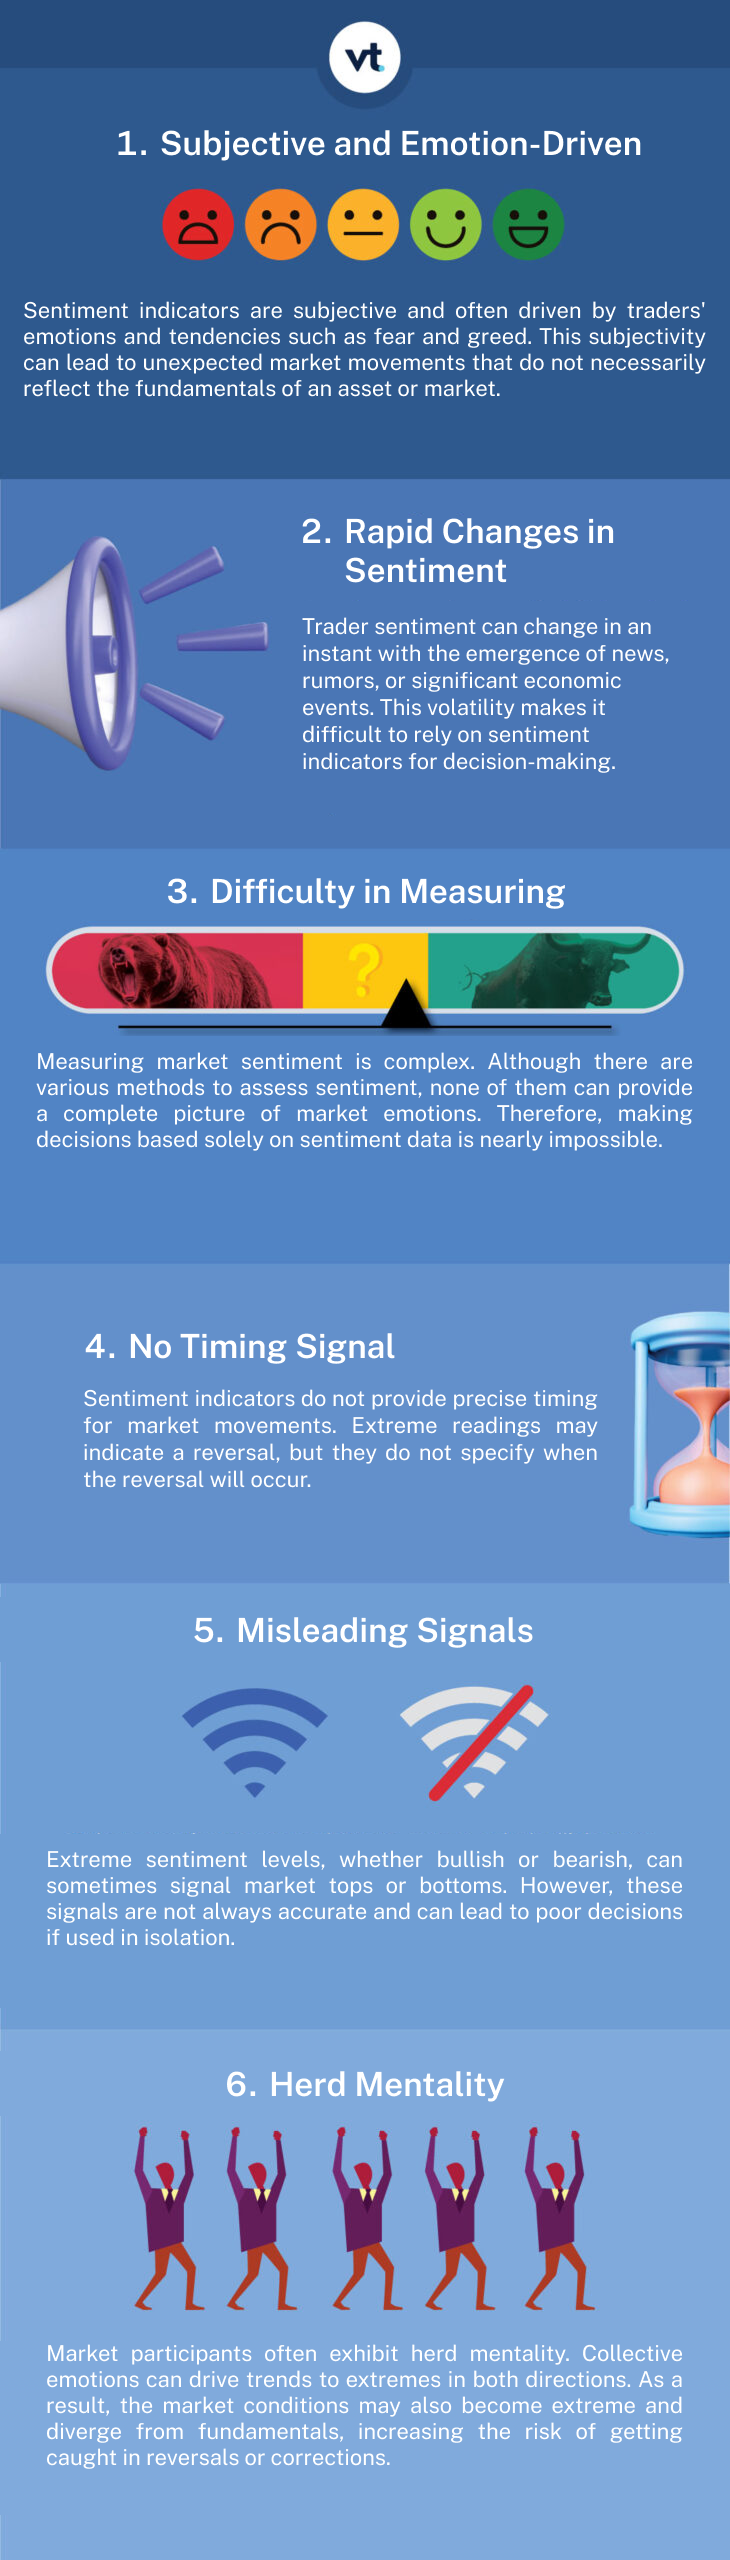
Risks Of Relying Solely On Sentiment Analysis
5 Ways To Apply Sentiment Indicators In Trading Strategies
1. Combine Sentiment Analysis With Technical And Fundamental Analysis
The best way to gain a complete market picture is by integrating sentiment indicators with technical and fundamental analysis. This combination helps validate signals and improve decision accuracy.
Divergence analysis can identify divergence between sentiment indicators and price movements. For example, if sentiment is bullish but prices are falling, this may indicate a possible reversal.
2. Monitor Extreme Market Sentiment
Use sentiment indicators to identify extreme bullish or bearish levels, which may signal market peaks or troughs. For example, a high put/call ratio might indicate strong bearish sentiment and present a buying opportunity.
3. Risk Management
Incorporate sentiment analysis as one component of risk management. For instance, if an indicator shows extreme bullish sentiment, consider reducing exposure to the market to minimise losses from a potential correction.
In volatile markets, use hedging strategies based on prevailing sentiment to protect against adverse price movements.
4. Stay Informed With Market News
News developments can influence market sentiment. Shifts in public perception can change market dynamics. Therefore, being attentive to news is key to making informed decisions.
Leverage social media sentiment analysis to assess public opinion in real time, as social media activity often reflects investor mood immediately.
5. Test And Improve Strategies
Always backtest strategies involving sentiment indicators to assess their performance in different market conditions.
Be ready to adapt strategies in response to changing market environments and evolving sentiment trends. Flexibility is key to maintaining a competitive edge in trading.
Final Words
You now understand that financial markets are driven not only by economic data and news, but also by trader emotions.
By paying attention to market sentiment, you can gain insight into market psychology, identify potential reversal points, and avoid poor decision-making.


