

If you’re new to trading, whether it’s CFDs or stocks, you’ll inevitably come across a series of vertical bars stretching across charts from left to right.
These are known as ‘Japanese candlesticks.’ Each candlestick provides unique information about the price movement of a financial instrument over a chosen timeframe.
By observing candlestick types and patterns, traders can identify potential entry and exit points. When these candlestick patterns are analysed with technical methods and the market context, traders can better understand market trends and improve their chances of making profitable trades.
Before diving into candlestick patterns, we need to understand the basic components of a candlestick and their functions.
Two Components Of Japanese Candlesticks
Japanese candlesticks are made up of two parts that convey crucial market information:
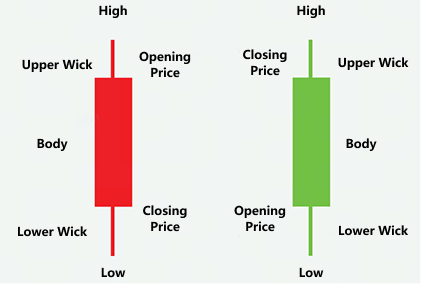
Body
The body represents the range between the opening and closing prices during a specific period.
A bullish candle is typically green or white, where the closing price is higher than the opening price.
Conversely, a red or black candle indicates a bearish session, where the closing price is lower than the opening.
Wick (or Shadow)
Want an easy way to gauge volatility? Just look at the length of the candlestick’s wick.
A long wick suggests strong price conflict between buyers and sellers, which implies high volatility. A short wick points to a calmer market.
The primary role of the wick is to show the price range that extends beyond the opening and closing levels.
Easy Way To Identify 11 Common Japanese Candlesticks
2. Bullish and Bearish Marubozu
5. Shooting Star and Hanging Man
6. Bullish Engulfing and Bearish Engulfing
7. Bullish Harami and Bearish Harami
8. Morning Star and Evening Star
9. Three White Soldiers and Three Black Crows
10. Three Inside Up and Three Inside Down
1. Doji
How to identify a Doji?
It’s one of the easiest candlesticks to spot since it has no real body. The opening and closing prices are nearly identical.
There are three types of Doji that can reflect different market conditions.
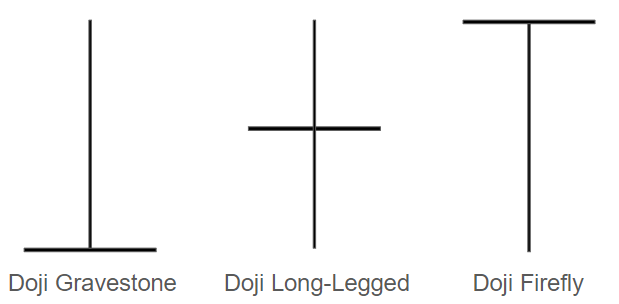
What can you interpret from a Doji?
Doji is considered neutral in a sideways market. However, it’s significant near a high after an uptrend or near a low after a downtrend.
In these situations, a Doji may signal a potential reversal. A Doji appearing after a long green or red candle may indicate an upcoming reversal.
2. Bullish and Bearish Marubozu
How to identify a Marubozu?
A Marubozu is a ‘bald’ candle, as in one without wicks. It can be green or red, depending on the market.
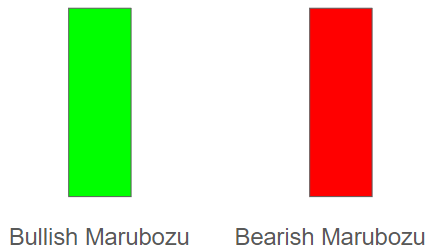
What can you interpret from a Marubozu?
A long red/black Marubozu is a strong bearish signal, showing sellers dominated the session from start to finish.
A long green/white Marubozu signals strong bullish momentum, with buyers firmly in control.
3. Spinning Top
How to identify a Spinning Top?
It resembles a Doji, except for a small body in the centre with longer upper and lower wicks.
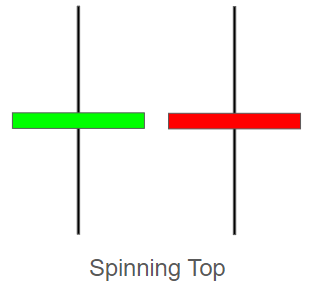
What can you interpret from a Spinning Top?
This candle signals indecision, with both buyers and sellers struggling for control.
It may continue a sideways trend or signal a reversal if it appears after an uptrend or downtrend.
The colour of a Spinning Top is less important than its position on the chart.
4. Hammer and Inverted Hammer
How to identify a Hammer?
Found at the bottom of a downtrend, a Hammer has a small body and a long lower wick (2–3 times the body length), with little to no upper wick.
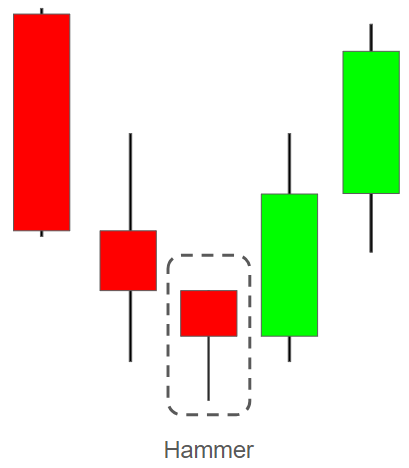
What can you interpret from a Hammer?
It may indicate the beginning of a bullish reversal after a sustained downtrend. However, wait for a confirming bullish candle before entering a long position.
Like the Spinning Top, the colour is less important than its position.
How to identify an Inverted Hammer?
Like the Hammer, it’s at the bottom of a downtrend. It has a long upper wick and a small body near the bottom. It’s essentially an upside-down Hammer.
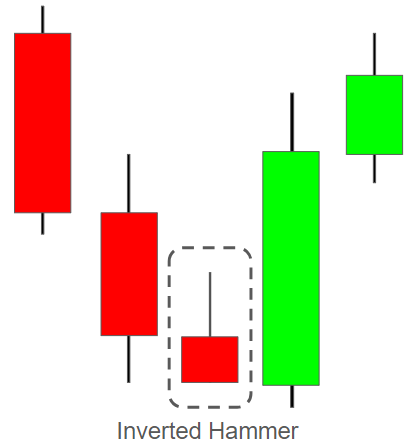
What can you interpret from an Inverted Hammer?
It signals a potential trend reversal, with buyers testing resistance from sellers. A bullish follow-through is needed for confirmation.
5. Shooting Star and Hanging Man
How to identify a Shooting Star?
It’s the opposite of an Inverted Hammer and appears at the top of an uptrend.
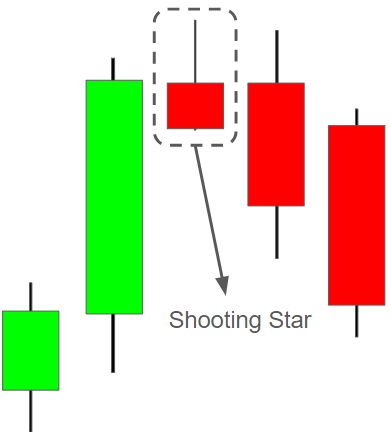
What can you interpret from a Shooting Star?
It indicates a potential bearish reversal. Wait for the next candle to confirm the trend change.
How to identify a Hanging Man?
It looks like a Hammer but appears at the top of an uptrend.
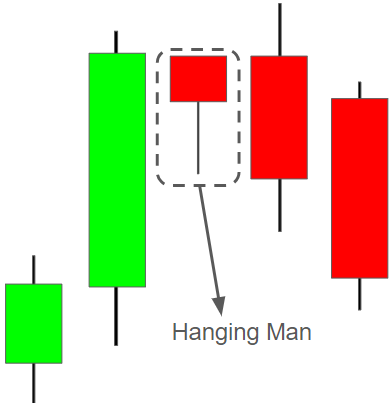
What can you interpret from a Hanging Man?
It may signal a bearish reversal if confirmed by the following candle.
6. Bullish Engulfing and Bearish Engulfing
How to identify Bullish Engulfing?
A long bullish candle that fully engulfs the body of the previous bearish candle.
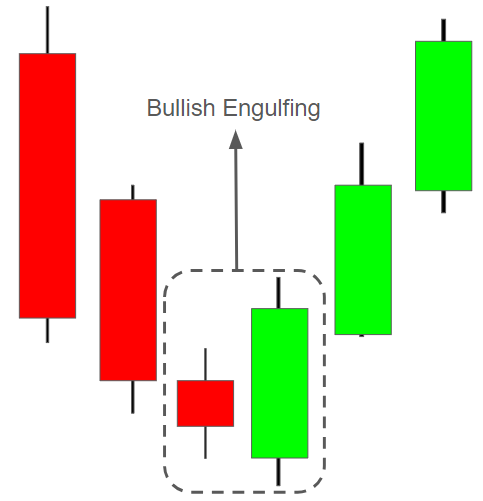
What can you interpret from Bullish Engulfing?
Appearing at the bottom of a downtrend, it signals a possible shift to an uptrend.
How to identify Bearish Engulfing?
A long bearish candle that completely engulfs the previous bullish candle’s body.
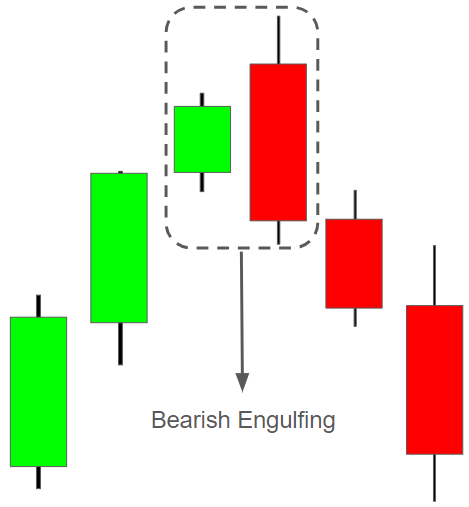
What can you interpret from Bearish Engulfing?
Found at the top of an uptrend, it may signal a bearish reversal.
7. Bullish Harami and Bearish Harami
How to identify Bullish Harami?
A small bullish candle is completely within the body of the previous large bearish candle.
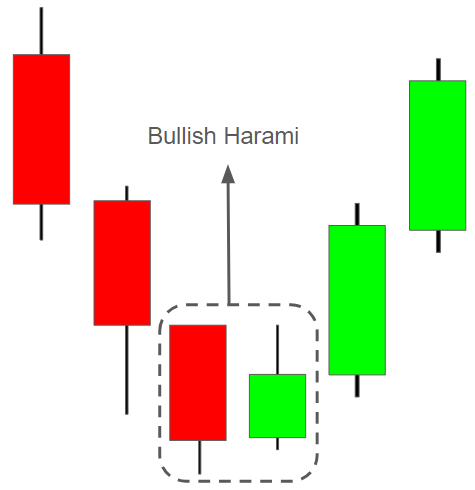
What can you interpret from Bullish Harami?
After a downtrend, a Bullish Harami suggests a potential upward reversal. Entry is ideal after confirmation by the third candle.
How to identify Bearish Harami?
A small bearish candle entirely within the body of the previous large bullish candle.
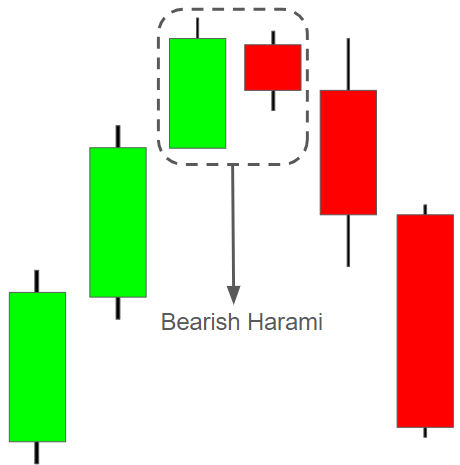
What can you interpret from Bearish Harami?
After an uptrend, it hints at a possible downward reversal. Look for confirmation before shorting.
8. Morning Star and Evening Star
How to identify a Morning Star?
A three-candle pattern at the bottom of a downtrend:
1. A long bearish candle
2. A short-bodied or spinning top candle
3. A strong bullish candle closing above the first candle’s open
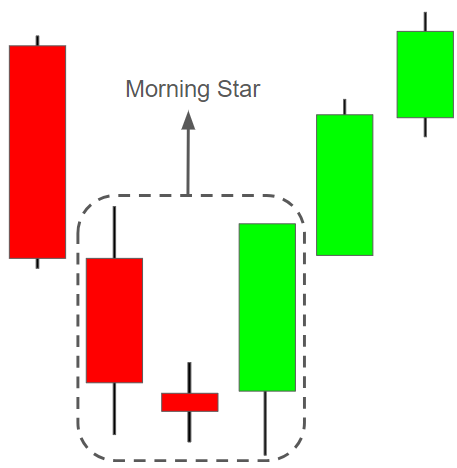
What can you interpret from a Morning Star?
It indicates a potential bullish reversal. Confirm direction using trends and technical indicators.
How to identify an Evening Star?
The opposite of a Morning Star, found at the peak of an uptrend:
1. A long bullish candle
2. A short-bodied or spinning top candle
3. A strong bearish candle closing below the first candle’s open
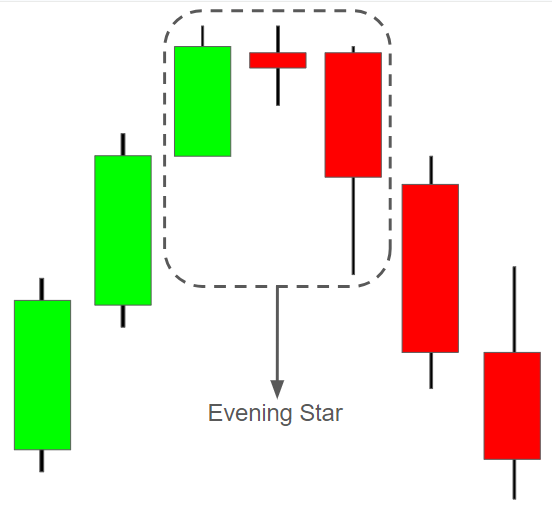
What can you interpret from an Evening Star?
It signals the end of bullish momentum and the start of a bearish trend.
9. Three White Soldiers and Three Black Crows
How to identify Three White Soldiers?
After a downtrend, three strong consecutive bullish candles with each closing higher than the last.
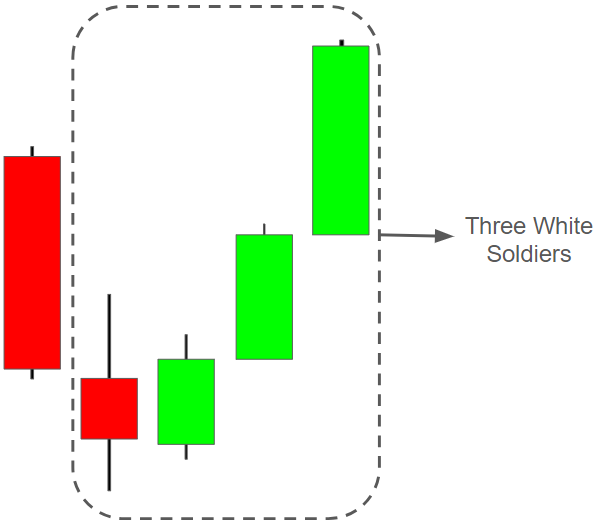
What can you interpret?
It confirms strong bullish momentum. Consider entering long while managing risk.
How to identify Three Black Crows?
After an uptrend, three strong consecutive bearish candles, each longer than the last.
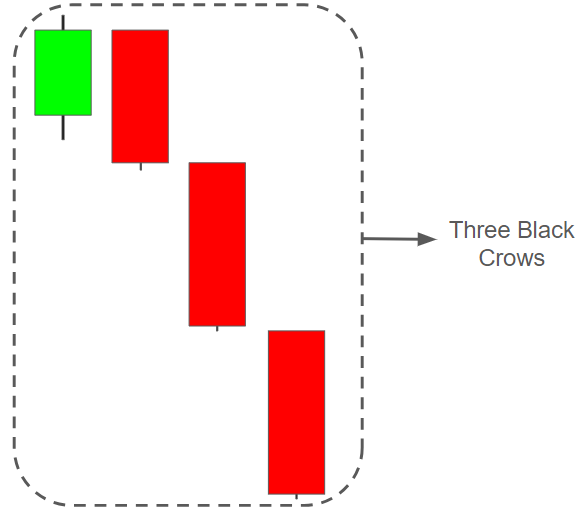
What can you interpret?
It confirms bearish momentum. Consider shorting with appropriate risk control.
10. Three Inside Up and Three Inside Down
How to identify Three Inside Up?
1. A long bearish candle
2. A bullish candle fully within the first candle’s body
3. A third bullish candle closing above the first candle
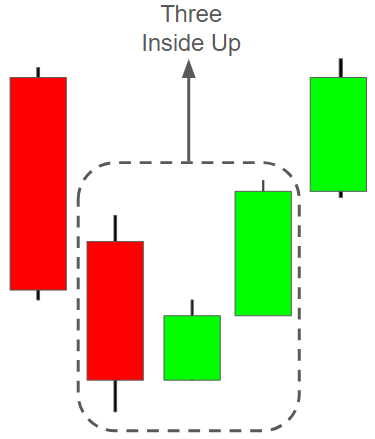
What can you interpret?
Found at the bottom of a downtrend, this pattern signals a bullish reversal.
How to identify Three Inside Down?
1. A long bullish candle
2. A bearish candle fully within the first candle’s body
3. A third bearish candle closing below the first candle
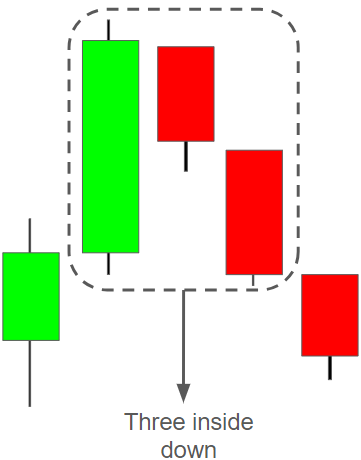
What can you interpret?
Appearing at the top of an uptrend, it signals a bearish reversal.
11. Rising Three
How to identify Rising Three?
A five-candle pattern:
1. A long bullish candle with three small bearish candles within the first candle’s range
2. A strong bullish candle closing above the first candle’s high
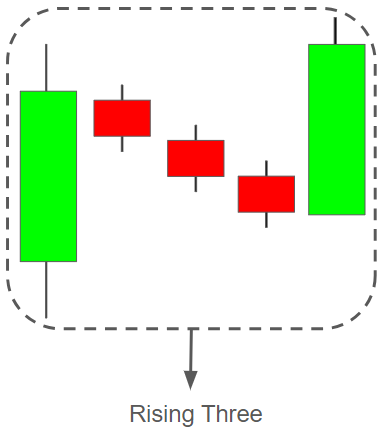
What can you interpret?
It reflects a brief pause in a strong uptrend. The fifth bullish candle confirms the continuation of the trend.
Final Thoughts
Japanese candlesticks offer a simple, practical way to read price action and market sentiment.
But it’s essential to remember:
While candlestick patterns are valuable tools, they should not be used in isolation. Always consider economic conditions, market context, and relevant indicators before making trading decisions.


