The USD/CHF pair hovers near 0.7950 as traders await upcoming US inflation figures.
USD/CHF is steady near 0.7950 as traders wait for the US CPI data for November. This data will likely influence the Federal Reserve’s upcoming policy decisions.
The US Dollar Index is unchanged at about 98.45, having bounced back after the US Nonfarm Payrolls data was released. The CPI is expected to show an annual rise of 3.1%, up from October’s 3%.
Australian dollar weakens for the sixth consecutive day as US dollar strengthens
The Australian Dollar (AUD) has been falling against the US Dollar (USD) for six days, now below 0.6600. It may find temporary support as markets expect a rate hike by the Reserve Bank of Australia (RBA) due to rising inflation, which hit 4.7% in December.
Major banks predict that the RBA will tighten monetary policy soon. There’s a 28% chance of a rate hike in February, rising to nearly 41% by March. The value of the AUD is also influenced by Iron Ore prices, inflation rates, and Australia’s economic ties with China. Meanwhile, the US Dollar is stable, with the Dollar Index around 98.40, ahead of the delayed US Consumer Price Index report.
Federal Reserve Interest Rates Approach
The Federal Reserve is taking a cautious approach to interest rates, with a 75.6% chance of keeping rates steady at the January meeting. Recent US economic indicators, like the unemployment rate rising to 4.6% and flat retail sales, suggest a cooling labor market. Influencing factors include mixed economic data from China and a stable unemployment rate of 4.3% in Australia reported in November. Technical analysis of AUD/USD shows it is trading below its nine-day EMA, indicating weak short-term momentum. If it continues to drop, it might reach 0.6500, while resistance around 0.6619 could trigger a rebound. The Aussie dollar is continuing to decrease against the US dollar, marking its sixth straight day of losses below the 0.6600 level. This trend suggests that bearish strategies may be preferred. The break below the ascending channel trend signals weakening momentum. A key factor to monitor is the different outlooks from the central banks, which could lead to major market fluctuations soon. While there’s a 41% chance of an RBA rate hike by March 2026, the CME FedWatch Tool indicates a strong 75.6% likelihood that the US Federal Reserve will keep rates unchanged in January. This difference in policy is creating tension for the currency pair.China’s Economic Influence
The Fed’s cautious stance is supported by disappointing US economic data that we need to watch closely. The US unemployment rate of 4.6% is the highest since the recovery phase in 2021, reflecting a cooling labor market. Along with flat retail sales last month, this weakens the case for a stronger US dollar in the medium term. A notable risk for those bullish on the AUD is recent poor economic data from China, which is Australia’s largest trading partner. Disappointing figures in retail sales and industrial production indicate a slowdown, affecting demand for Australian exports. This week’s reports show that iron ore prices, a key Australian export, have fallen below $110 per tonne from their recent highs, adding pressure on the AUD. Given these mixed signals, traders might lean towards strategies that benefit from increased volatility instead of clear directional bets. Options strategies like straddles or strangles could work well, with the AUD/USD stuck between strong support around the 0.6500 level and resistance near the three-month high of 0.6685. The implied volatility in AUD/USD options reflects this uncertainty, rising over 5% in the past month as the narratives from the central banks diverged. Create your live VT Markets account and start trading now.Gold prices in Saudi Arabia have declined, according to recent market information.
Gold prices in Saudi Arabia dropped on Thursday, according to FXStreet data. A gram of gold now costs 522.72 Saudi Riyals (SAR), down from 523.52 SAR the day before.
The price for a tola decreased to SAR 6,096.87 from SAR 6,106.19. Other prices include 10 grams for SAR 5,227.18 and a Troy Ounce for SAR 16,258.32.
Price Derivation and Updates
Prices are calculated by converting international gold rates into the local currency using current market rates. These are updated daily and may differ slightly from local rates. Gold is often seen as a safe investment, especially during economic uncertainty. Central banks hold a lot of gold, accumulating 1,136 tonnes in 2022, worth around $70 billion. Gold prices often move in the opposite direction of the US Dollar and stock markets. Any geopolitical or economic unrest can affect gold prices due to its status as a safe-haven asset. FXStreet encourages everyone to do their own research, as this information is not investment advice. Markets carry risks, and financial decisions should be made with care, keeping in mind the potential for significant losses.Short Term Positioning and Economic News
We are observing a slight drop in gold prices, with the current rate at SAR 522.72 per gram. This decline likely reflects short-term adjustments ahead of major economic news. Our main focus is the upcoming announcements from central banks, which will influence market sentiment into early 2026. Central bank purchases have remained strong, continuing the trend we saw in 2022 and 2023, when global reserves increased by over 1,000 tonnes annually. With the Bank of England likely to cut rates soon, and markets anticipating a potential Federal Reserve cut in the new year, the situation is becoming favorable for gold, a non-yielding asset. Lower interest rates reduce the opportunity cost of holding gold. We are particularly interested in the upcoming US CPI report, expected to show inflation rising to 3.1%. Historically, gold fares well during times of rising inflation, as seen in the substantial price increases in the late 1970s and from 2008 to 2011. A weaker dollar resulting from the inflation data could spur gold’s next movement. With several significant economic events on the horizon, we expect notable volatility. This suggests that strategies targeting large price swings, regardless of direction, might be wise. We are considering long volatility plays, like straddles, to take advantage of a potential breakout from the current trading range. Create your live VT Markets account and start trading now.EUR/USD trades around 1.1740 with a bullish bias in an ascending channel pattern.
EUR/USD might hit a two-month high of 1.1804. The 14-day Relative Strength Index (RSI) is at 67.47, indicating positive momentum. The main support level is the nine-day EMA at 1.1715.
Currently, the pair is trading around 1.1740 on Thursday after slight losses but remains steady. A bullish trend is evident as it moves within an ascending channel, supported by both nine- and 50-day EMAs.
Rising RSI and Possible Corrections
The RSI is close to the overbought line, indicating strong upward potential. If it goes above 70, we might see short-term downward corrections. If EUR/USD breaks above the two-month high, it could climb toward 1.1918. Immediate support is near the nine-day EMA, followed by levels at 1.1700 and 1.1690, which marks the lower limit of the ascending channel. If we break below these levels, the pair could drop and test the 50-day EMA at 1.1644 or even a three-week low at 1.1589. In the currency market, the Euro is showing strength against major currencies, especially the New Zealand Dollar. The percentage changes reflect its fluctuating strength in response to market shifts. EUR/USD’s stability in trading is influenced by upcoming ECB policy announcements and US CPI data. Decisions from the Bank of England and US inflation reports are also crucial for market direction.The Impact of US Inflation Data and ECB Policy
Given the current technical setup and recent events, there is a clear bullish outlook for EUR/USD. The US inflation data for November came in slightly lower than expected at 3.0%, which has weakened the US Dollar and positively affects our pair. This supports the ongoing momentum in the ascending channel. Traders in derivatives should consider testing the 1.1804 high in the near future. Buying call options with strike prices around 1.1800 or 1.1850 could be advantageous, especially since the RSI suggests strong momentum. However, we should remain alert for an RSI move above 70, which could indicate overbought conditions and lead to a short correction. The European Central Bank (ECB) decided to keep rates steady, which was expected. However, their comments were more hawkish than anticipated, suggesting slower rate cuts in 2026. This strengthens the Euro against the Dollar. Notably, speculative net short positions on the Euro have dropped by over 15% in the past month, indicating a shift in sentiment. Looking forward, a sustained break above the 1.1820 resistance zone could bring the June 2021 high of 1.1918 back into view. We haven’t reached that level in over four years, and achieving it would mark a major shift in the long-term trend. The economic landscape of mid-2021 was significantly different, driven by post-pandemic recovery rather than the current low-inflation environment. To manage risk, we are monitoring the nine-day EMA at 1.1715 as the first key support level. A clear drop below this level, along with the psychological 1.1700 mark, would challenge the bullish outlook. Traders may want to consider protective put options with a strike price below 1.1690 to guard against sudden shifts in sentiment. Create your live VT Markets account and start trading now.Gold prices in the Philippines have decreased, according to recent data analysis.
Gold prices in the Philippines fell on Thursday, according to FXStreet. The price per gram dropped to 8,158.97 Philippine Pesos, down from 8,177.97 PHP the day before.
The price for gold per tola also decreased to 95,164.66 PHP from 95,386.24 PHP. Gold for ten grams is priced at 81,589.73 PHP, while a troy ounce costs 253,781.40 PHP.
Gold Pricing Methodology
FXStreet figures out gold prices in the Philippines by adjusting international prices to fit local currency and measurements. The prices shown are for reference and may vary slightly from local rates. Gold has always been seen as a stable asset and a store of value. It is considered a safe investment during economic challenges and serves as a hedge against inflation and currency loss. Central banks hold the most gold to strengthen their economies and currencies. In 2022, they purchased 1,136 tonnes of gold, worth around $70 billion. Gold prices generally move in the opposite direction of the US Dollar and other key assets like US Treasuries. Factors such as geopolitical tensions, recession fears, and interest rates can affect gold prices, with a strong Dollar typically keeping prices lower.Gold Market Outlook
The recent drop in gold price to 8,158.97 PHP per gram should be viewed as minor fluctuations, not a new trend. Gold is a safe-haven asset, and this slight decline could present a good buying opportunity. Its role as protection against inflation remains crucial, especially in light of this year’s economic data. We are closely monitoring the US Federal Reserve, as many expect two possible rate cuts in the first half of 2026 due to slow economic growth. This anticipation has caused the U.S. Dollar Index (DXY) to fall to around 99.5, significantly lower than its 2024 highs. This drop benefits dollar-denominated assets like gold. Since gold does not yield interest, lower rates make it more attractive to investors. Additionally, support from central banks is strong, as they continue their historic buying trend. After record purchases in 2022 and 2023, data from early 2025 shows central banks have added over 800 tonnes to their reserves. This steady demand from official sources creates a solid market floor, reducing downside risk. For those trading derivatives, this environment suggests that buying call options on gold futures or related ETFs is a wise strategy in the coming weeks. These options let us benefit from the expected rise in gold prices while limiting our risk to the premium paid. The case for a higher gold price looks strong enough to justify taking bullish positions now. We should also keep in mind the inverse relationship with risk assets. Recent ups and downs in the equity markets, especially after the S&P 500 couldn’t maintain its highs from last quarter, have led to increased demand for gold as a safe-haven. Strategies like a bull call spread can help control costs and manage risk, particularly if the stock market experiences a sudden rally that draws money away from gold. Create your live VT Markets account and start trading now.Gold prices in the United Arab Emirates have declined, according to recent data.
Gold prices in the UAE dropped on Thursday, according to FXStreet. A gram of gold is now priced at 511.42 AED, down from 512.61 AED the day before.
The cost for one tola fell from 5,978.94 AED to 5,965.15 AED. For ten grams, the price is 5,114.24 AED, and a troy ounce is now 15,906.97 AED.
How Gold Prices are Set
Gold prices in the UAE are based on international market rates, adjusted by the USD/AED exchange rate. Prices are updated daily for reference, but local rates may differ. Gold is a popular way to preserve wealth and is considered a safe investment during times of uncertainty. Many investors use it to protect against inflation and currency loss. Central banks are the biggest buyers of gold, having purchased 1,136 tonnes worth about $70 billion in 2022. Gold usually has an opposite relationship with the US Dollar; when the Dollar weakens, gold prices often rise. Geopolitical issues and economic instability can also drive up gold prices. Since gold doesn’t earn interest, it performs better when interest rates are low, while a strong Dollar can keep prices down.Current Market Trends
Today, gold prices are slightly lower, likely due to a stronger US Dollar. The Dollar Index (DXY) recently approached a three-week high of 106.50 as the market responds to new inflation data. This inverse relationship is crucial to monitor. The latest US Consumer Price Index report for November 2025 showed a slightly higher inflation rate of 3.3%, leading to uncertainty about what the Federal Reserve will do next. After the Fed eased policies last week on December 10th, this uptick in inflation has traders questioning whether further rate cuts in early 2026 are guaranteed. This uncertainty is strengthening the Dollar and limiting gold prices. Despite this short-term pressure, there is strong support for gold that should prevent significant declines. The World Gold Council reported that central banks, especially from BRICS+ countries, continued to buy aggressively in the third quarter of 2025, acquiring over 300 tonnes. This is in line with the record buying seen in 2022 and creates a solid foundation for prices. For traders dealing in derivatives, the tension between a cautious Fed and strong physical demand suggests increased volatility. Implied volatility on gold options has risen, signaling that the market expects bigger price shifts in the coming weeks. In this environment, strategies like straddles or strangles, which profit from large price movements in either direction, may be considered. This situation feels reminiscent of the market fluctuations we saw in late 2023 when traders were continuously adjusting their expectations for Fed policy ahead of a significant shift. At that time, gold experienced sharp but often brief price changes based on new economic data. We can expect similar behavior as we finish the year and approach January 2026. Given this context, using options to manage risk in the coming weeks seems wise. While the strong Dollar might lead to further price consolidation or a drop towards key support levels, ongoing geopolitical tensions and central bank buying indicate that any weakness will likely be treated as a buying opportunity. Look for chances to take long positions while protecting against possible short-term declines. Create your live VT Markets account and start trading now.Tesla reaches a new all-time high, showing strong bullish momentum and possible demand for pullbacks.
Tesla’s stock has hit a new all-time high, reflecting a positive trend in the market. A short-term Elliott Wave analysis shows a completed cycle that began from the low on November 14, 2025, with a clear upward pattern.
– **Wave 1** ended at $423.69.
– Then, wave 2 dropped to $383.76.
– The upward movement continued with **wave 3**, reaching $458.87.
– There was a slight pullback in **wave 4**, which hit $435.
– Finally, **wave 5** peaked at $496.16 before the stock entered a corrective phase in **wave (2)**, forming a zigzag pattern.
Currently, wave A of the zigzag is likely to finish soon, followed by a rebound in wave B, then a decline in wave C. This will complete the corrective wave (2). If the high at $496.16 holds, any rallies might not last. The broader outlook suggests Tesla’s stock will likely move lower, correcting from the rise that started on November 14.
The date is **2025-12-18T07:27:49.492Z**. With Tesla recently hitting $496.16, we see that the strong upward cycle has ended. The analysis indicates we are now in a corrective phase, suggesting any further rallies will probably fail if the price stays below this peak. This creates a good opportunity for traders looking for a short-term pullback.
As a decline is expected, traders should think about taking bearish positions in the coming weeks. The recent rally has caused implied volatility for near-term options to rise above 65%. Strategies like selling call credit spreads with a short strike around or above $500 are particularly appealing. This lets traders profit from the expected price drop and the high volatility premiums.
The analysis predicts a brief bounce, or wave B, before the next major move downward. Traders can use this expected rebound to start new bearish positions at better prices. For example, buying puts during this temporary strength could provide a better risk-reward scenario for the upcoming, larger decline of wave C.
This technical outlook aligns with the fundamentals. Tesla’s forward P/E ratio has surpassed 80, a level that historically indicates a period of consolidation, as seen in late 2023. While optimism over strong Q4 delivery forecasts boosted the stock recently, the put-call skew is steepening, signaling increased demand for downside protection. After the current corrective phase, we expect strong buying interest to emerge, leading to the next major advance.
Today’s gold prices in Pakistan declined, according to information from multiple sources.
Gold prices in Pakistan dropped on Thursday, according to FXStreet. The cost per gram fell to 38,906.76 Pakistani Rupees (PKR) from 39,010.59 PKR the day before.
The price per tola decreased as well, going from 455,011.90 PKR to 453,800.80 PKR. These prices change daily based on international rates and the USD/PKR exchange rate.
Gold As A Stable Investment
FXStreet offers these rates as a guideline, knowing that local prices might vary slightly. Gold is seen as a reliable investment, especially during tough economic times. It helps protect against inflation and currency loss. Central banks are significant holders of gold. In 2022, they added 1,136 tonnes valued at about $70 billion to their reserves. Countries like China, India, and Turkey are increasing their gold holdings too. Gold’s price tends to go up when the US Dollar weakens and drop when interest rates rise. Events around the world or economic challenges can also push prices higher. The strength of the US Dollar plays a big role in how gold performs, influencing its status as a safe-haven asset.Federal Reserve And Market Dynamics
The recent small drop in gold prices seems like a temporary setback rather than a trend change. This dip is mostly related to a short-term rise in the US Dollar. Traders might see this decrease as a buying chance, considering the overall economic picture. We’re closely watching the US Federal Reserve, as officials are indicating a pause in their rate-increase plan in early 2026. Recent inflation data showed the US Consumer Price Index at a lower-than-expected 2.8% in November 2025, increasing the likelihood of a policy shift. This situation is typically positive for gold, making long-term call options an appealing strategy. Demand from central banks remains strong, helping to stabilize prices. The World Gold Council’s report for the third quarter of 2025 revealed that central banks purchased another 250 tonnes, continuing the substantial buying trend seen in 2022 and 2023. This ongoing demand makes shorting gold or selling uncovered calls risky. Geopolitical tensions are also a significant factor that boosts gold’s safe-haven status. Ongoing trade issues and supply chain problems are motivating investors to protect their portfolios. If these issues worsen, prices could rise sharply, prompting traders to consider strategies like straddles for potential volatility. Gold may also gain from signs of weakness in the stock market. The S&P 500 has been stagnant for weeks, struggling to maintain gains above the 5,500 mark as worries about 2026 corporate earnings increase. This could lead to a shift of funds from stocks into hard assets like gold in the first quarter. Create your live VT Markets account and start trading now.Dividend Adjustment Notice – Dec 18 ,2025
Dear Client,
Please note that the dividends of the following products will be adjusted accordingly. Index dividends will be executed separately through a balance statement directly to your trading account, and the comment will be in the following format “Div & Product Name & Net Volume”.
Please refer to the table below for more details:
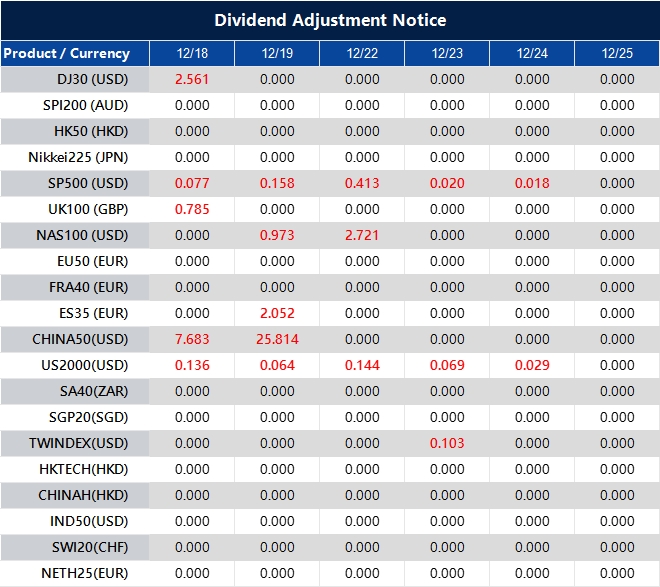
The above data is for reference only, please refer to the MT4/MT5 software for specific data.
If you’d like more information, please don’t hesitate to contact [email protected].
Gold prices in India drop today, according to various sources
Gold prices in India dropped on Thursday, according to FXStreet data. The price per gram fell to 12,586.07 Indian Rupees (INR) from 12,616.25 INR the day before.
The price per tola also went down, now at INR 146,801.50 compared to INR 147,153.50 on Wednesday. For a troy ounce, the price was INR 391,470.10.


