Hammack discusses inflation pressures, tariff impacts, and the need for focused policy direction.
The Federal Reserve’s dual goals of controlling inflation and supporting employment are facing challenges. The current suggestion is to keep a slightly restrictive policy to help lower inflation.
Tariffs are starting to have an impact on the economy, with their full effect expected to unfold next year. There is uncertainty about whether these tariffs will lead to a short-term shock or continue to affect the economy negatively.
Inflation is a major concern, as it continues to rise, which is not a good sign. The Federal Reserve must stay focused on addressing this ongoing inflation issue.
The labor market is experiencing a significant reduction in the number of available workers.
At each Federal Open Market Committee (FOMC) meeting, members consider new data with an open mind. Right now, there seems to be no reason to lower interest rates, as we are still a bit away from the neutral rate.
Currently, there’s no indication of a major economic slowdown. Thus, there’s no justification for implementing any stimulus policies.
Given the Fed’s focus on high inflation, we should adjust our expectations for interest rates in the upcoming weeks. The recent July 2025 Consumer Price Index (CPI) report showed that core inflation rose to 3.8%, suggesting that inflation is heading in the wrong direction. As a result, positions betting on a rate cut in September or November are becoming riskier.
The message is clear: policy will remain restrictive. Selling interest rate futures, like the December 2025 SOFR contract, could be a smart move. This strategy may profit if the market begins to doubt the likelihood of rate cuts by the end of the year. We saw a similar situation at the end of 2023 when the market quickly reversed its bets on early Fed easing.
With tariffs just beginning to impact the economy, uncertainty is a key theme for stock markets. This could lead to increased market volatility. Options to protect against a downturn, such as buying puts on the S&P 500 or VIX call options to bet on a rise in volatility, should be considered.
The shrinking labor market is also a significant factor since fewer workers can increase inflation. The July 2025 jobs report showed an unexpected drop in the labor force participation rate to 62.2%, adding to this concern. This tight labor market strengthens the Fed’s need to keep rates high for an extended period, which typically pressures growth-focused stocks.
A hawkish Federal Reserve, combined with tariff uncertainty, is likely to support the U.S. dollar. The U.S. Dollar Index (DXY) has already gained over 2% since June 2025. Traders might consider long positions in dollar futures or options since other central banks appear ready to ease their policies.
The statement indicating “no signs of a notable economic downturn” weakens the case for recession-focused trades at this time. However, high rates paired with new tariffs create a fragile economic environment. We should remain flexible, using short-dated options to express our views without taking long-term risks until the effects of the tariffs become clearer.
Dividend Adjustment Notice – Aug 22 ,2025
Dear Client,
Please note that the dividends of the following products will be adjusted accordingly. Index dividends will be executed separately through a balance statement directly to your trading account, and the comment will be in the following format “Div & Product Name & Net Volume”.
Please refer to the table below for more details:
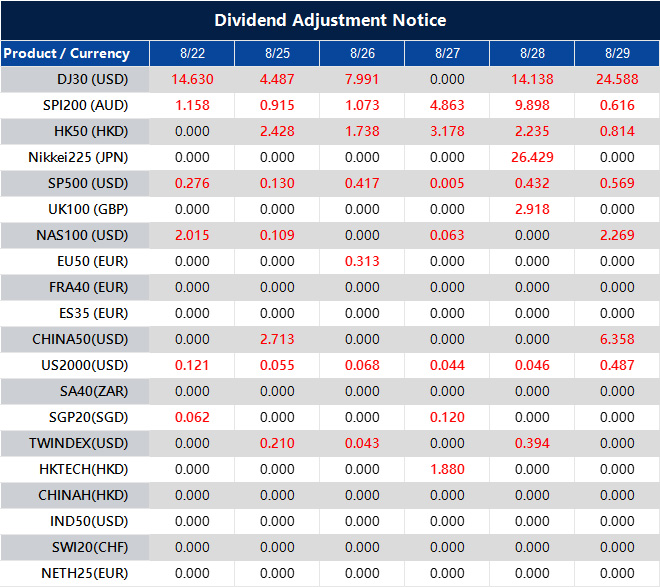
The above data is for reference only, please refer to the MT4/MT5 software for specific data.
If you’d like more information, please don’t hesitate to contact [email protected].
Schmid emphasizes that inflation risks outweigh job growth, urging caution before changing interest rate policies.
Recent inflation trends are higher compared to the current job market, as highlighted by the Fed’s Schmid before two significant events: the Fed’s meeting on September 16–17 and the Kansas City Fed’s annual conference at Jackson Hole. Schmid adopted a hawkish outlook, suggesting that a rate cut is unlikely soon.
Schmid noted that inflation is still above the target, closer to 3% instead of the desired 2%. He warned that reducing rates now could worsen inflation expectations. He emphasized the challenge of bringing inflation down from 3% to 2% and cautioned that early rate cuts could delay progress.
Need For Definitive Data
He stressed the importance of having clear data before changing any policies and acknowledged that, despite some weaker job figures, there is still optimism among business leaders. Schmid believes the current policy is not hindering economic growth. Everyone is watching Powell’s upcoming speech on Friday for any hints about future policies. At the July meeting, the Fed kept rates at 4.25%–4.5%, with two governors disagreeing and wanting cuts. President Trump is still advocating for lower rates. Earlier, Fed’s Bostic suggested that changes in immigration could adjust job growth expectations to around 50,000, indicating that the recent three-month average of 35,000 is actually better than it seems. It’s clear that the Federal Reserve is not rushing to cut interest rates. Recent data, such as the July 2025 core CPI staying steady at 2.9%, supports the idea that tackling the last part of inflation is the hardest challenge. This indicates that policies will likely stay tight through the upcoming September 16-17 meeting. While job growth has recently slowed, with the July 2025 report showing an increase of 45,000 jobs, this isn’t a sign of serious weakness. Some within the Fed think that, due to changing immigration patterns, the economy now only needs about 50,000 jobs monthly to stay on track, which makes current job levels less concerning. The steady 4.1% annual wage growth also makes officials cautious.Trading Implications For The Market
For traders dealing in interest rate derivatives, this suggests that last week’s decline in Treasury futures could have further to go. The market has quickly adjusted expectations, with fed funds futures now indicating less than a 15% chance of a rate cut before November’s meeting. Short-term interest rate futures tied to SOFR are likely to remain stable due to this hawkish outlook. This sustained “higher for longer” interest rate scenario may limit the potential rise of equity index futures for now. We could enter a range-bound market, presenting opportunities to sell premium using options strategies like iron condors on the S&P 500. Traders should also monitor the VIX, as any unexpected hawkish remarks from Powell at Jackson Hole could lead to a jump in volatility. Reflecting on the 1970s, we see that cutting rates too early can reignite inflation and force even steeper hikes later. This historical lesson likely weighs on officials’ minds as they aim to avoid repeating past mistakes. All eyes will be on the Fed chair’s speech this Friday for any changes in tone, as this could significantly impact the market. Create your live VT Markets account and start trading now.Strong PMI and home sales boost USD, significantly lowering September rate cut chances
Focus on Key Price Levels
The USD is gaining strength after S&P Global and existing home sales data came in better than expected. This has lowered the chance of a September rate cut to 75%, down from a full 100% last week. Fed Chair Powell is scheduled to speak tomorrow, and the September data will be crucial before the mid-month rate decision. Despite calls for rate cuts, weak job numbers make a full cut seem unlikely. EURUSD reached a new low, entering the swing area of 1.16098 to 1.16309. The 50% retracement level at 1.16098 is a significant target on the downside. Resistance appeared at 1.1661, halting further gains. If the price drops below 1.16098, it would indicate stronger selling pressure, suggesting a deeper retracement ahead. For GBPUSD, attention is on the 100-day moving average near 1.34078. Earlier, it reached 1.3436 before bouncing back above the 50% midpoint at 1.3463, peaking at 1.3481 before falling again. Current momentum is shaped by these key price levels. USDJPY saw a strong recovery today, moving back above 147.50. This momentum pushed into the resistance area of 147.95 to 148.166. If it breaks above 148.166, it would indicate a bullish trend, opening up potential for further gains in the upcoming sessions.Signals and Strategies
The strong US dollar is backed by solid economic data, which should influence our trading strategies. The S&P Global Composite PMI for August hit 51.5, exceeding expectations, while July’s existing home sales were at an annualized rate of 4.25 million, also better than predicted. The CME FedWatch Tool now indicates a 75% chance of a September Fed rate cut—down from certainty last week. We shouldn’t expect Fed Chair Powell to announce a definitive rate cut in his speech tomorrow. Although he will refer to the weaker July jobs report, which showed only 155,000 new jobs, he is likely to emphasize that future decisions will depend on incoming data before the mid-September meeting. This cautious approach mirrors the Fed’s slow easing cycle in 2019 amidst mixed economic signals. For EURUSD, the trend appears to be downward, especially after recent data showed a 0.5% drop in German industrial production, putting pressure on the Euro. Traders should see the 1.16098 level as a crucial point. If the price sustains a break below this level, it may trigger buying put options to benefit from a potential drop toward the August 1 lows. The outlook for GBPUSD is also negative as it approaches its 100-day moving average at around 1.3407. Recent UK data has been discouraging, with persistently high inflation and declining retail sales creating tough economic conditions. If it fails to maintain this key moving average, it would indicate increasing control by sellers, suggesting bearish positions are advisable. On the other hand, USDJPY continues to show strength due to the widening interest rate gap between the US and Japan, where the Bank of Japan remains committed to its easy monetary policy. The key question is whether the pair can break and hold above the 148.166 resistance area, which has been tested four times in the last seven sessions. A decisive move above this level would signal a good opportunity to consider buying call options, anticipating a rise toward higher targets. Create your live VT Markets account and start trading now.US home sales reached 4.01 million in July, surpassing expectations, as prices continued to grow.
In July, US home sales rose to 4.01 million, beating the expected 3.92 million. This is a 2% increase from last month’s 3.93 million, despite a previous decline of 2.7%. Home inventories dropped to 4.6 months from 4.7 months last month, yet this is still a 15.7% rise compared to last year. The median home price climbed to $422,400, marking the 25th straight month of price growth.
Sales of single-family homes also grew by 2% to 3.64 million, with a median price of $428,500. Condominium and co-op sales increased by 2.8% month-over-month, but were down 2.6% year-over-year, with a median price of $362,600. Regionally, the Northeast saw an 8.7% rise in sales, while the Midwest experienced a 1.1% drop from the previous month. The South had a 2.2% increase, and the West saw a 1.4% gain.
Market Dynamics
Homes stayed on the market for a median of 28 days. First-time homebuyers represented 28% of sales, and 31% of transactions were made in cash. Individual investors and buyers of second homes made up 20% of transactions, while distressed sales accounted for 2%. The stronger-than-expected home sales numbers indicate the economy is doing well despite higher interest rates. This durability may delay any potential rate cuts by the Federal Reserve. Futures markets originally pegged a 25% chance of a rate reduction by year-end, but now have lowered that to below 15%. Given these conditions, we should prepare for a “higher for longer” interest rate environment. This may involve buying puts on treasury bond ETFs or selling short-term interest rate futures to guard against rising yields. This mirrors the trends seen in 2023 when robust economic data often resulted in bond market sell-offs.Investment Strategies
The decrease in first-time homebuyers to 28% highlights an affordability issue, which may pose challenges for homebuilder stocks. While demand remains stable, builders might need to keep offering financing incentives, potentially squeezing profit margins that have already been under pressure. This calls for a cautious approach, such as using covered calls on homebuilder stocks to earn income while limiting potential upsides. The increase in cash transactions to 31% and investor purchases to 20% indicates that the market is being fueled by buyers less affected by interest rates. With the average 30-year mortgage rate around 6.8% per the latest Freddie Mac data, many average wage-earning buyers are being sidelined. This creates a precarious situation for the housing market, which could be affected if investor sentiment changes. There is a distinct regional difference, with the Northeast performing well while the West lags behind, experiencing a 4.0% sales decline year-over-year. This divide suggests an opportunity for a pairs trade: go long on REITs heavily invested in the Northeast while shorting those focused on the West Coast. This strategy can protect against overall market movements while capitalizing on specific regional trends. Create your live VT Markets account and start trading now.US business activity shows strong growth in manufacturing and services, signaling rising inflation and employment pressures
The S&P Global US Manufacturing PMI for August 2025 is 53.3, beating the estimated 49.5. The Services PMI reached 55.4, also higher than the expected 54.2. The Composite PMI index rose to 55.4 from 55.1 in July, hitting an eight-month high, with output and demand increasing for 31 months straight.
Manufacturing output saw its largest monthly growth since May 2022, and new orders hit their highest level since February 2024. These figures align with an economy growing at an annual rate of 2.5%, up from 1.3% in the first half of 2025. Rising demand has led to significant backlogs and a record pace of finished goods stockpiling.
Rising Input Prices
Due to tariffs, input prices rose at the fastest rate since May 2023, the second-largest increase since January 2023. Inflation pressures are at a three-year high, indicating the consumer price index might exceed the Federal Reserve’s 2% target. Employment growth has continued for six months, the fastest pace since January 2025. Backlogs have led to manufacturing and services hiring at their highest levels since March 2022 and May 2022, respectively. Business confidence is at a two-month high, though it is still below levels seen in early 2025. The growth outlook for Q3 is a healthy 2.5% annualized rate, but inflation risks persist due to ongoing tariff pressures, which may lead to higher yields and a stronger USD. The August PMI report significantly alters our outlook. The manufacturing index rise to 53.3, compared to the 49.5 estimate, suggests a stronger economy than we expected. This challenges market predictions for a Federal Reserve rate cut in September, which still has a 79% probability of occurring. We need to rethink our interest rate strategies. The 2-year Treasury yield, which was around 4.4% last week, is very sensitive to Fed policy changes and is likely to rise sharply after this news. It may be wise to sell short-term interest rate futures, like those tied to the Secured Overnight Financing Rate (SOFR), to prepare for the market adjusting to a more hawkish Fed.Good News Is Bad News Scenario
For equity traders, this “good news is bad news” scenario could lead to increased market volatility. Strong economic growth may boost earnings, but the possibility of higher interest rates for a longer duration will pressure valuations, as we saw frequently in 2023. We should brace for fluctuation in the S&P 500 and consider options strategies like straddles or buying calls on the VIX index, which is currently near a low of 13. The US dollar can significantly benefit from this situation. As the US economy accelerates at a 2.5% annual rate, while new data shows sluggish growth in Europe, the case for a stronger dollar strengthens. We should consider taking long positions on the dollar, perhaps through call options on the U.S. Dollar Index (DXY) or against currencies like the euro. Lastly, the report highlights rising input costs and the fastest increase in selling prices since August 2022, suggesting inflation is resurging. The impact of tariffs and the record stockpiling of finished goods indicates ongoing price pressures. This environment could favor options on inflation-linked bond ETFs or specific industrial commodities that benefit from both robust manufacturing and inflationary trends. Create your live VT Markets account and start trading now.US stocks are expected to decline, with NASDAQ likely falling below its 200-hour average.
The NASDAQ index fell yesterday, dropping more than 400 points during the session. This drop took the index below its 200-hour moving average, a level not breached since August 1. Back then, the NASDAQ briefly dipped below this average but quickly bounced back, reaching an all-time high of 21803.75 on August 13.
Yesterday, the index tested the 200-hour moving average at 21140.04 but closed slightly higher at 21172.86. Currently, futures indicate an opening drop of 87.32 points, which may push the index back below the 200-hour moving average, likely benefiting sellers. The immediate downside target is set at 20864.09, the 38.2% retracement from the low on June 23.
Market Economic Indicators
Later today, the S&P Global Manufacturing PMI is expected to be 49.5, down from last month’s 49.8. The services PMI is projected at 54.2, a decrease from 55.7. At 10 AM ET, US existing home sales for July are forecasted at 3.92 million, slightly lower than the previous 3.93 million. Additionally, the US leading index for July is expected to drop by 0.1%, a shift from the prior 0.3% decline. US stocks are likely to open weakly, with a particular focus on the NASDAQ as it looks to start below its 200-hour moving average. This level has been important for buying activity, and a sustained breach could indicate a change in short-term market control. Yesterday already saw a significant drop of over 400 points, testing this key support. This technical breakdown coincides with July’s CPI report, which showed core inflation steady at 2.8%, complicating prospects for interest rate cuts. Fed officials have indicated they will keep interest rates at 5.0% through the end of the year, creating challenges for growth-oriented tech stocks. The market is adapting to the reality that borrowing costs will stay high longer than expected. Looking back, we saw a similar dip below this moving average on August 1, but buyers quickly entered the market, driving the index to a new high of 21803.75 just last week on August 13. However, yesterday’s decline felt stronger, and today’s pre-market futures suggest that sellers still have momentum. This pattern resembles the volatile conditions we faced in late 2023 due to rate uncertainty.Derivative Trading Strategies
For derivative traders, this situation may be a signal to consider defensive strategies. The VIX, which stayed near 13 for most of July, has risen to 17.5 this week. This increase makes option premiums more appealing for sellers but also indicates growing fear. Buying near-term put options on the QQQ, perhaps with September expirations, may provide protection against further declines toward the next major support level. The key downside target for the NASDAQ is at the 38.2% retracement level of 20864.09. Yesterday’s low was very close to this mark, suggesting it is on the radar for institutional sellers. A clear break of the 200-hour moving average today would likely lead to testing the 20864 level in the upcoming sessions. However, given the sharp rebound after the dip on August 1, we need to be cautious of a “head fake.” If the market stabilizes and reclaims the 200-hour average, it could trap short-sellers and create a bear trap. In such a case, strategies that profit from volatility without a clear direction, like straddles or strangles, might be more effective. Attention will be on the S&P Global PMI estimates and existing home sales data released later this morning. Any indication of a sharper-than-expected economic slowdown could confirm bearish sentiments and lead to further declines. Conversely, stronger data might encourage buyers to defend these key technical levels once more. Create your live VT Markets account and start trading now.USDCAD rises toward new highs while staying above key support levels
The USDCAD pair is on the rise, currently trading in a swing area between 1.3891 and 1.3904. If it breaks above this zone, it could reach the 38.2% retracement level of the March 4 decline at 1.39229. This level is crucial for buyers looking to regain control after a recent downturn.
The movements have been encouraging. The pair crossed above the 100- and 200-bar moving averages on the 4-hour chart at 1.37966 and 1.3742, respectively, as well as the 100-day moving average at 1.3769. Notably, on Tuesday, it broke through a previous swing zone from 1.3812 to 1.38215, reflecting strong upward momentum.
Hourly Chart Movements
On the hourly chart, the price dipped below the 100-hour moving average of 1.3838 on Monday but bounced back quickly, boosting buyer confidence. The rally then continued past the August 1 high of 1.38785, maintaining its upward trend today. For intraday traders, a close risk level is at 1.3875, the August 1 high. More conservative traders might look at the rising 100-hour moving average at 1.3838 as their risk point. As long as these support levels hold, the momentum favors further upward movements. The USDCAD is showing strong upward momentum, approaching a key resistance zone between 1.3891 and 1.3904. Buyers are in command, driving prices above several important moving averages. A breakout above this area would confirm that the current bullish trend has room to extend.Economic Factors and Market Dynamics
This technical strength is supported by diverging economic data. The latest US Core PCE data for July was 3.1%, slightly above expectations, suggesting the Federal Reserve will likely keep interest rates steady for the remainder of the year. In contrast, Canada recently reported a surprising loss of 15,000 jobs, raising worries about an economic slowdown. Adding further pressure on the Canadian dollar, WTI crude oil prices have dipped below $75 a barrel due to renewed concerns about global demand. This environment supports a stronger US dollar compared to the Canadian dollar. The current market conditions remind us of the late 2022 setup when hawkish Fed policies significantly strengthened the dollar. For those trading derivatives, this may be an opportunity to position for more upside, such as buying call options with strike prices above 1.3900. Intraday risks can be managed against the 1.3875 level, while traders holding long-term futures positions should monitor the 100-hour moving average around 1.3838 as a key support. The most critical level to watch is 1.39229, which marks the 38.2% retracement of the decline from the March 4, 2025 high. A sustained move above this level would confirm that the downtrend from earlier this year is reversing. Until we see that, buyers have the edge but have not yet won the larger battle. Create your live VT Markets account and start trading now.Canada’s PPI for August increases by 0.7% due to rising metals and livestock prices, despite a drop in gasoline.
Raw Material Price Index Performance
The Raw Material Price Index (RMPI) rose by a slight 0.3% from last month, down from 2.7%. When we leave out energy products, the RMPI increased by 0.4%. Year over year, raw material prices went up by 0.8%, and if we exclude crude energy products, the jump is 12.6%. Gold, silver, and platinum experienced a big year-over-year increase of 30.9%. Cattle and calves rose by 17.1%, while hog prices grew by 18.1%. However, conventional and synthetic crude oil prices fell by 18.0% and 15.2%, which moderated the RMPI increase. This August’s producer price data was stronger than anticipated, showing that factory gate inflation is rising. The Bank of Canada will likely see this as a warning that inflation is persisting. As a result, we may need to consider a more aggressive approach from the central bank in the upcoming weeks. Due to this unexpected data, we can expect higher short-term interest rates than what the market predicted. Reviewing the aggressive rate hikes in 2022 and 2023, we know the Bank takes strong inflation data seriously. We should adjust derivative positions to prepare for a possible rate hike at the next meeting.Implications for Currency Market and Interest Rates
The Canadian dollar is in a complicated situation. A hawkish central bank is a positive factor, but the drop in crude oil prices is a major challenge. Since 2024, the dollar has struggled even with higher interest rates in a weak oil market. Options strategies that benefit from increased volatility in the USD/CAD pair may work well here. The report indicates a move toward safe investments, as precious metals surged due to high demand for safety. This trend persisted throughout much of 2024, with gold hitting record highs above $2,400 per ounce. It may be wise to consider long positions in gold and silver using call options to take advantage of this momentum. Meanwhile, the sharp decline in energy prices shows ongoing weakness in that area. The 18% year-over-year drop in conventional crude oil is significant. This could be a signal to buy put options on oil futures for protection and potential gains. The notable rise in softwood lumber prices is also a key signal, reminiscent of the significant rally in 2021 when prices tripled in less than a year. This suggests that supply chain issues may be returning in certain sectors. A small, speculative long position in lumber futures or calls might be advisable. For the broader equity market, this inflation report presents challenges. A more aggressive central bank means higher borrowing costs, which can slow economic activity. It may be wise to buy protective put options on the S&P/TSX 60 index to guard against a possible market downturn. Create your live VT Markets account and start trading now.US initial jobless claims rise to 235K, surpassing the estimated 225K and hinting at potential weakness
Initial jobless claims for this week hit 235,000, exceeding the forecast of 225,000. This is an increase from last week’s number of 224,000. The 4-week moving average of initial claims grew to 226,250, up from 221,750 the week before.
Continuing claims rose to 1.972 million, slightly above the estimate of 1.960 million, and higher than the previous week’s 1.953 million. The 4-week moving average for continuing claims increased to 1.954 million, compared to 1.948 million last week.


