The UK Office for National Statistics will soon release the November Consumer Price Index (CPI). It’s expected to show a slight decrease in inflation, dropping to 3.5% from 3.6% in October. Monthly inflation is likely to remain unchanged after a 0.4% increase last month. The core CPI, which excludes food and energy, is predicted to stay at a 3.4% year-on-year rise.
The GBP/USD exchange rate rose to about 1.3425 during the early Asian session, thanks to encouraging preliminary PMI data from the UK. The UK Composite PMI climbed to 52.1, beating estimates of 51.4. The Services and Manufacturing PMIs stand at 52.1 and 51.2, respectively. These stronger-than-expected numbers have supported the Pound Sterling against the US Dollar.
GBP/USD Surge
On Tuesday, GBP/USD surged by 0.42%, driven by weak US jobs data and stable Retail Sales. It traded at 1.3432 after hitting a daily low of 1.3355. The US Nonfarm Payrolls came in at 64K, exceeding the expected 50K, while the Unemployment Rate rose from 4.4% to 4.6%, slightly above the Federal Reserve’s estimate of 4.5%.
Right now, we are focused on the UK inflation data coming out today, December 17th. With core inflation expected to remain steady at 3.4%, any unexpected results could lead to significant movements in the pound. This situation is reminiscent of the challenges the Bank of England faced in 2023 when core CPI stubbornly stayed above 6% for months, complicating their monetary policy.
On the other hand, the US dollar appears weak after the disappointing jobs report and the unemployment rate increasing to 4.6%. A similar situation occurred in late 2023 when slowing job growth and a rising unemployment rate of 3.9% led to quick adjustments in market expectations for Federal Reserve rate cuts. This suggests that purchasing options to safeguard against further dollar weakness might be a wise choice as we head to year-end.
Even with inflation worries, the positive UK PMI data shows economic resilience, with the composite number reaching 52.1. The strength of the services sector offers a solid support for the pound, especially when compared to the weakening US labor market. Traders may see this as a good time to keep their long positions on sterling, possibly using futures contracts to capitalize on this view.
Expected Volatility
Given these mixed signals, we anticipate an increase in short-term volatility around the pound. The Cboe Volatility Index (VIX) is currently at about 13.5, a relatively low level historically, indicating that options may be favorably priced. This environment is ideal for option strategies that can benefit from significant price movements after the CPI release, regardless of the direction.
Create your live VT Markets account and start trading now.
Gold has long been valued as a reliable store of value and a means of exchange. It acts as a safe-haven asset and a way to protect against inflation and currency loss. Central banks, especially those in China, India, and Turkey, hold significant amounts of gold. In 2022 alone, they added 1,136 tonnes, worth $70 billion, to their reserves.
Gold prices often move in the opposite direction of the US Dollar and Treasuries. Typically, when the Dollar and other risky investments decline, gold prices rise. Events like geopolitical unrest or economic downturns tend to increase gold prices, as do lower interest rates. On the other hand, a strong Dollar usually keeps gold prices in check, while a weaker Dollar helps them rise.
Today, December 17, 2025, gold prices are slightly up. This may indicate a growing interest in gold as a safe-haven investment. With rising concerns about inflation and currency devaluation, gold’s importance in our current economic environment is increasing. If these market worries continue, this small increase could lead to a more significant upward trend.
Market Trends and Strategies
We think the market is anticipating a possible interest rate cut by the U.S. Federal Reserve in the first half of 2026, which is putting pressure on the Dollar. Since gold does not earn interest, it usually performs better when rate expectations fall. We noticed this pattern during the speculation around policy changes in late 2023. As a result, the U.S. Dollar Index (DXY) has dropped to about 101.5, creating a good environment for rising gold prices.
Central bank purchases are also giving solid support to the market. This trend has continued since the significant gold accumulation we observed in 2022. Recent reports from the World Gold Council show that in the third quarter of 2025, central banks, mainly in Asia, increased their global reserves by a net 337 tonnes. This ongoing demand helps create a solid price floor for gold.
Additionally, the latest global manufacturing PMI data indicates a decline for the third month in a row, raising concerns about a broader economic slowdown. This uncertainty keeps the CBOE Volatility Index (VIX) above 20, which often leads investors to seek safer assets like gold. The relationship between gold and riskier investments suggests that a drop in stock prices could further push up gold prices.
With all this in mind, we should explore strategies that could benefit from a potential rise in gold prices in the coming weeks. Taking long positions through gold futures or purchasing call options could help us take advantage of this expected trend while managing risk.
Create your live VT Markets account and start trading now.
The EUR/USD falls to about 1.1730 during early European trading on Wednesday due to increased demand for the US Dollar. This drop comes as the ECB is likely to keep interest rates steady for the fourth time, maintaining the key deposit rate at 2% since July.
US labor market data shows some resilience but with signs of slowing. In November, Nonfarm Payrolls grew by 64,000, surpassing predictions of 50,000. However, the unemployment rate rose to 4.6% from 4.4% in October, which could weaken the dollar.
Technical Analysis
Currently, EUR/USD stands at 1.1732, while the 100-day EMA sits at 1.1611, indicating a possible upward trend. The RSI is at 65.58, showing strong momentum. Resistance is at 1.1788, with support levels at 1.1639 and 1.1611. This suggests a bullish outlook unless resistance is encountered.
The European Central Bank (ECB), based in Germany, manages monetary policy in the Eurozone, focusing on keeping inflation around 2%. The ECB’s actions, like adjusting interest rates and implementing quantitative easing, significantly influence the Euro’s strength.
Quantitative easing, which occurs during financial crises, usually weakens the Euro, whereas quantitative tightening, which stops bond buying, often strengthens the currency.
Economic Data and Policy Divergence
Currently, the EUR/USD is around 1.1730 as we await the ECB’s December rate decision. The ECB confirmed expectations last Thursday by keeping its key deposit rate at 2.0%, providing market clarity. This stability has helped the pair break through past technical barriers.
Recent economic data paints a clearer picture compared to the mixed US jobs report from November 2025. Latest Eurozone inflation data shows core HICP steady at 2.6%, suggesting that the ECB isn’t planning further rate cuts for the moment. On the other hand, US Core PCE, the Fed’s chosen inflation measure, has recently dipped to 2.8%, raising speculation about a possible rate cut in the first half of 2026.
This difference in policies has pushed the pair above the 1.1788 resistance level, which now serves as a potential support zone. In the coming weeks, traders should keep an eye out for a potential test of the 1.2000 psychological level. Buying call options with strikes above 1.1900 could be a good strategy for those looking to capitalize on further gains.
With the ECB meeting now completed, implied volatility is likely lower, making options strategies cheaper. Traders might consider entering long positions via futures contracts during pullbacks toward the 1.1788-1.1800 range. Using protective put options below 1.1750 can help manage risks in case of a sudden reversal.
Create your live VT Markets account and start trading now.
Gold prices in Pakistan rose on Wednesday. The cost per gram increased to 38,987.39 PKR from 38,840.55 PKR on Tuesday. Similarly, the price per tola went up to 454,732.40 PKR from 453,028.60 PKR the previous day.
FXStreet adjusts international gold prices using the Pakistani currency and measurement systems. These gold prices are updated daily based on current market trends, and local rates can vary. Here are the listed prices: 1 gram at 38,987.39 PKR, 10 grams at 389,866.30 PKR, and 1 tola at 454,732.40 PKR.
Gold As A Secure Asset
Gold is a reliable asset during economic instability, protecting against inflation and currency decline. Central banks are significant buyers of gold; in 2022, they added 1,136 tonnes worth $70 billion to their reserves, making it the highest yearly purchase on record.
Gold often rises when the US Dollar weakens, providing diversification during turbulent markets. As it does not yield returns, gold usually increases with lower interest rates and drops with higher rates. Its value largely depends on the strength of the US Dollar.
The recent increase in gold prices, particularly in the Pakistani Rupee, signals a broader trend of hedging against currency decline and ongoing inflation. This trend suggests that safe-haven assets are becoming more important in the upcoming weeks. Traders should keep an eye on the relationship between gold and the US Dollar.
We are closely monitoring the latest inflation data. The US CPI for November 2025 was slightly higher than expected at 3.5%. This ongoing inflation complicates the Federal Reserve’s decisions and creates uncertainty about planned rate cuts in 2026. Such conditions typically favor non-yielding assets like gold.
Impact Of The US Dollar On Gold Prices
The US Dollar Index (DXY) has dipped below 102, which helps boost gold prices. Historically, a weaker dollar tends to raise gold prices. Traders should consider this strong inverse relationship when planning their positions for the year-end.
This trend is supported by strong demand from institutions, which we have noticed over several years. According to World Gold Council data, central banks, especially in emerging markets, bought an additional 250 tonnes in Q3 2025, following the record purchases in 2022 and 2023, creating a solid market foundation.
Geopolitical tensions also significantly affect the market, as renewed trade issues contribute to uncertainty. Economic instability might lead to a rush for safety, and gold is the key beneficiary in such volatile times. We expect any escalations to be immediately reflected in gold futures and options prices.
Given the current uncertainty, preparing for increased market volatility seems wise. Using derivatives to invest in gold volatility, such as through straddles on major gold ETFs, could be a smart strategy. This approach allows traders to profit from significant price movements in either direction as economic pressures unfold.
We are also seeing a growing skew in the options market, with call option premiums rising compared to puts. This indicates that while overall volatility is anticipated, the market is leaning towards a higher chance of a substantial upward shift. This sentiment provides valuable insights into market expectations for early 2026.
Create your live VT Markets account and start trading now.
On Wednesday, gold prices in India rose, according to FXStreet data. The price per gram increased to 12,552.61 Indian Rupees (INR) from 12,501.23 INR the day before.
The price for a tola went up to 146,404.30 INR from 145,811.80 INR. Here are the prices in different units:
– 1 gram: 12,552.61 INR
– 10 grams: 125,520.20 INR
– Tola: 146,404.30 INR
– Troy ounce: 390,413.90 INR
FXStreet calculates gold prices by converting international rates using the USD/INR exchange rate. Prices are updated daily and may differ slightly from local market prices.
Gold is seen as a safe-haven investment during financial uncertainty. Central banks hold the most gold, with 1,136 tonnes added to their reserves in 2022, marking the highest yearly purchase.
Gold prices typically move in the opposite direction of the US Dollar and US Treasuries. Factors that influence gold prices include geopolitical issues, interest rates, and the Dollar’s strength. A strong Dollar usually puts downward pressure on gold prices, while a weak Dollar can drive them up.
Outlook for Gold Prices and Derivatives
The small rise in gold prices reflects a larger trend we are monitoring. As discussions about a global economic slowdown ahead of 2026 increase, gold is reaffirming its status as a leading safe-haven asset. This is what derivative traders should focus on, rather than minor daily price changes.
We think that the main factor in the coming weeks will be expectations regarding monetary policy, especially from the US Federal Reserve. After a period of aggressive rate hikes in 2023 and 2024 to manage inflation, markets now anticipate a shift toward lower rates by the second half of 2026. Lower interest rates reduce the cost of holding non-yielding gold, which historically supports higher prices.
This expectation is already putting pressure on the US Dollar, which usually moves opposite to gold prices. The dollar index (DXY) has recently fallen below the key level of 100 as traders expect looser monetary policy. Historically, a weaker dollar makes gold cheaper for holders of other currencies, often boosting global demand.
Additionally, central banks continue to buy gold, creating a strong support level for prices. Following record purchases in 2022 and 2023, data from the World Gold Council indicates that this trend will likely continue into 2024 and early 2025, with emerging market banks leading the purchases. This steady demand helps provide a foundation that limits downside risk.
For derivative traders, this environment suggests focusing on long positions through call options to take advantage of potential gains while managing risk. The ongoing discussions about a slowdown have also pushed the VIX toward the 20 level, indicating that buying options to benefit from rising volatility might be a smart strategy. We should consider contracts that expire in the first and second quarters of 2026 to coincide with the expected policy shift.
However, we need to be alert for any unexpectedly strong economic data, such as a surprising rise in the upcoming US Non-Farm Payrolls report. A strong jobs number or higher inflation could delay anticipated rate cuts, leading to a temporary jump in the dollar and a drop in gold prices. This could pose a short-term challenge to bullish positions.
Create your live VT Markets account and start trading now.
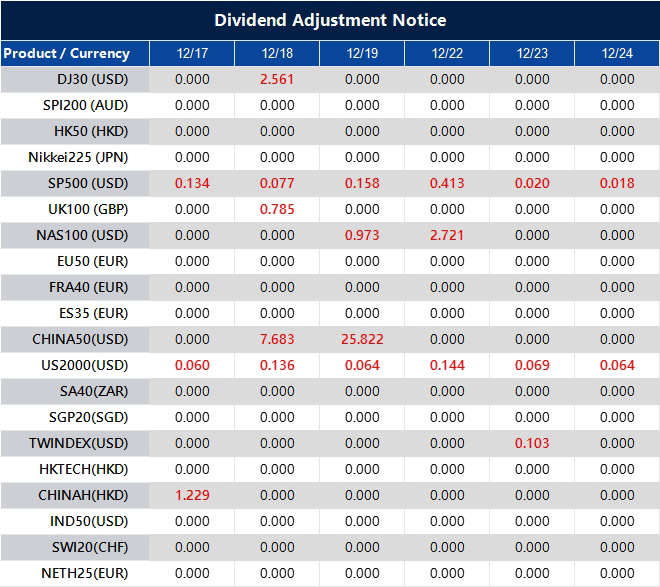
Please note that the dividends of the following products will be adjusted accordingly. Index dividends will be executed separately through a balance statement directly to your trading account, and the comment will be in the following format “Div & Product Name & Net Volume”.
Please refer to the table below for more details:
The above data is for reference only, please refer to the MT4/MT5 software for specific data.
If you’d like more information, please don’t hesitate to contact [email protected].
Written on December 17, 2025 at 8:16 am, by anakin
Gold prices in Malaysia rose on Wednesday, according to FXStreet data. The price per gram went up to 567.79 Malaysian Ringgits (MYR) from 565.44 MYR the day before.
The price for a tola of gold increased to MYR 6,622.75 from MYR 6,595.20. FXStreet calculates gold prices by adjusting international prices to the local currency, updating them based on current market rates.
Safe Haven Asset and Inflation Hedge
Gold is a safe-haven asset and serves as a hedge against inflation. People often buy gold when times are uncertain. Central banks are significant buyers, purchasing 1,136 tonnes worth about $70 billion in 2022.
Gold prices usually rise when the U.S. dollar declines, as they have an inverse relationship. Events like geopolitical instability and recession fears drive up gold prices, as it’s seen as a secure investment.
In general, gold prices react to changes in interest rates and the strength of the U.S. dollar. Lower interest rates can boost gold prices, while a stronger dollar can hold them back.
Local Price Action Reflects Global Market Strength
The recent increase in gold prices in Malaysia points to a broader strength in the global market. This suggests a solid support for gold, confirming a bullish trend likely to continue into early 2026.
The rise is mainly fueled by expectations around U.S. monetary policy. After a series of aggressive interest rate hikes in 2023 and a long pause in 2024, the Federal Reserve is indicating a potential shift toward easing as economic growth slows. This outlook is pressuring the U.S. dollar, which historically leads to higher gold prices.
We are also seeing strong demand from institutional buyers, which supports the price. In the third quarter of 2025, central banks worldwide added over 220 tonnes to their reserves, keeping up the aggressive purchasing trend that started in 2022. This consistent buying shows that nations prioritize gold as a safe-haven asset amid ongoing geopolitical uncertainty.
For derivative traders, this environment is favorable for positioning for more gains. Establishing long positions in gold futures or purchasing call options could be good strategies to benefit from the expected rise. It’s important to watch the key psychological level of $2,500 per ounce; breaking above it could trigger a new wave of buying.
Moreover, gold’s attractiveness as an inflation hedge remains strong, especially as core inflation has stayed above the central bank’s 2% target throughout 2025. With equity markets looking over-extended after a strong run, conditions are right for a shift from riskier investments to safe havens. Holding a long position in gold is a wise diversification strategy in the coming weeks.
Create your live VT Markets account and start trading now.
EUR/JPY is holding steady around 181.90 during the Asian session, recovering from two days of losses. This stability follows Japan’s trade balance surplus for November, which came in lower than expected at JPY 62.9 billion, down from JPY 74.0 billion in October.
On a positive note, Japan’s exports in November grew by 6.1%, beating the forecast of 4.8% and marking the fastest growth in nine months. Core machinery orders also performed well, rising by 7%. However, imports only increased by 1.3% year-on-year, which is below the anticipated 2.5%.
Bank of Japan Policy Outlook
Traders are taking a careful stance ahead of the Bank of Japan’s (BoJ) upcoming policy update. The BoJ meeting wraps up on Friday, focusing on guiding policy until 2026, as inflation targets seem more achievable.
The Euro could strengthen as expectations for further easing from the European Central Bank (ECB) in 2026 lessen after recent comments from officials. Key data, including Germany’s IFO Business Survey and the Eurozone’s Core Harmonised Index of Consumer Prices (HICP), will be important to watch.
The Euro represents 20 EU countries and is widely traded globally. The ECB manages the Eurozone’s monetary policy and affects the Euro’s value by adjusting interest rates; typically, higher rates make the currency stronger.
With EUR/JPY trading under 182.00, the market is feeling the pull of two opposing forces. The BoJ is expected to take action this week, while the ECB is signaling caution regarding rate cuts in 2026. This uncertainty presents an opportunity.
Expected Market Reactions
The key event is the BoJ policy meeting ending this Friday, December 19th. Strong data on Japanese exports and machinery orders has sparked expectations of a rate hike, which would strengthen the Yen and lower EUR/JPY. This is reflected in the overnight interest rate swaps market, now showing a more than 70% chance of a 10-basis-point hike from the BoJ this week.
Japan’s core CPI for November came in at 2.8%, marking the 20th month above the BoJ’s 2% target. This ongoing inflation, combined with strong economic data, pressures Governor Ueda to follow through on his hawkish indicators. The market reaction was significant when the BoJ ended its negative interest rate policy back in March 2024.
On the flip side, the Euro is receiving support from ECB officials who resist expectations for aggressive rate cuts next year. We will closely monitor today’s German IFO Business Survey and Eurozone HICP inflation data. The forecasts suggest a slight improvement for the German IFO to 88.1 and a steady core inflation rate of 2.4% in the Eurozone, which reinforces the ECB’s cautious approach.
For derivative traders, the increase in expected volatility presents a major opportunity. Implied volatility for one-week EUR/JPY options has climbed over 15%, a level not reached since the second quarter of 2025. This suggests that strategies like long straddles or strangles, which aim to profit from big price moves in either direction, could work well around the BoJ’s decision.
If we expect the BoJ to surprise with hawkish news, buying EUR/JPY put options set for late December or early January 2026 could position us for a drop below 180.00. Conversely, if we think the BoJ will adopt a dovish stance, call options might provide leveraged upside. The key is to prepare for a significant breakout from the current tight range before Friday’s announcement.
Create your live VT Markets account and start trading now.
The US Dollar Index (DXY) saw a slight increase in the Asian trading session. It recovered from a recent low of around 97.90-97.85, a level not seen since early October. The index climbed to 98.30, but further gains may be limited due to the Federal Reserve’s cautious stance.
From a technical viewpoint, the inability to hold above the 200-day Simple Moving Average (SMA) and a drop below the 100-day SMA favor those betting against the dollar. The daily chart shows negative indicators, implying that any rise may face selling pressure, especially with the 100-day SMA acting as resistance near 98.63.
At present, the 100-day SMA is below the declining 200-day SMA, indicating a bearish market outlook. The MACD is below both the Signal line and zero, with a shrinking negative histogram suggesting less downward momentum. The RSI is stabilizing around 35, just above the lower neutral range.
Risks to the downside remain while the DXY stays below key trend indicators, with resistance at the 200-day SMA of 99.25. The MACD and RSI hint at a weak recovery, with significant upside potential only occurring if the index moves consistently above resistance levels.
The US Dollar Index is currently steady around 98.30. However, the recent bounce from 97.90 appears weak. Overall, the sentiment suggests that the most likely movement for the dollar is downward, supported by the technical setup that signals any upward actions may be brief selling chances.
Trading Strategies and Market Context
Traders dealing in derivatives might want to prepare for further dollar weakness in the coming weeks. The Federal Reserve’s dovish comments at the December 2025 meeting have led to expectations for a softer monetary policy into the new year. This sentiment was strengthened by the November 2025 Consumer Price Index (CPI) report, which indicated year-over-year inflation dropped to 2.3%, allowing the Fed more room for potential rate cuts in 2026.
In this environment, buying DXY put options with strike prices below the recent 97.90 low could be a smart move to take advantage of a possible downward shift. The recent failure to sustain momentum over the 200-day moving average is a pattern that has occurred before this year. The effects of the tightening cycle from 2022-2023 are starting to show, as evidenced by the November 2025 jobs report, which revealed non-farm payrolls at only 110,000, well below expectations.
Another strategy is to treat any bounce toward the 100-day moving average, currently at 98.63, as a chance to enter short positions. Traders could look to sell DXY futures or set up bearish call spreads with a ceiling near the strong 99.25 resistance level. This approach aligns with negative signals on oscillators like the MACD and RSI, which are not in oversold territory yet, allowing room for more downside.
Create your live VT Markets account and start trading now.
Silver prices have hit a record high of almost $66 during Asian trading. This increase comes amid rising worries about the US economy, demonstrated by the unemployment rate climbing to 4.6% in November.
Economic reports show that the US added 64,000 jobs in November, which is better than expected, but follows a loss of 105,000 jobs in October. Retail sales were stagnant in October, and the preliminary S&P Global PMI dropped to 53.0 from 54.2.
Many believe the Federal Reserve may cut interest rates more than predicted in 2026. There’s now a 67.6% chance of at least two rate cuts next year. Currently, silver prices are up 3% and remain strong, holding above the 20-period EMA of $63.28.
The 14-period RSI is close to the overbought level at 69.16, indicating that prices might cool down before rising further. The market outlook stays positive while silver is above the rising EMA, but a fall below this level could put silver at risk, with support expected around $60.00.
Silver is valued for its inherent worth and ability to diversify investment portfolios. Its price is affected by geopolitical issues, interest rates, and the strength of the US Dollar. Demand from industrial and technological sectors also plays a key role in silver’s market.
Silver’s recent rise to nearly $66 is driven by disappointing US economic data. The Consumer Price Index for November showed inflation easing to 3.1%, strengthening expectations of upcoming Fed rate cuts. This trend has sparked a surge in demand for safer assets like silver.
Signs of an economic slowdown, such as the unemployment rate rising to 4.6% in November 2025, have the market predicting more aggressive actions from the Federal Reserve. There’s now nearly a 70% chance of two interest rate cuts in 2026, making silver—a non-yielding asset—more appealing.
The surge to record highs has led to increased volatility in silver options, with the CBOE Silver ETF Volatility Index (VXSLV) reaching 35%, the highest in over a year. This indicates that options are pricey, making it expensive to buy calls or puts directly. The high Relative Strength Index near 69 suggests the rally might soon take a breather.
Given the volatility, we should explore strategies that take advantage of this situation. Selling cash-secured puts during pullbacks to the $63 support level could be beneficial. Alternatively, bull call spreads can be used to aim for a rise toward the $70 target while limiting costs and risks. These defined-risk trades are wise while prices are at record highs.
Looking forward, the outlook for silver remains strong due to its industrial applications. Forecasts for 2026 suggest global solar panel installations will increase by another 30%, significantly boosting silver demand as a crucial component. This offers a solid support for silver beyond its status as a safe haven.
We are also tracking the gold/silver ratio, which is currently around 85:1, a historically high level. This indicates that silver may be undervalued compared to gold, suggesting it could outperform if the precious metals rally continues. A break below the 20-period moving average at $63.28 would signal us to reconsider this bullish perspective.