Profit-taking causes gold prices to drop as US employment data comes into focus
Gold prices dropped early on Tuesday in Europe, influenced by profit-taking and advancements in peace talks regarding Ukraine. As a safe-haven asset, gold faced pressure due to the Federal Reserve’s indication of only one rate cut expected next year amid ongoing uncertainty.
Although gold retreated from its seven-week highs, upcoming US retail sales, PMI data, and the nonfarm payrolls report may shed light on interest rate changes and affect gold prices. The recent Federal Reserve rate cut hints at more reductions in 2026, lowering the opportunity cost for holding gold.
US nonfarm payrolls data expected to increase volatility in the Forex market today
The US Dollar stabilized early Tuesday after small losses against major currencies on Monday. Important US economic data is coming out soon, including the October and November Nonfarm Payrolls (NFP), wage inflation, November’s Unemployment Rate, October Retail Sales, and the preliminary December S&P Global PMI. On Monday, the US Dollar dropped by 0.15% but stayed above 98.00 on Tuesday. Predictions suggest the Unemployment Rate will remain at 4.4% in November, with NFP expected to rise by 40,000.
EUR/USD held steady around 1.1750, waiting for German and Eurozone HCOB PMI data. GBP/USD dipped slightly but stayed above 1.3350, as we await the October employment figures from the UK’s Office for National Statistics. In Canada, the annual inflation rate remained steady at 2.2% in November. USD/CAD remained close to 1.3800, while USD/JPY fell about 0.4% due to expected changes in Bank of Japan policies.
Australia And Gold Market Trends
Private sector growth in Australia slowed, causing AUD/USD to trade below 0.6650. Gold prices hovered around $4,280, experiencing a decline amidst optimism over a possible Russia-Ukraine peace deal. Nonfarm Payrolls provide key insights into US employment, influencing decisions by the Federal Reserve and often positively impacting the US Dollar. A strong NFP typically indicates economic growth, affecting both currency and commodities like Gold. However, the market can react in complex ways, with various report details shaping the outcome. Today’s main event is the release of Nonfarm Payrolls data, expected to create considerable market volatility. Anticipating a minimal gain of only 40,000 jobs, we should be ready for sharp price movements in major currency pairs and indices. Derivatives traders can use options to position for this anticipated volatility spike, regardless of the market’s direction.Impact Of The US Labor Market
The weak outlook suggests a slowing US labor market, increasing pressure on the Federal Reserve to consider interest rate cuts. The Fed has held rates steady for an extended period, so any signs of economic weakness could speed up expectations for rate reductions in early 2026. This trend supports a bearish outlook for the US Dollar, as lower interest rates usually weaken a currency. So far this month, the US Dollar has lost ground against most major currencies, especially the Canadian Dollar. The reported unemployment rate of 4.4% is significantly higher than the under-4% levels typical of late 2023 to early 2024, indicating a clear shift in the labor market. If payroll numbers hit or drop below the 40k forecast, we might see another major drop in the USD Index. Additionally, the Bank of Japan is signaling a more aggressive policy stance, creating a clear divergence with the Fed. This makes shorting the USD/JPY pair an attractive strategy, as a dovish Fed paired with a hawkish BoJ supports this move. Traders could consider buying put options on USD/JPY to potentially profit from downward movement while managing risk. Gold is currently retreating, but we should see this in light of its rise above $4,300, which reflects ongoing inflation and geopolitical risks over the past two years. A weak jobs report would be bullish for gold, as it would likely weaken the dollar and lower real interest rates. Any price dips ahead of the data could be a good opportunity to position for a rise. The most important factor will be the deviation from the 40k expectation, as this will shape the market’s immediate response. A surprise figure that significantly exceeds this number could trigger a swift short squeeze on the dollar, catching many traders off guard. Thus, using defined-risk options strategies is wise to guard against unexpected outcomes. Create your live VT Markets account and start trading now.GBP/USD falls ahead of UK employment data, with unemployment rate expected to rise to 5.1%
The UK Office for National Statistics will release its labour market report at 07:00 GMT. The UK ILO Unemployment Rate is expected to rise slightly to 5.1% in October, up from 5.0% the month before. In September, there was a drop of 22,000 in Employment Change. November’s Claimant Count Change is anticipated to increase by 22,300 from October’s figure of 29,000, while the Claimant Count Rate is likely to remain at 4.4%.
GBP/USD is trading lower ahead of the UK’s labour market data. Traders are cautious because of upcoming US economic reports, including Nonfarm Payrolls, Retail Sales, and the Purchasing Managers Index, scheduled for release on Tuesday. If the US data is better than expected, it could lift the Pound Sterling, pushing it towards the 1.3400 psychological level. Initial resistance is at 1.3438, followed by 1.3471.
Stabilized Trading Range
The GBP/USD pair is stable, trading within the 1.3370-1.3365 range as traders await important economic releases. Key UK inflation data on Wednesday and the Bank of England’s policy decision on Thursday will be vital for the Pound. Additionally, US consumer inflation figures on Thursday will significantly impact GBP/USD’s short-term trajectory. Risk aversion has limited GBP/USD’s gains, with expectations of a BoE rate cut on Thursday. The market has almost fully priced in a 25-basis point rate cut, with another cut expected by mid-2026. This morning, the Pound is trading cautiously as the latest labour market data surfaces from the Office for National Statistics. The UK unemployment rate for November has just been reported at 4.5%, a slight rise from October’s 4.3%. This reinforces a cautious market mood. A weaker jobs report increases the likelihood that the central bank might need to take action soon. The current sideways movement of GBP/USD around the 1.3370 mark indicates that traders are waiting for a clear signal before making significant moves. Similar quiet periods in late 2023 were often interrupted by sharp movements as major economic data were released. This could make buying options, which benefit from increased volatility, an appealing strategy ahead of Thursday’s Bank of England decision.Monetary Policy Divergence
A major factor affecting the Pound is the growing gap between central bank policies. The market is now pricing in over an 85% chance of a 25-basis point rate cut by the Bank of England this week. This move is primarily a response to recent UK inflation data, which has cooled to 2.4%, closer to the bank’s target than the higher 3.1% inflation rate in the United States. This divergence is likely to limit the Pound’s strength against the dollar. Considering the potential for a rate cut, we are monitoring the 1.3400 level as a significant resistance point that may hold firm. Derivative traders with long positions might think about hedging by purchasing put options with a strike price below 1.3350 to guard against a negative response to the Bank of England’s announcement. A drop below the mid-1.3300s support could lead to a slide toward 1.3200. Create your live VT Markets account and start trading now.Dividend Adjustment Notice – Dec 16 ,2025
Dear Client,
Please note that the dividends of the following products will be adjusted accordingly. Index dividends will be executed separately through a balance statement directly to your trading account, and the comment will be in the following format “Div & Product Name & Net Volume”.
Please refer to the table below for more details:
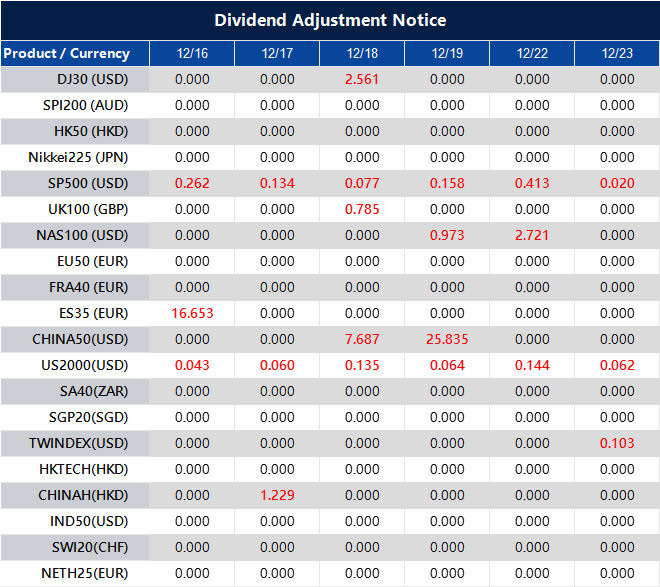
The above data is for reference only, please refer to the MT4/MT5 software for specific data.
If you’d like more information, please don’t hesitate to contact [email protected].
US Dollar Index drops below 98.50, trading near 98.25 in early European hours
The US Dollar Index (DXY) fell to about 98.25 during early trading in Europe on Tuesday. This drop happens as traders await the US Nonfarm Payrolls (NFP) report for October and November, which will help indicate the future direction of US interest rates.
Recently, the Federal Reserve (Fed) cut interest rates for the third time this year by 25 basis points, lowering them to 3.50%-3.75%. This decision may influence the Dollar. Data shows there’s a 76% chance the Fed will keep these rates steady in January 2026.
Monetary Policy Impact
New York Fed President John Williams believes the monetary policy is in a good position for next year after the recent cuts. On the other hand, Fed Governor Stephen Miran thinks the current policies are too strict. Traders expect more guidance from Fed officials later this week. The US Dollar is the official currency of the US and plays a vital role globally, being part of 88% of worldwide transactions. The Fed’s policies, especially rate changes, affect the Dollar’s value by managing inflation and supporting jobs. Occasionally, the Fed uses methods like quantitative easing (QE) to weaken the Dollar or quantitative tightening (QT) to strengthen it. As the US Dollar Index hovers around 98.25, we anticipate significant market moves today. The delayed Nonfarm Payrolls report for October and November is the key event to watch. If the labor market shows signs of weakness, the Dollar will likely face more pressure. We should be ready for a strong market reaction to the jobs data, with the consensus expecting around 150,000 new jobs. If the number falls below 100,000, it could push the DXY below the 98.00 support level, raising expectations for further Fed rate cuts. On the flip side, if job additions exceed 200,000, it could challenge the current pessimistic outlook and boost the Dollar.Market Reactions and Strategies
After the Fed’s recent rate cut to the 3.50%-3.75% range, the market estimates a 76% chance of a pause in January 2026. However, a weak payroll report could quickly alter those odds, increasing the likelihood of another rate cut. This will directly affect short-term interest rate futures and swaps. For options traders, the high event risk means there is greater volatility for dollar-related currency pairs. This creates opportunities for strategies like straddles or strangles to capitalize on significant price movements after the announcement. We’ve noticed similar patterns on NFP days in 2024 and 2025, where initial price changes can be dramatic. In a broader view, the US economy has been slowing down, a trend we’ve monitored for several quarters. The latest November CPI report showed core inflation easing to 3.1%, a sign that supports the Fed’s rate cut but is still above their 2% target. This jobs report is crucial to understanding if the economic slowdown is picking up pace. If the jobs data is poor, leading to a weaker Dollar, pairs like EUR/USD and GBP/USD could trend towards recent highs. Traders should prepare for increased movement in all major currency pairs, not just the Dollar Index. This report will set the trading tone for the remainder of the year. Create your live VT Markets account and start trading now.Gold prices decline in Saudi Arabia, according to recent data sources
Gold prices in Saudi Arabia fell on Tuesday. According to FXStreet, the price is now 517.40 Saudi Riyals per gram, down from SAR 519.27 on Monday. The price per tola decreased to SAR 6,034.81 from SAR 6,056.70.
FXStreet calculates these prices by adjusting international rates (USD/SAR) to local currency and updating them based on market conditions. Remember, these prices are for reference and may vary slightly in the local market.
The Role of Gold in Investment
Gold is commonly seen as a way to preserve wealth and as a medium for exchange. It’s often treated as a safe-haven asset during tough economic times and is viewed as protection against inflation. Central banks, which aim for economic stability, are the largest gold holders, adding 1,136 tonnes valued at around $70 billion to their reserves in 2022. Gold prices tend to move opposite to the US Dollar and US Treasuries, significant reserve assets. When the Dollar weakens, gold prices usually go up, while a strong Dollar tends to keep gold prices steady. Changes in gold prices are influenced by geopolitical instability, interest rates, and the strength of the Dollar. Lower interest rates make gold more attractive, whereas higher rates typically do the opposite. Today, December 16th, gold is seeing a slight pullback. This could be a good opportunity for traders entering the market. This small daily shift follows a period of strong performance. We see this not as a sign of a trend reversal, but as a time of consolidation within a broader upward trend.Central Bank Demand and Economic Factors
A major factor for consideration is the US Federal Reserve’s changing approach, which indicates it might pause its rate hikes in early 2026. Current data from the CME FedWatch Tool highlights a 60% chance of a rate cut by mid-2026, a notable increase from just 20% two months ago. A weaker US Dollar, which has already decreased by 3% in the last quarter, usually leads to higher gold prices. We’re also closely monitoring the strong demand from central banks, which supports gold prices. The World Gold Council reported that during the third quarter of 2025, global central banks added another 250 tonnes to their reserves, continuing the record trend from 2022 and 2023. This ongoing effort to move away from the Dollar, especially among emerging market banks, keeps demand for gold strong. Geopolitical tensions and worries about a global economic slowdown are increasing gold’s attractiveness as a safe-haven asset. Recent forecasts from the World Bank have downgraded global GDP growth for 2026 to 2.4%, raising recession fears. For derivative traders, this means we might expect higher implied volatility in gold options, making long vega strategies potentially profitable. Create your live VT Markets account and start trading now.Gold prices in the Philippines decline today, according to data
Gold prices in the Philippines fell on Tuesday, according to FXStreet data. The price dropped to 8,114.36 Philippine Pesos (PHP) per gram, down from PHP 8,143.01 on Monday. The price per tola also went down, from PHP 94,978.43 to PHP 94,641.94.
FXStreet calculates these prices by converting international gold prices (USD/PHP) into local currency units. Keep in mind that local prices may vary slightly from these rates.
Gold as a Safe Haven
Gold has always been valued as a reliable asset. It’s used as a store of value, a medium of exchange, and a safe-haven investment. People tend to buy gold during tough economic times to protect against inflation and currency drops. In 2022, central banks bought 1,136 tonnes of gold, worth about $70 billion, setting a record. Gold usually moves in the opposite direction of the US Dollar and US Treasuries. It offers diversification during dollar declines and typically weakens when stocks are doing well. Uncertainty in geopolitics or fears of a recession can push gold prices up. Changes in interest rates and the strength of the dollar also play a big role in market trends. Gold prices might be down a little today, but this shouldn’t take attention away from the overall trend. The big factor influencing our strategy is the growing expectation of interest rate cuts from major central banks in the first half of 2026. Recent inflation reports from November 2025 came in softer than expected, leading to a strong chance—over 70%—of a rate cut by March. This situation puts pressure on the US Dollar, which moves inversely to gold. The Dollar Index (DXY) has fallen to about 98.5, the lowest in six months, and further weakness is likely as monetary policy eases. For traders, this scenario makes gold a strong hedge against a declining dollar. Additionally, there’s a steady demand for safe-haven assets, fueled by concerns over slow global growth and ongoing trade talks. We observed a similar trend during the economic uncertainty in early 2020s, which provided strong support for gold prices. This pattern suggests that even small dips in price might be seen as buying chances by larger funds.Central Bank Impact on Gold Market
Central bank purchases continue to be a crucial support for the gold market. After record buying in 2022 and 2023, the World Gold Council’s Q3 2025 report revealed that central banks added another 250 tonnes to their reserves. This ongoing demand helps absorb supply and strengthens gold prices. For derivative traders, this situation suggests that buying call options or setting up bull call spreads on gold futures for February and March 2026 could be a smart move. Implied volatility is increasing ahead of the expected announcements from central banks, allowing for potential price gains. We aim for a break above the key resistance level of $2,450 per ounce. However, it’s essential to manage risk as unexpected hawkish comments from central banks might cause prices to drop sharply. Traders should think about using spreads to minimize upfront costs and losses. For those dealing with futures, keeping clear stop-loss orders below recent support levels is crucial to safeguard capital. Create your live VT Markets account and start trading now.HSBC Services PMI for India drops to 59.1 in December from 59.8
The Indian services sector continued to grow in December, with the HSBC Services PMI at 59.1, down slightly from November’s 59.8. This shows steady growth, although it’s at a slower pace.
The Services PMI tracks the health of the sector through private surveys. A score above 50 means expansion, while below 50 indicates contraction. This sector is crucial, significantly affecting India’s GDP and job creation.
Slight Drop in PMI Reading
The small drop in the PMI could be due to seasonal changes, shifts in demand, or disruptions in supply chains. Businesses are adjusting to the changing market, making performance in this sector a key focus. Despite this slight decline, the PMI indicates a healthy services sector. Keeping an eye on future readings will help us understand whether this growth trend can continue. The Indian services sector remains strong with the December PMI at 59.1. Although this is a small dip from the previous 59.8, it hints that growth may be slowing. This uncertainty may lead to increased implied volatility in Nifty options in the upcoming weeks. This information is crucial as we recently saw consumer price inflation in November 2025 rise to 5.2%, nearing the top of the Reserve Bank of India’s target range. Ongoing economic activity, even if slightly slower, gives the central bank little reason to lower interest rates soon. Traders should be cautious about expecting any major gains in rate-sensitive sectors.Global Financial Conditions
We also need to consider the global situation. The US Federal Reserve indicated last month that it would maintain interest rates through the first quarter of 2026. We experienced a similar trend in late 2023 when strong domestic growth in India faced tight global financial conditions, leading to a stable market. This suggests that strategies like selling strangles, which profit from the Nifty remaining within a certain range, could be effective. Given the slight loss of momentum in the new PMI reading, those with long futures positions should think about tightening their stop-losses. For option traders, purchasing protective put options for January 2026 is a smart way to safeguard existing portfolios. A simple put spread can help lower the cost of protection while still providing significant security against any sudden slowdown. Create your live VT Markets account and start trading now.HSBC Manufacturing PMI in India falls from 56.6 to 55.7 in December
India’s Manufacturing Purchasing Managers’ Index (PMI) dropped from 56.6 to 55.7 in December, according to HSBC’s latest report. A PMI above 50 indicates growth, but this decline shows that the manufacturing sector is expanding at a slower pace.
Challenges, possibly due to global economic conditions and local market trends, are impacting the manufacturing industry. While it remains in growth territory, this slower expansion could affect the economy and policy decisions.
Implications Of The PMI Decrease
We need to analyze what this PMI drop means for India’s economic strategies. This is especially important as international economic pressures and policy discussions, like those from the Federal Open Market Committee (FOMC), arise. With the Manufacturing PMI now at 55.7, there is a noticeable slowdown in the market. The Nifty 50 index already had a significant rally of over 18% in 2025, and this new data might lead to some profit-taking. It could be wise to consider out-of-the-money Nifty put options to protect long portfolios against a possible dip as we near the year’s end. The slower growth could also influence the Indian Rupee, especially as the US Federal Reserve indicates a “higher for longer” interest rate policy. Foreign institutional investor (FII) flows, which were positive by over $20 billion for much of 2025, have begun to slow down. This PMI reading may push traders towards long USD/INR futures, predicting some weakness in the Rupee. The slowing growth gives the Reserve Bank of India (RBI) a reason to pause any further rate hikes. The RBI has kept the repo rate steady at 6.50% since early 2025 while dealing with persistent inflation above its 4% target. This new data shifts the focus toward the potential for rate cuts in mid-2026, which may be favorable for interest rate futures.Market Volatility And Strategy
Unexpected data like this can cause a short-term increase in market volatility. The India VIX, which has been calm at around 14, might spike in the coming weeks. This is a good opportunity for traders to explore volatility-based strategies, such as long straddles on major stocks expected to report earnings early next year. It’s essential to keep this number in perspective; a PMI of 55.7 is still strongly in the expansion zone and well above the historical average. Looking back at similar PMI dips in early 2024, the market usually consolidates for a few weeks before continuing its upward trend. Therefore, while short-term protection strategies are wise, making overly aggressive bearish bets may be premature without further signs of a slowdown. Create your live VT Markets account and start trading now.HSBC Composite PMI for India falls from 59.7 to 58.9 in December
The HSBC Composite PMI in India dropped to 58.9 in December, down from 59.7 in November. This indicates a slowdown in the country’s economic activity.
This drop may affect market sentiment and strategies, especially regarding the Indian Rupee and related financial products. Analysts will likely keep an eye on this change to evaluate its effect on future monetary policies and economic trends in India.


