GBP/JPY extended its rise for an eighth day, trading around the mid-215.00s in early European dealings on Wednesday. It remained close to the July 2008 swing high.
Concerns over instability in the Strait of Hormuz persisted, despite expectations of new US-Iran talks. Japan’s reliance on Middle East oil imports left the yen sensitive to risks tied to a US blockade of Iran’s ports and possible constraints on flows through the waterway.
Sterling support came from expectations of a more hawkish Bank of England stance. Markets were pricing a high probability of at least one, and possibly two, rate hikes this year, as higher energy prices lifted inflation forecasts.
Limits on further GBP/JPY gains were linked to a higher chance of a Bank of Japan rate rise at the April meeting, alongside intervention concerns. The daily Relative Strength Index (RSI) was nearing overbought territory, pointing to potential consolidation or a pullback.
Attention turned to a speech by Bank of England Governor Andrew Bailey later on Wednesday, ahead of UK data due on Thursday.
Looking back at the analysis from 2025, we can see the foundations being laid for the currency pair’s rally past 220.00. The concerns over the Strait of Hormuz did indeed weigh on the Yen for the latter half of that year. Those geopolitical risks have since subsided, but the economic damage is now apparent in Japan’s recent data.
Today, we see the consequences of those events, as Japan’s Q1 2026 GDP figures showed a contraction of 0.4%, with the government citing sustained high energy import costs as a key factor. While Brent crude has fallen from its 2025 highs, it remains stubbornly above $95, impacting Japan’s trade balance. This continues to create a fundamental drag on the Yen, even without an active geopolitical crisis.
On the other side of the pair, the Bank of England did follow through on the hawkish expectations from 2025, delivering two hikes that year, bringing the bank rate to 6.0%. However, the UK’s latest CPI reading for March 2026 still came in at a sticky 3.8%, well above the 2% target. This puts the BoE in a difficult position, as further hikes risk damaging a slowing economy, capping the Pound’s upside potential from here.
As was speculated in 2025, the Bank of Japan eventually hiked rates and officially exited its negative interest rate policy late last year, with the current policy rate now at 0.25%. We also witnessed two significant interventions in Q4 2025, which caused sharp, temporary drops in GBP/JPY. This threat of intervention remains a major consideration for anyone holding long positions, as the Ministry of Finance has shown it will act above the 220.00 level.
Given this backdrop, holding outright long positions in GBP/JPY is now riskier than it was in 2025. Traders should consider using derivatives to define their risk, such as buying call options to gain upside exposure with a limited downside. With volatility expected to remain high due to central bank uncertainty, strategies that benefit from a range-bound environment, like selling strangles, could also be effective if the pair consolidates around its current 222.00 level.
Written on April 15, 2026 at 9:53 am, by josephine
US actions towards restricting the Strait of Hormuz, alongside Iranian threats, are described as supporting Brent prices. The report links this to a tighter global oil balance and faster inventory draws.
After Islamabad talks broke down, the scenario outlined includes the Strait shifting into two routes. One route could face Iranian transit or toll measures, while another could be made impassable by sea mines.
A halt to Iranian crude exports is estimated to remove 1.5–2.0 mb/d from global supply. The projected supply deficit, shown through inventory draws, rises to 7.9 mb/d in April and 6.1 mb/d in May, after allowing for rerouting, SPR releases, demand destruction, and other offsets.
Market normalisation is now placed back from late April to mid-May. Global stocks are estimated to have fallen by more than 190 million barrels since the conflict began.
Global inventories are put at about 7.9 billion barrels in total. This includes roughly 6.2 billion barrels on land and about 1.7 billion barrels at sea.
With the potential shutdown of the Strait of Hormuz, we see strong support for oil prices in the coming weeks. The conflict could remove 1.5 to 2.0 million barrels per day of Iranian crude from the market. This is happening as global inventories have already been drawn down by over 190 million barrels since the conflict began.
We believe this creates a clear opportunity to establish bullish positions on crude oil. Buying call options, particularly for May and June contracts, looks like a direct way to profit from the expected price spike. This strategy capitalises on the view that market normalisation is now delayed until at least mid-May.
Recent market action already reflects this tension, with Brent crude futures surging over 12% in the last month to trade above $115 per barrel. Implied volatility in oil options has also jumped, with the CBOE Crude Oil Volatility Index (OVX) hitting levels not seen since the conflict escalation back in late 2025. This indicates the market is pricing in significant price swings, but the supply shock points to a strong upward bias.
We’ve seen this pattern before, like the drone attacks on Saudi facilities back in 2019 which caused a temporary but sharp spike in prices. Given that roughly 20% of the world’s total oil consumption passes through the Strait of Hormuz daily, any prolonged disruption will have a much larger and more sustained impact. The current situation suggests a more severe and lasting supply deficit than those previous incidents.
The sharp tightening of the market is also creating a steep backwardation in the futures curve, where near-term contracts are much more expensive than later-dated ones. Traders should consider calendar spreads to take advantage of this structure. This involves buying the front-month contract and selling a deferred contract, profiting as the supply squeeze intensifies.
Written on April 15, 2026 at 9:51 am, by josephine
WTI rose to about $89.00 in the Asian session after falling to a three-week low of $84.86, having dipped below $85.00. The move followed a US military announcement of a total blockade of the Strait of Hormuz.
WTI had dropped nearly 8% over the previous two days amid reports of renewed US-Iran contacts. President Trump said negotiations might restart within the next two days.
On charts, WTI remains in a bearish bias within a horizontal channel, with support near $84.50. The RSI is recovering from oversold levels but stays below 50, while the MACD shows an expanding negative histogram.
A break below $84.46 would point to targets near $80.00 and the March 10 low around $76.00. Resistance levels include the weekly high at $98.10, the April 5 and 7 highs around $106.50, and the March 9 high at $113.28.
WTI is a US-sourced crude benchmark traded via the Cushing hub; it is classed as light and sweet. Its price is driven by supply and demand, geopolitics, sanctions, OPEC decisions, and the US Dollar.
Weekly inventory reports from API (Tuesday) and EIA (Wednesday) can move prices. Their results are within 1% of each other 75% of the time, and EIA data is viewed as more reliable.
The sudden US blockade of the Strait of Hormuz has completely changed market dynamics, injecting massive volatility. The immediate jump to $89.00 has reversed the recent downtrend that was based on hopes of peace talks. We must now prepare for a period of extreme price swings as geopolitical tensions override typical supply and demand factors.
We need to consider that about 21 million barrels of oil, or 20% of global daily supply, pass through this strait. A full, sustained blockade would be a far more severe disruption than the temporary tanker tensions we saw back in 2019. This action could create a supply shock not seen in decades if it is not resolved quickly.
Given the uncertainty, we should focus on derivative strategies that benefit from this new high-volatility environment. Buying long straddles or strangles would allow us to profit from a large price move in either direction, whether it is a surge past $100 or a collapse if the blockade is lifted. Implied volatility on near-term WTI options has already jumped over 30% in Asian trading, signaling market anticipation of a significant event.
However, we cannot discount the possibility of a rapid de-escalation, especially with the President’s comments about talks resuming. The market’s 8% drop earlier this week shows how quickly prices can fall on any hint of a diplomatic solution. It would be wise to hedge any bullish positions with out-of-the-money puts near the $80 strike price as insurance against a sudden reversal.
While fundamentals are in control, the technical support around $84.50 remains a key level to watch. The upcoming EIA inventory report will also be critical; a significant drop in US stockpiles could easily push prices toward the weekly high of $98.10. We remember how a series of large inventory draws in the third quarter of 2025 helped sustain a rally, a pattern that could repeat now.
Written on April 15, 2026 at 9:23 am, by josephine
Brent oil fell nearly 5%, reversing all of Monday’s gains, as reports of a possible second round of US–Iran talks coincided with warnings on weakening demand. Despite the drop, Brent remains up 31% since the start of the war and up 56% year-to-date.
The IEA said the war would wipe out global oil demand growth for the first time since 2020, pointing to demand destruction. The IMF’s baseline scenario assumes a short conflict and prices returning to normal in H2 2026, with Brent averaging USD82 in 2026.
The IMF also set out an adverse scenario with oil at USD100 and weaker global growth if the conflict continues. The article notes it was produced using an AI tool and checked by an editor.
We recall seeing this dynamic back in 2025, when hopes for negotiations caused Brent to drop sharply, only to reverse. Today, with prices hovering around $88 per barrel, the market remains well above the International Monetary Fund’s old baseline forecast of $82 for 2026. This indicates that geopolitical risk is still firmly priced in, outweighing the optimism from last year.
The warnings of demand destruction we heard from the International Energy Agency are now a key factor limiting further price gains. We see this in recent economic figures, with the latest global manufacturing PMI for March 2026 showing only marginal expansion. This creates a difficult tug-of-war, as fears of a slowdown are capping the upside potential from supply disruptions.
Those negotiation hopes have since faded, and our focus has shifted to the supply discipline shown by producers. OPEC+ has maintained its production cuts through the current quarter, effectively putting a floor under the market around the mid-$80s. Recent U.S. Energy Information Administration (EIA) data showing a crude inventory draw of 2.1 million barrels last week reinforces this tight supply picture.
For traders, this suggests a range-bound market defined by a supply floor and a demand ceiling in the coming weeks. Betting on a major breakout in either direction is risky; therefore, selling volatility could be a viable strategy. We might consider options strategies like iron condors to profit from prices remaining within a predictable range.
Looking ahead, we must watch for any signs that this balance is shifting. Pay close attention to weekly U.S. inventory data for surprises that could challenge the supply narrative. Any shift in language from central banks regarding economic growth forecasts will also be critical for determining the direction of demand.
Written on April 15, 2026 at 9:21 am, by josephine
USD/CHF traded flat near 0.7812 in late Asian trading on Wednesday. It remained close to its monthly low of 0.7790 set the previous day, with scope for more downside below 0.7800.
The US Dollar underperformed against peers amid optimism that the US and Iran could agree a permanent ceasefire soon. The US Dollar Index (DXY) edged up to about 98.15 but stayed near its almost seven-week low of 98.00.
US President Donald Trump told Fox Business that the conflict with Iran was “very close” to ending. He also told The New York Post on Tuesday that negotiations could resume in Pakistan within the next two days.
US Vice President JD Vance said talks with Iran were taking place through channels including Pakistan and would continue. He said both sides were working towards a deal.
Market pricing no longer includes Federal Reserve interest rate hikes this year. This compares with expectations for two hikes in March after the war started.
Looking back at the sentiment in 2025, we saw a strong case for USD/CHF downside based on hopes for a US-Iran ceasefire. That optimism drove expectations for a weaker dollar and shifted views on Federal Reserve policy. The focus was on the pair breaking below the 0.7800 level.
The situation today, in April 2026, has completely reversed course. The most significant development has been the Swiss National Bank (SNB) unexpectedly cutting its key interest rate to 1.50% in March, making it the first major central bank to ease policy. This policy divergence now strongly favors the US dollar over the Swiss franc.
Instead of testing lows, the USD/CHF is currently trading firmly above 0.9100, a level not seen in many months. US inflation data has also remained persistent, with the latest Consumer Price Index (CPI) figures staying above the 3% mark. This stickiness makes the Federal Reserve hesitant to cut rates as quickly as the market once expected.
The geopolitical risk premium, which was expected to fade in 2025, has returned due to ongoing conflicts and shipping disruptions in the Middle East. This has renewed some safe-haven demand for the US dollar, contrary to the previous year’s expectations. One-month implied volatility in USD/CHF has fallen below 7%, suggesting the market may be underpricing the risk of a further move higher.
Given this, traders should consider positioning for further USD/CHF strength, as the fundamental picture has changed entirely from last year. Fading any moves below 0.9000 seems like a viable strategy. Using options to construct bullish call spreads, such as buying the 0.9200 call and selling the 0.9400 call for the coming weeks, could offer a defined-risk way to profit from continued upside momentum.
Written on April 15, 2026 at 8:56 am, by josephine
GBP/USD ended a seven-day rise and traded near 1.3560 in Asian hours on Wednesday. It fell as the US Dollar edged up, despite lower safe-haven demand linked to hopes of diplomacy in the Middle East.
Reports said the US and Iran were preparing for a second round of talks ahead of a two-week ceasefire deadline. At the same time, tensions in the Strait of Hormuz continued, adding to global energy risk.
US President Donald Trump said negotiations could restart this week and opposed a 20-year pause in Iran’s nuclear enrichment. US Vice President JD Vance said there was progress in the first round of Iran talks in Pakistan, with further talks possibly within days.
On Tuesday, GBP/USD traded near 1.3590 and was up 0.61%. The move came as markets focused on a possible US-Iran deal and the US Dollar weakened after US inflation data missed expectations for a higher reading.
A US senior official told Fox News that a deal had many of the ingredients but was not complete. Reports also said renewed talks could begin as soon as this week.
The focus for us right now is the fragile optimism surrounding the US-Iran diplomatic talks. While hopes for a deal are lifting the Pound against the Dollar, the pair’s failure to hold its gains shows just how nervous the market is. This points to high volatility in the coming weeks, where headline risk could trigger significant price swings.
We must consider the severe downside risk if these negotiations falter. A sudden collapse in talks could spark a rush into the safe-haven US Dollar, similar to the surge we saw in the Dollar Index when the Ukraine conflict began back in February 2022. Such a move could quickly push GBP/USD back down, erasing all of its recent progress.
The softer US producer price data is a key factor weighing on the Dollar, hinting that inflation might be cooling. This is a notable shift from the persistent inflation we dealt with through 2024, when UK CPI was running at 3.4% and the US was at 3.2%, keeping central banks on edge. If this trend of weaker US data continues, it will build a stronger case for a weaker dollar long-term.
Given the binary nature of the geopolitical outcome, derivative traders should look at strategies that benefit from a large move, regardless of direction. Buying a GBP/USD options straddle, for example, would allow a trader to profit from a spike in volatility if a deal is announced or if talks completely break down. This is a direct play on the uncertainty itself.
For those expecting a positive resolution, selling out-of-the-money put options is a way to generate income, but this carries significant risk. We have to be mindful that the current exchange rate near 1.3560 is at a multi-year high, far above the 1.2500 level it struggled to maintain throughout much of last year. This elevated position makes the pair particularly vulnerable to a sharp sell-off on any bad news.
Written on April 15, 2026 at 8:54 am, by josephine
The US Dollar Index (DXY), which tracks the US Dollar against six major currencies, ended a seven-day fall and traded near 98.20 in Asian trading on Wednesday.
The dollar faced pressure as demand for safe-haven assets eased on hopes of diplomacy in the Middle East. The US and Iran were reported to be preparing a second round of peace talks before a two-week ceasefire ends, while tensions in the Strait of Hormuz continued to raise energy risk.
Drivers Behind The Dollar Move
US President Donald Trump said talks could restart this week and disagreed with a 20-year pause in Iran’s nuclear enrichment. Vice President JD Vance said there had been progress in the first round of talks in Pakistan, with further discussions possibly within days.
The dollar also weakened after US Producer Price Index (PPI) data suggested softer inflation pressure. Headline PPI rose 0.5% month-on-month versus a 1.2% forecast, while core PPI rose 0.1% versus 0.6%.
On a yearly basis, PPI rose 4% in March versus 4.6% expected, up from 3.4% in February. Core PPI was 3.8% year-on-year, unchanged from the previous month.
The US Dollar Index is currently showing signs of weakness as it struggles to hold the 104.00 level, and we see potential for further downside in the weeks ahead. This situation is reminiscent of the market environment in the spring of 2025, when easing inflation pressures and hopes for a diplomatic solution to Middle East tensions combined to weigh on the dollar. We recall that a similar setup preceded a period of dollar underperformance.
This bearish view is reinforced by the latest economic data from March 2026, which showed the annual Consumer Price Index (CPI) falling to 2.8%, its lowest point in over a year. Consequently, Fed funds futures are now pricing in less than a 20% chance of an interest rate hike by this summer, removing a key catalyst for dollar strength. We should prepare for a period where currencies with more aggressive central bank policies outperform the dollar.
Potential Trading Approaches
Much like the US-Iran peace talks in 2025 dampened the dollar’s safe-haven appeal, the recent progress in US-China trade normalization talks is having a similar effect on market sentiment today. As global risk appetite improves, capital tends to flow out of haven assets like the dollar. This backdrop suggests the dollar’s path of least resistance is lower.
In response, we believe traders should consider buying put options on dollar-tracking ETFs, such as the Invesco DB USD Bullish Fund (UUP), to capitalize on a potential decline with defined risk. Alternatively, purchasing call options on the EUR/USD currency pair is a direct way to position for a weakening dollar. Historically, the EUR/USD has shown a strong inverse correlation to the DXY, rallying over 4% in the three months following a similar setup in 2025.
Given that implied volatility in the currency markets has receded slightly, selling out-of-the-money call spreads on the DXY could also be an effective strategy. This approach allows us to profit if the dollar moves down, sideways, or even slightly up, benefiting from time decay. This tactic is particularly suitable if we anticipate a gradual grind lower rather than a sharp drop.
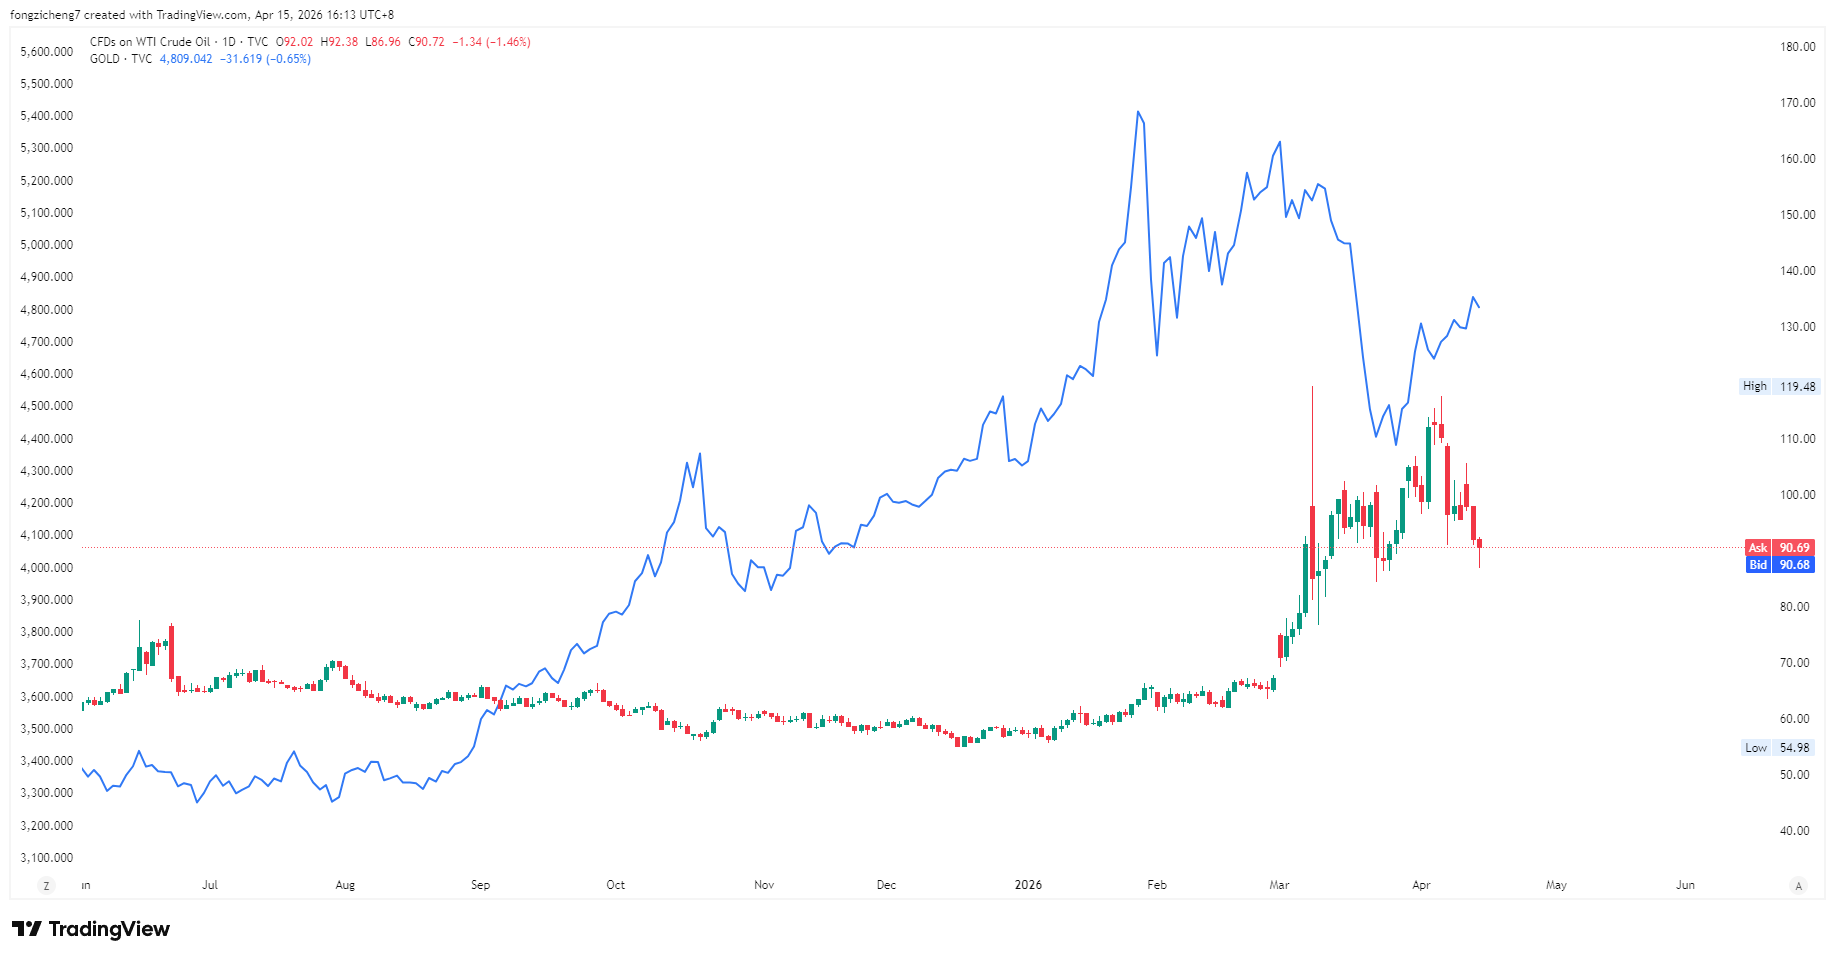
While gold has traditionally dominated the safe-haven narrative, oil is increasingly emerging as the market’s most direct and influential inflation-linked asset. Unlike gold, which reacts to fear and uncertainty, oil sits at the core of the real economy. It doesn’t just reflect inflation—it helps create it.
Bob Michele, global head of fixed income at JPMorgan Asset Management, sees a path to markets turning optimistic and putting the Iran war “in the distant rearview mirror” over the next month, even if oil remains at $100 per barrel https://t.co/TBPGh98hfApic.twitter.com/KdzEWtCoCv
In today’s environment of geopolitical tension, unstable energy supply, and unpredictable central bank policy, oil has evolved beyond a simple commodity. It has become a real-time barometer of inflation and a strategic tool for navigating it.
How Do Oil Prices Drive Global Inflation?
Oil is the backbone of global economic activity. From manufacturing to transportation, its influence runs through nearly every layer of the economy.
🔊 War-driven oil prices pushed US inflation to its biggest jump in nearly four years. On today’s Reuters World News, what rising fuel costs mean for consumers. Listen here: https://t.co/mcVzPGNde1pic.twitter.com/5SWqQEZ3DQ
Transportation becomes more expensive across land, sea, and air
Production costs rise for factories and energy-intensive industries
This creates a cascading effect. Higher transportation and production costs feed directly into consumer prices, pushing inflation higher across the board.
In simple terms: When oil goes up, almost everything else follows.
Empirical data support this relationship. A 10% rise in oil prices can add roughly 0.3%–0.5% to inflation in advanced economies, with an even stronger impact on emerging markets that rely heavily on energy imports.
The inflation surge between 2021 and 2023 offered a clear example. Energy costs were a major driver behind the highest inflation levels seen in decades across the US and Europe.
The Dollar, Commodities, and the Inflation Loop
Oil’s role as an inflation hedge becomes even more powerful when viewed through the lens of the US dollar.
Because oil is priced globally in dollars, a weaker dollar makes oil cheaper for foreign buyers, increasing demand and pushing prices higher. At the same time, rising inflation erodes the dollar’s purchasing power, reinforcing this upward pressure.
Exxon Mobil saw 6% of its global output knocked out in the first quarter as oil and natural gas operations in the Persian Gulf were paralyzed by the Iran war.
In this cycle, oil transforms into more than just an energy asset — it becomes a store of real value. Unlike fiat currencies, oil is a tangible, demand-driven resource with intrinsic economic importance.
Oil vs Gold: Two Very Different Hedges
Both oil and gold are considered hedges, but they respond to completely different market conditions.
Feature
Gold (Safe-Haven)
Oil (Inflation Hedge)
Primary Driver
Fear, crisis, and instability
Economic growth and rising costs
Market Condition
Loss of confidence in the system
Strong demand or supply shocks
Economic Role
Store of value/Safe haven
Core driver of production/transport
Reference: Blue: Gold Candlesticks: US Oil
The New Layer: Energy-Driven Tech Inflation
A major shift in today’s inflation landscape is the growing link between energy and technology.
Data centres are massive energy consumers. As demand for digital infrastructure grows, so does energy dependence, much of which still comes from fossil fuels.
Electricity demand is set to jump about 25% after years of stagnating as AI, data centers and electrification strain a grid built for slower times. We look at America's increasing energy demand on "Wall Street Week," tonight at 6 p.m. ET https://t.co/dqHFPt2BXKpic.twitter.com/e0Mfv8xNem
The cost of technology is now tied to the cost of energy.
When energy prices rise, operating costs for data centres increase, feeding into higher costs for businesses and, ultimately, consumers. What was once seen as a deflationary sector is now contributing to inflation through energy demand.
Land, power and supply chains are the chokeholds holding back AI data centers, according to Flexential CEO Ryan Mallory. "You're not just planning for '26 right now. You're planning for '28-'30" https://t.co/V4OUXaXzcYpic.twitter.com/wImhi0FPeb
This structural shift makes oil even more relevant in modern inflation dynamics.
Oil as a Trading Instrument
For traders, oil offers something unique: direct exposure to inflation expectations in real time.
Trading crude, whether Brent or WTI, is no longer just about supply and demand. It reflects:
Inflation expectations
Central bank policy outlook
Currency strength (especially the US dollar)
In this sense, trading oil is effectively trading the market’s view on future price pressures.
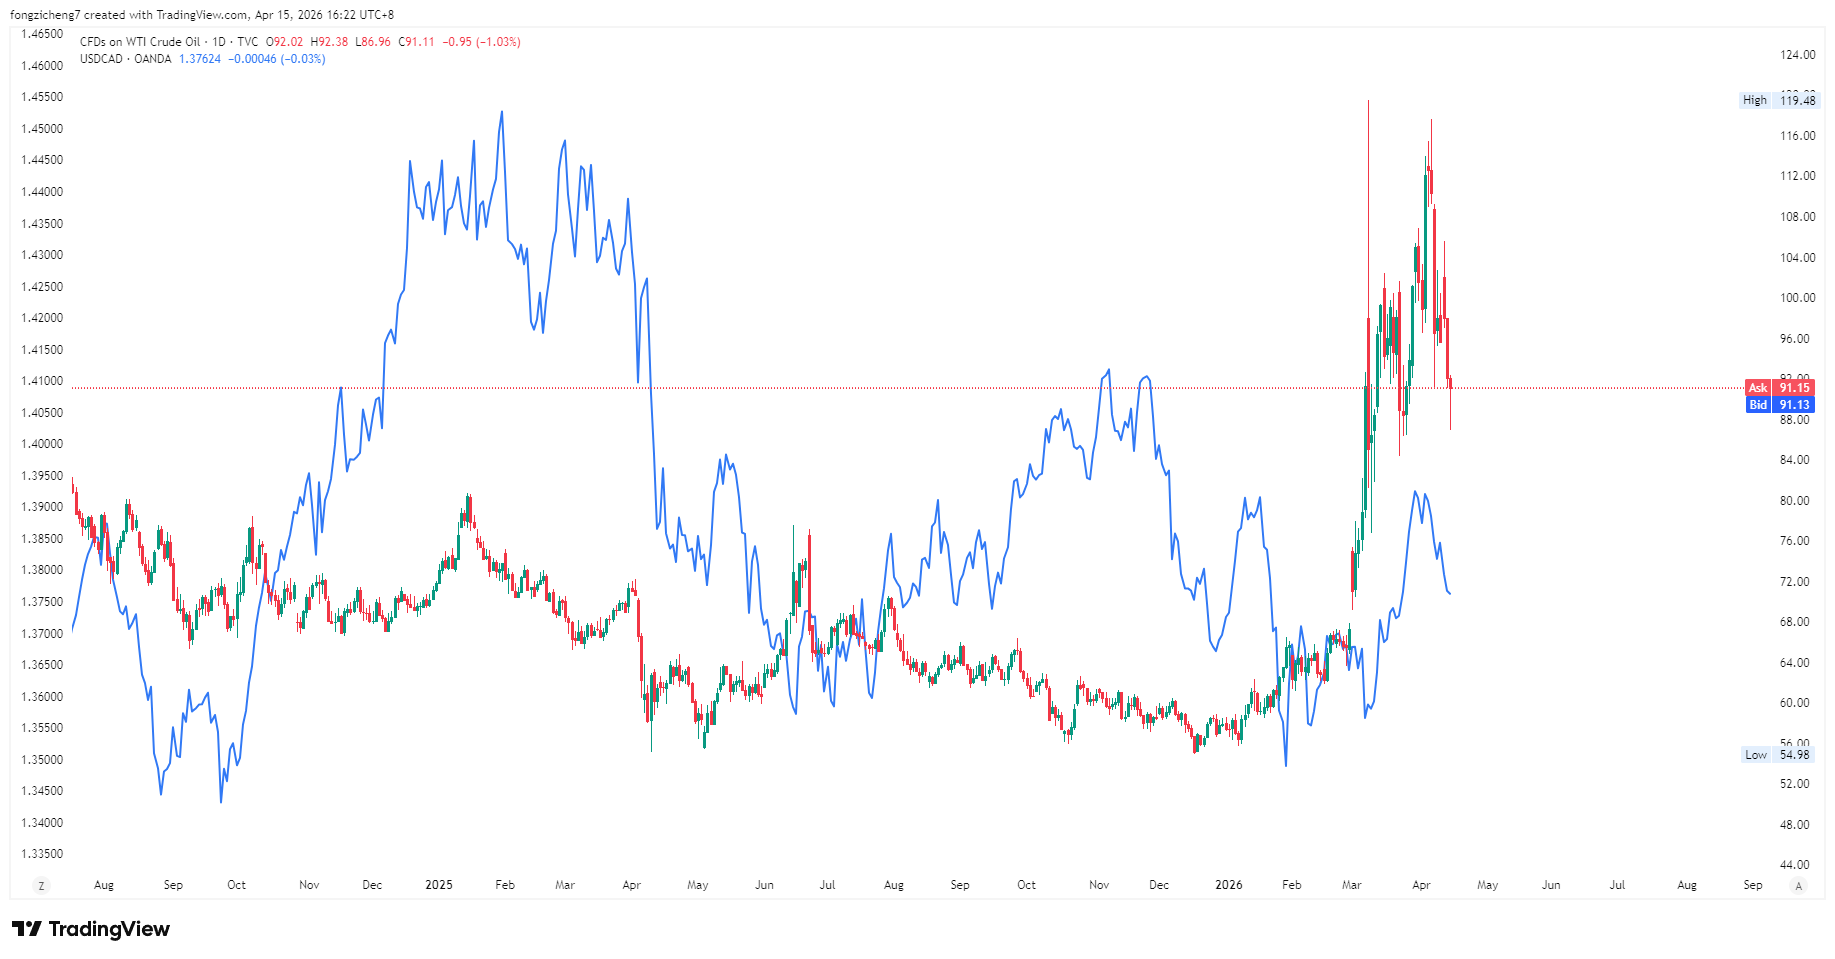
One of the clearest cross-market relationships appears in USD/CAD. As a major oil exporter, Canada benefits from rising oil prices, which strengthen the Canadian dollar. At the same time, inflation dynamics can pressure the US dollar.
The result: Rising oil often leads to a falling USD/CAD.
Reference: Blue: USD/CAD Candlesticks: US Oil
This makes commodity currencies a powerful extension of the oil-inflation trade.
The Limits of Oil as a Hedge
Despite its strengths, oil is not a perfect hedge.
At extreme price levels, oil can shift from being an inflation driver to a growth killer. When energy costs rise too far, they begin to suppress demand, slow economic activity, and eventually trigger recessionary pressures.
At that point:
Demand falls
Oil prices decline
The inflation narrative breaks down
This is why oil cycles are often sharp and self-correcting.
Additionally, aggressive interest rate hikes can disrupt the relationship. Higher rates strengthen the US dollar, making oil more expensive globally and reducing demand even if inflation remains elevated.
This creates periods where:
Inflation stays high, but oil prices fall.
The Bottom Line
Oil sits at the centre of the inflation story and continues to drive it.
It reflects real economic activity, feeds directly into costs across industries, and responds quickly to shifts in supply, demand, and policy. Unlike traditional hedges, oil moves with the broader macro landscape, linking geopolitics, growth expectations, and market pricing in real time.
At the same time, it introduces volatility. Its cyclical nature and sensitivity to policy shifts mean it does not just signal inflation trends; it actively shapes them.
That is why traders and investors can no longer treat oil as optional. They need to track it closely to understand how inflation evolves and how markets react.
In today’s environment, if you understand oil, you understand inflation.
The Big Questions
1) How does oil act as a direct driver of inflation?
Oil is the backbone of global economic activity, feeding directly into production, transportation, and everyday goods. When prices rise, fuel costs for gasoline, diesel, and aviation fuel increase immediately. These higher costs create a cascading effect where transportation and manufacturing expenses are passed on to consumers, pushing prices higher across the entire economy.
2) Why is oil considered a better inflation hedge than gold?
While both are hedges, they respond to different market drivers. Gold is primarily a hedge against fear, performing best during financial instability or a loss of confidence in the system. In contrast, oil is a hedge against growth and rising costs. Because oil sits at the core of the real economy and helps create inflation rather than just reflecting it, it is often a more direct and influential asset for navigating rising prices.
3) What is the relationship between the US dollar and oil prices?
There is a powerful feedback loop between the two. Since oil is priced globally in US dollars, a weaker dollar makes oil cheaper for foreign buyers, which increases demand and lifts prices. Simultaneously, rising inflation erodes the dollar’s purchasing power, reinforcing the upward pressure on oil. This cycle transforms oil into a store of real value during periods of currency devaluation
4) How do energy prices impact technology and AI sectors?
Modern digital infrastructure, including cloud computing and AI data centres, is a massive energy consumer. This has created a new reality where the cost of technology is now tied to the cost of energy. When energy prices rise, operating costs for these data centres increase, feeding into higher costs for businesses and consumers. This shift means that technology, once seen as deflationary, can now contribute to inflation through energy demand.
5) Can oil prices actually cause a recession?
Yes. While oil is an inflation driver, it is also cyclical and self-correcting. If prices reach extreme levels, they begin to suppress demand and slow economic activity. At this point, the growth killer effect takes over, high costs trigger recessionary pressures, demand falls, and oil prices eventually decline, breaking the inflation narrative.
6) How does oil influence the USD/CAD currency pair?
One of the clearest market relationships exists in USD/CAD because Canada is a major oil exporter. Rising oil prices typically strengthen the Canadian dollar. When combined with inflation dynamics that may pressure the US dollar, rising oil often leads to a falling USD/CAD exchange rate.
Start trading now – Click here to create your real VT Markets account
NZD/USD moved in a tight range near 0.5900 in Asian trading on Wednesday, after rising over the past two days. It stayed close to a more than one-month high reached on Tuesday.
The US dollar rose slightly from its lowest level since early March, linked to instability in the Strait of Hormuz. Iran’s UN ambassador said the US blockade that began on Monday breached Tehran’s sovereignty, and the IRGC said it would retaliate.
Markets also focused on the chance that US-Iran peace talks could restart. US Vice President JD Vance said negotiations were ongoing, with Washington seeking a broader agreement on Iran’s economic ties with the world.
Expectations for a US Federal Reserve rate rise weakened, limiting the dollar’s bounce and supporting NZD/USD. US data on Tuesday showed the Producer Price Index rose less than expected in March.
Lower US Treasury yields and a positive risk tone reduced demand for the safe-haven dollar. This supported the NZD/USD pair’s upward bias.
Looking back to this time in April 2025, we saw the NZD/USD struggling around the 0.5900 level despite some upward momentum. The market was caught between optimism over US-Iran diplomacy and the reality of geopolitical risk in the Strait of Hormuz, which was keeping the US dollar supported. This created a tense balance for the pair.
The view that the US dollar would weaken was supported by inflation data at the time. We saw the US Producer Price Index for March 2025 come in softer than expected, mirroring the 0.5% month-over-month drop we saw in March 2023. This eased fears about aggressive Federal Reserve rate hikes and caused a temporary dip in US Treasury yields, helping the Kiwi dollar.
However, we must remember that the market’s hope for a less aggressive Fed was often premature during that period. For instance, after the soft inflation prints in early 2023, the Fed proceeded with rate hikes in both March and May of that year. This historical pattern suggests that any USD weakness should be viewed with caution, as underlying policy was still tight.
For derivative traders today, this highlights the risk of volatility driven by central bank policy surprises. The uncertainty surrounding the Fed’s path and the geopolitical situation a year ago meant that implied volatility was a key metric to watch. Strategies that profit from price swings, such as buying straddles or strangles, would have been more prudent than taking a simple directional bet.
We also have to consider the actions of New Zealand’s own central bank. Around that same time, we saw the Reserve Bank of New Zealand deliver surprisingly aggressive rate hikes, such as the unexpected 50-basis-point hike in April 2023. This reminds us that the NZD/USD is a two-sided story, and strength in the Kiwi can come from domestic policy as much as from US dollar weakness.
Given this context, traders should be prepared for the NZD/USD to remain sensitive to shifts in interest rate differentials. A simple bet on the Kiwi rising may be risky, so using options to define risk is a sensible approach. Consider buying NZD/USD put options as a hedge against any renewed US dollar strength if inflation proves more stubborn than anticipated.
Written on April 15, 2026 at 7:55 am, by josephine
GBP/USD ended a seven-day rise and traded near 1.3560 in Asian trading on Wednesday. It fell as the US Dollar edged up, while safe-haven demand stayed weak due to stronger market optimism linked to possible Middle East diplomacy.
The US and Iran were reported to be preparing for a second round of peace talks before a two-week ceasefire deadline. Tensions in the Strait of Hormuz continued, adding to global energy risks, and President Donald Trump said talks could restart this week while rejecting a 20-year pause in Iran’s nuclear enrichment.
US inflation data eased after the Producer Price Index rose 0.5% month-on-month, below the 1.2% consensus. Core PPI was 0.1% month-on-month versus 0.6% expected, while PPI was 4% year-on-year in March against a 4.6% forecast and up from 3.4% in February.
Core PPI was unchanged at 3.8% year-on-year. In the UK, the 10-year gilt yield fell towards 4.7% as oil prices dropped on expectations of renewed US-Iran talks, while markets priced in nearly two Bank of England rate rises by late 2026.
Demand for UK bonds remained strong, with a 10-year gilt syndication drawing record bids of £148 billion.
We remember the pause in the pound’s rally around 1.3560 back in 2025, which was driven by shifting geopolitical hopes. Today, with GBP/USD struggling to hold the 1.2850 level, the fundamental picture is far weaker. This suggests options strategies that profit from downside risk, such as buying puts on the pound, could be more effective than waiting for a return to last year’s highs.
Those US-Iran diplomatic efforts we saw in 2025 ultimately proved fragile, offering only a short-term dip in energy prices. Now, with Brent crude futures again pushing past $95 a barrel amid renewed shipping security concerns in the Strait of Hormuz, we see an underpriced risk of a supply shock. Long-dated call options on energy ETFs or crude futures could be a sensible hedge against a sudden price spike in the coming months.
The soft 4% annual Producer Price Index reading from March 2025 fueled hopes of Federal Reserve rate cuts that never fully materialized. With US core inflation proving stubborn throughout the past year and now holding at 3.5%, the “higher for longer” interest rate environment is the reality. This makes selling Fed Funds futures for late 2026 expiry a compelling trade, betting against market expectations of significant easing.
Looking back at 2025, the market was pricing in future Bank of England rate hikes when the 10-year gilt yield was near 4.7%. Now that the Bank has delivered one of those hikes and UK inflation has moderated to 3.2%, that cycle is over. The record demand for gilts has persisted, suggesting that positioning for a policy pivot through interest rate swaps, specifically paying a floating rate to receive a fixed rate, is an attractive strategy.
Written on April 15, 2026 at 7:52 am, by josephine