EUR/JPY pair rises for the fourth straight day, hitting levels not seen since August 1992
The EUR/JPY has steadily risen and is now at the highest level since August 1992. Currently, it trades just under 179.00, with a daily gain of about 0.25%.
A key reason for this rise is the uncertainty surrounding the Bank of Japan’s (BoJ) monetary policy. The BoJ’s approach differs from the pro-stimulus policies that Japan’s Prime Minister supports.
Gold Climbs On The Back Of Rate Cut Odds
Gold prices surged past $4,130 per ounce on Wednesday, marking a fourth straight session of gains, as growing market confidence pointed to the likelihood of the Federal Reserve resuming monetary easing in December.
Fresh US labour data revealed that private companies shed around 11,250 jobs per week over the four weeks ending 25 October, reinforcing signs of a cooling jobs market and strengthening expectations for further interest rate cuts.
The renewed dovish outlook comes as the US government moves to end its longest-ever shutdown, reducing short-term uncertainty while keeping attention firmly on the broader slowdown in employment growth and consumer activity.
Fed Policy Expectations Fuel Demand
Markets are now pricing in roughly a 68% chance of a 25-basis-point rate cut at the Fed’s upcoming meeting. The combination of weaker labour figures and ongoing fiscal instability has reignited demand for gold as a hedge against policy risk.
While a government reopening could briefly dampen safe-haven flows, expectations of looser financial conditions continue to support bullion. Analysts highlight that falling US bond yields and a softer dollar remain key pillars behind gold’s strong rally this year—its best annual performance since 1979.
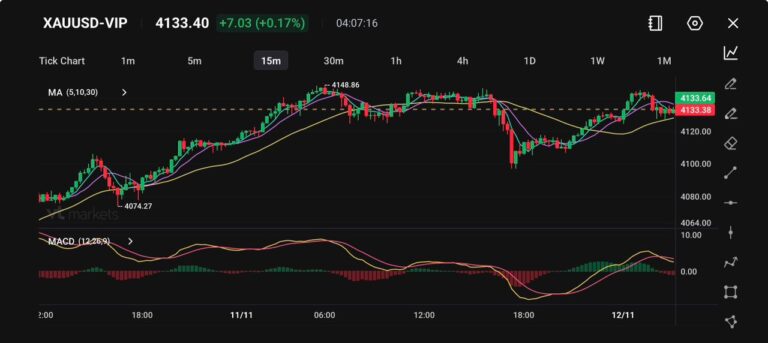
Technical Overview
Gold is currently hovering around $4,133, consolidating after bouncing from an intraday low near $4,074. On the 15-minute chart, price action shows short-term sideways movement following a sharp rally that briefly tested resistance at $4,148. Moving averages (5, 10, and 30) are flattening, suggesting momentum is cooling.
The MACD indicator has turned slightly lower but remains close to the signal line, implying that recent moves are more consistent with light profit-taking rather than the start of a deeper correction.
If gold holds above $4,120, buyers could attempt another push toward $4,150–$4,160 in the short term. However, a drop below $4,100 would likely signal fading bullish momentum and invite a deeper retracement toward $4,070. Overall, sentiment remains cautiously bullish, with traders watching upcoming US CPI data for clues on whether the Fed’s easing path will accelerate.
Outlook: Cautiously Bullish
The broader trend for gold remains constructive, supported by expectations of further monetary loosening. Should upcoming data continue to reveal weakness in employment and consumer spending, prices could extend toward $4,160–$4,180 in the short term.
Conversely, if the official reopening of the US government triggers a brief rebound in the US dollar or Treasury yields, gold may enter a temporary consolidation phase between $4,080–$4,120 before resuming its upward path.
Dividend Adjustment Notice – Nov 12 ,2025
Dear Client,
Please note that the dividends of the following products will be adjusted accordingly. Index dividends will be executed separately through a balance statement directly to your trading account, and the comment will be in the following format “Div & Product Name & Net Volume”.
Please refer to the table below for more details:
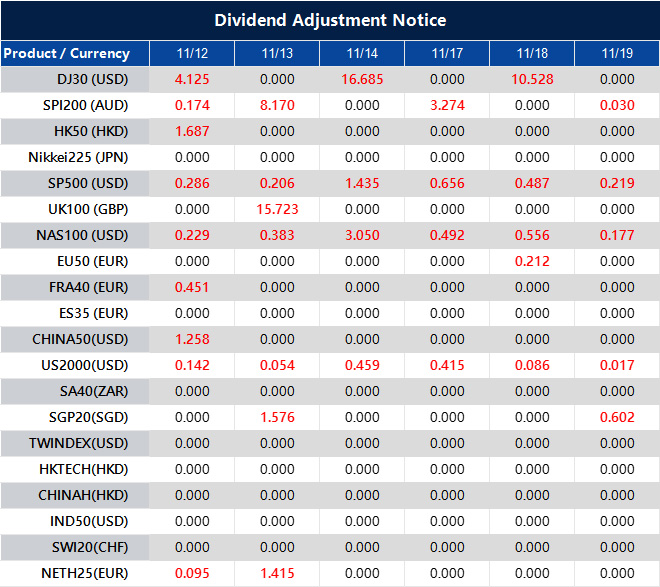
The above data is for reference only, please refer to the MT4/MT5 software for specific data.
If you’d like more information, please don’t hesitate to contact [email protected].
The renewed strength of the US dollar drives silver prices below $51.10.
Silver prices have fallen to about $51.10 as the US Dollar gains strength during European trading hours. Economic uncertainty in the US is boosting hopes for a potential Federal Reserve rate cut soon.
The US Dollar Index, which compares the dollar’s value to six major currencies, is doing well at around 99.55. This is partly because of optimism about ending the US government shutdown, which affects the price of silver in US dollars.
On Monday, the Senate passed a temporary funding measure for the government with a 60-40 vote, set to last until January 30. The House is expected to approve this quickly, and if it goes through, the US President will sign it into law.
Market watchers expect a lot of economic data to come out once the government reopens. There is growing speculation that this data could lead the Federal Reserve to cut interest rates in December. According to the CME FedWatch tool, there’s currently a 68% chance of a 25 basis point rate cut. Lower interest rates could make non-yielding assets like silver more attractive.
Silver serves two main purposes: as a store of value and for industrial use. Its price is influenced by various factors such as geopolitical events and movements in the US Dollar. The demand from both industries and investors, as well as changes in gold prices, also play significant roles in determining silver’s market value.
After a five-day rally, silver has pulled back to around $51.10 due to a stronger US Dollar Index at 99.55. This short-term pressure on silver presents a mixed picture for traders. The immediate response might involve taking profits from long positions or starting small short positions.
The main conflict in the market is between the strong dollar and the rising expectation of a Federal Reserve rate cut. With the CME FedWatch tool indicating a 68% chance of a rate reduction in December, the justification for holding non-yielding assets like silver remains strong. Derivative traders should be cautious about the current dollar-driven weakness, as it might be temporary if the Fed indicates a shift in policy.
Adding to the case for a rate cut, the recent October 2025 Consumer Price Index (CPI) report showed inflation cooling to 2.9%, which is lower than expected. This data supports the idea that the Fed might ease monetary policy, boding well for silver. This implies that buying call options or setting up bull call spreads during significant price declines could be a smart way to position for a possible rally as the year concludes.
We anticipate significant volatility as the government reopens, unleashing a backlog of important economic data. This surge of information could lead to sharp and unpredictable price changes in the coming weeks. Traders might consider strategies like long straddles or strangles to take advantage of potential volatility increases, regardless of the direction.
It’s important to note that the current price around $51 is historically significant, reminiscent of peaks seen in 1980 and 2011. If it fails to break above this long-standing resistance, we could see a sharp price reversal. Using protective put options to hedge long futures positions would be a wise strategy to manage downside risk at this crucial moment.
The strong and rising industrial demand for silver, especially from the solar and electric vehicle sectors, is also key to its price. The Silver Institute reported earlier in 2025 that demand from photovoltaics is expected to use over 20% of the total silver supply this year. This solid fundamental backdrop supports prices, suggesting that any significant pullbacks driven by monetary policy issues could present long-term buying opportunities.
Traders expect the Bank of England to lower interest rates in December, causing GBP/USD to drop below 1.3150.
The US Senate has approved a bill to stop the government shutdown, but it still needs to be passed by the House and signed by President Trump. Additionally, weaker employment data from ADP supports the expectation of a Federal Reserve interest rate cut, which may affect the US Dollar.
Pound Sterling
The Pound Sterling is the official currency of the UK and ranks as the fourth most traded currency in the world. The value of GBP is mainly influenced by the Bank of England’s (BoE) monetary policy, which focuses on inflation targets. Economic data, including GDP and employment statistics, also affects the direction of Sterling. The Trade Balance data is crucial for the Pound Sterling. A positive balance increases demand for exports and raises the currency’s value. In contrast, a negative balance can weaken GBP, as it suggests more money is being spent on imports. As of November 12, 2025, the Pound Sterling is weakening due to widespread forecasts that the Bank of England will lower interest rates next month. Major banks expect a 25-basis-point cut, reducing the rate to 3.75%. This market consensus is putting downward pressure on the GBP/USD pair. However, we must also consider mixed signals coming from the BoE, which may create opportunities for traders looking for volatility. While many anticipate a rate cut, recent data shows UK wage growth at 5.7%, and inflation in October 2025 was a stubborn 3.1%, well above the 2% target. This suggests that the monetary policy may not be tight enough. If the Bank of England does not cut rates in December as expected, the pound could rally sharply.US Dollar Challenges
The US Dollar is facing its own challenges. Budget deadlines in December could lead to a government shutdown, similar to past political standoffs. A last-minute agreement could give the dollar a short-term boost, while a failure to secure funding would likely weaken it. At the same time, the Federal Reserve is expected to loosen its monetary policy, which limits the potential gains for the US Dollar. After a weaker jobs report in early November 2025, the CME FedWatch Tool shows a 75% chance of a Fed rate cut in December. This dovish outlook indicates that any strength the dollar gains from political agreements may only be temporary. Create your live VT Markets account and start trading now.Gold stays near a three-week high during the Asian session, with bulls targeting resistance levels.
Gold prices fell on Wednesday as market sentiment shifted and demand for the US Dollar rose. This change came as the US government showed signs of reopening, leading investors to seek riskier assets rather than safe-havens like gold.
A slight rise in the US Dollar also added pressure on gold. However, worries about a long-term government shutdown and its economic effects may prevent further dollar gains, which could help stabilize gold prices. Traders are likely to hold off on selling heavily until they hear from important Federal Reserve officials about potential rate cuts.
Effects of US Government Reopening
The reopening of the US government has brought more focus to financial issues. Economists predict that GDP could drop by 1.5-2.0% due to the shutdown. Recent reports show job losses in October and higher unemployment, increasing the chances of a Federal Reserve rate cut. This led to a drop in the US Dollar, allowing gold prices to briefly rise above $4,100, despite overall market optimism. In terms of technical analysis, gold is facing resistance at $4,150-4,155. If it surpasses $4,200, there could be a recovery. Support is seen around $4,100-4,075. If prices fall below these levels, more selling could happen, bringing prices down to $3,900, which would challenge bullish sentiment. Today, November 12th, 2025, gold is retreating due to a stronger dollar and positive sentiment in the stock market. However, this decline might be temporary as signs of an economic slowdown emerge. The latest Consumer Price Index (CPI) report for October indicated that inflation eased to 3.1%, below expectations, and strengthens the case for future rate cuts by the Federal Reserve.Fed Rate Cut Expectations
The lower inflation rate, along with the recent jobs report showing nonfarm payrolls grew by only 150,000, supports our belief that the Fed’s tightening cycle is over. According to the CME FedWatch tool, there’s now over a 70% chance of a rate cut by the end of the first quarter of 2026. This situation is expected to continue providing support for non-yielding gold in the coming weeks. For traders, this environment suggests that buying during dips may be a smart strategy, especially using options to manage risk. We remember the market’s volatility during the US government reopening when gold faced challenges around $4,155, while $4,100 acted as support. Options to consider could include buying calls with strikes near $4,200 or selling put spreads below $4,100 to prepare for a potential price increase while controlling downside risk. We need to stay alert for upcoming economic data and comments from Fed officials, as these factors will heavily influence volatility. The swift correction from last October’s all-time high reminds us how quickly market sentiment can change. Therefore, using derivatives can help in taking advantage of potential gains while clearly setting limits on risk for each trade. Create your live VT Markets account and start trading now.The euro trades near 1.1580, supported by ECB caution and possible Fed easing measures.
The EUR/USD is stable, trading at around 1.1580, after experiencing five days of gains. This stability is due to expectations that the ECB will keep interest rates unchanged, supported by a steady economy and inflation close to target levels.
Upcoming German inflation data may impact the ECB’s policy decisions, with October’s CPI and HICP figures under close observation. At the same time, the USD remains strong as the U.S. government works toward reopening after the Senate passed a bill pending the President’s signature.
Impact Of Employment Data
Even so, the Greenback is under pressure from weak ADP employment data, hinting at possible policy easing. Private employers reduced an average of 11,250 jobs per week in the four weeks ending October 25. The market now predicts a 68% chance of a 25-basis-point rate cut in December. The Euro, used by 20 EU countries, is the second most traded currency globally, making up 31% of foreign exchange transactions. The ECB, based in Frankfurt, oversees Eurozone monetary policy, focusing on price stability through interest rates. Economic data and inflation in the Eurozone significantly affect the Euro’s value, with robust economies and positive trade balances strengthening the currency. Today, on November 12, 2025, the situation looks very different from the late 2010s analysis. Back then, EUR/USD was near 1.1600 with expectations of Fed rate cuts. Now, the pair struggles around 1.0750. The driving force is not Fed easing anymore but a major policy gap between a cautious Fed and a more dovish ECB. The ECB is hinting at a possible shift toward rate cuts as inflation decreases across the Eurozone. The latest German HICP data for October 2025 showed a decrease to 2.4%, continuing a steady decline from the highs seen in 2023. This reinforces the notion that the ECB, with a main rate at 3.5%, may need to act sooner than the U.S. to support a slow economy.US Monetary Policy
In contrast, the U.S. Federal Reserve is taking a cautious approach, keeping its key interest rate at 4.75% while inflation remains persistent. The latest U.S. CPI report indicated core inflation around 3.2%, which is above the Fed’s target and complicates discussions about potential rate cuts. This interest rate difference makes U.S. assets more appealing for investors seeking yield. This interest rate gap is a key factor for traders and suggests a strategy that favors the U.S. dollar in the short term. We’ve seen this in the past, especially during the Fed’s aggressive rate hikes from 2022 to 2023, which strengthened the dollar. For derivative traders, this environment may present an opportunity to buy EUR/USD put options, targeting a drop toward the 1.0600 level in the upcoming weeks. Further economic data will be important to watch. Recent Eurozone Manufacturing PMI figures fell to 48.5, indicating a contraction, while the latest U.S. non-farm payroll report showed a respectable but slowing addition of 150,000 jobs. This fundamental economic discrepancy supports the current trends in the currency market. Create your live VT Markets account and start trading now.Elliott Wave analysis predicts Nasdaq will reach 26,793 as its bullish cycle continues
The Nasdaq (NQ) is expected to hit a new all-time high, aiming for at least 26,793. This upward trend started from the low in April 2025 and follows an impulsive Elliott Wave pattern. During this rise, wave (3) peaked at 26,399, followed by a corrective wave (4) that formed a double three structure.
After wave (3) reached its peak, wave ((a)) dropped to 25,853, then wave ((b)) rebounded to 26,274. Finally, wave ((c)) fell to 25,282, completing wave W of a higher degree. Wave X rallied to 25,880 before transitioning into wave Y, which took on a zigzag shape.
Wave Y and Nasdaq Resumption
In wave Y, wave ((a)) dropped to 25,162, then wave ((b)) bounced back to 25,354.75. Wave ((c)) fell to 24,707.1, finishing wave Y of (4). After this low, the Nasdaq began its upward movement in wave (5). Wave ((i)) reached 25,768.75, while wave ((ii)) found support at 25,478.50. As long as the pivot at 24,707.1 holds, we can expect further upward movement in wave (5). The current Elliott Wave structure indicates that the Nasdaq has completed an important correction and is ready to start a major upward movement. The index has begun wave (5) from the low of 24,707.1, suggesting that the immediate trend is upward. Traders should see recent pullbacks, like the drop to 25,478.50, as chances to buy while aiming for new all-time highs. This positive outlook is supported by strong economic data released in late October and early November 2025. For example, the recent CPI report showed core inflation fall to 2.8% year-over-year, which is lower than expected and is the lowest level since mid-2022. This supports the market’s belief that the Federal Reserve will keep its current policies without making further changes.Positioning for Upside
In addition, the third-quarter 2025 earnings season showed that over 80% of Nasdaq 100 companies exceeded profit expectations, particularly in the semiconductor and software sectors. The jobs report from two weeks ago also suggested a “goldilocks” scenario, featuring solid job growth and slowing wage growth, reducing fears of an overheated economy. Historically, this mix of easing inflation and strong earnings has led to significant year-end rallies, similar to what we saw in the fourth quarter of 2023. Given this backdrop, traders might want to prepare for gains in the upcoming weeks. A simple strategy is to buy at-the-money or slightly out-of-the-money call options on Nasdaq futures (NQ) or related ETFs that expire in late December 2025 or January 2026. This approach offers direct exposure to the projected rally toward the 26,793 target. For those looking for a more defined risk, bull call spreads could be an option. For instance, buying the December 25,800 call while simultaneously selling the December 26,400 call can capture the initial gains from the expected move while limiting potential profit and upfront costs. This strategy allows traders to benefit from upward momentum while reducing risk if the rally slows down before reaching new highs. The most vital factor for any bullish position is the pivot level at 24,707.1. If the price falls below this level, it would challenge the entire wave count and indicate a more complicated correction is starting. Therefore, all long positions should be adjusted or exited if the price consistently drops below this level. Create your live VT Markets account and start trading now.Deputy Governor Andrew Hauser thinks the RBA’s monetary policy is still restrictive and discussions are ongoing.
Reserve Bank of Australia Deputy Governor Andrew Hauser said that monetary policy is still restrictive, which could affect future decisions if this assessment changes.
Consumer sentiment and spending varied, with expectations for a slow recovery. Hauser also commented on unemployment rates and the new board structure, noting that board members are engaging more with the public.
Australian Dollar Stability
Market reactions showed that the Australian Dollar to US Dollar pairing was stable, trading around 0.6525. A chart of currency shifts revealed that the Australian Dollar gained 0.15% against the British Pound, while its performance varied with other major currencies. The heat map helps track currency movements. For instance, the AUD/USD showed a small 0.05% change. You can choose a base currency from the left and a quote from the top to see their respective percentage changes. The included disclaimer emphasizes the risks of financial markets, highlighting that the article is for informational purposes only and does not recommend any buy or sell actions. It advises conducting thorough research due to potential market uncertainties and losses.RBA Policy Environment
The Reserve Bank of Australia indicates its policy is at a crucial point. There’s ongoing debate about whether interest rates are still too high, leading to uncertainty. With the cash rate held at 4.35% for most of 2025, future moves will depend on new data. This uncertainty can be advantageous for derivative traders. It’s essential to closely watch upcoming inflation and employment reports. In Q3 2025, inflation remained steady at 3.8%, and the October unemployment rate was low at 3.9%. The RBA may not signal any easing yet, as any changes in these trends could significantly affect interest rate futures and the Australian dollar. This focus on data suggests that implied volatility for the AUD may be undervalued. Buying options, like straddles or strangles, before the next Consumer Price Index (CPI) release could be a smart move. This strategy allows traders to benefit from big shifts in the AUD/USD, regardless of whether the data is higher or lower than expected. For those with a specific outlook, the RBA’s view on weak consumer sentiment could lead to speculation. If you think this weakness will continue and affect future retail sales, buying AUD puts may prepare you for potential interest rate cuts. Conversely, if you believe the strong labor market will prevail, buying AUD calls anticipates a more aggressive response from the central bank. Reflecting on late 2023 and early 2024, there were times when the market frequently adjusted expectations for rate cuts based on individual data. This showed how quickly market sentiment shifts can be, affecting those who are not prepared for fluctuating risks. Current statements suggest we might enter a similar situation again, where being flexible is crucial rather than sticking to one long-term belief. Create your live VT Markets account and start trading now.Australian dollar declines against US dollar despite cautious tone from the RBA
The Australian Dollar (AUD) fell against the US Dollar (USD) for the second day in a row. The AUD/USD pair dropped as the USD gained strength amid efforts to reopen the US government. The Deputy Governor of the Reserve Bank of Australia, Andrew Hauser, mentioned that monetary policy is still tight.


