Dow Jones and S&P 500 futures were steady near 46,530 and 6,670 during European hours on Thursday. Nasdaq 100 futures slipped 0.17% to about 24,600.
US stock futures edged lower after Wednesday’s drop, when the Dow fell 1.63% to its lowest since November. The S&P 500 and Nasdaq Composite declined 1.36% and 1.46%.
Fed Signals Higher For Longer
The Federal Reserve kept rates at 3.50%–3.75% at its March meeting. Jerome Powell said inflation is expected to ease, but disinflation may be slower, and higher oil prices linked to the Iran conflict may lift near-term inflation.
Policymakers cited uncertainty over the economic effects of the Iran war and pointed to upside risks to inflation. Projections still show one rate cut this year and another in 2027, in line with December.
February US producer prices rose more than expected, with PPI up 0.7% MoM versus 0.5% in January and forecasts of 0.3%, the biggest rise in seven months. Headline PPI was 3.4% YoY, while Core PPI rose to 3.9% from 3.5%, with weekly jobless claims due next.
The Federal Reserve’s hawkish shift has reset market expectations for the coming weeks. With rate cuts now likely delayed, we should anticipate continued pressure on equities, especially the interest-rate-sensitive Nasdaq 100. Implied volatility is on the rise, with the VIX climbing over 20 in the last session, suggesting options markets are pricing in wider and more aggressive price swings ahead.
Inflation And Volatility Reprice Risk
The latest Producer Price Index figures confirm that inflation is proving stubbornly persistent, a theme that has been building since late 2025. While the 3.4% annual PPI rate is well below the peaks we saw in 2022, the sharp 0.7% monthly jump is what has the market concerned. This upward momentum in wholesale prices justifies the Fed’s decision to wait for clearer evidence of disinflation before acting.
Geopolitical tension is adding a significant layer of risk, directly impacting energy markets and inflation forecasts. With Brent crude now trading above $95 a barrel for the first time in over a year, we should consider using call options on energy sector ETFs as a direct hedge. This strategy would benefit from both rising oil prices and the inflationary environment the Fed is now fighting.
The derivatives market is rapidly repricing the path for interest rates, which directly impacts index valuations. Fed Funds futures now indicate less than a 40% chance of a rate cut by September, a stark reversal from the two cuts that were priced in at the start of the year. This makes protective put strategies on broad market indices like the S&P 500 an increasingly prudent way to manage downside risk.
Given this backdrop, we should expect value-oriented sectors to outperform growth stocks in the near term. The Dow Jones, with its focus on industrial and financial giants, may prove more resilient than the tech-heavy Nasdaq. This scenario favors strategies like selling out-of-the-money call spreads on technology ETFs to generate income while maintaining a cautious market view.
Create your live VT Markets account and start trading now.
Start trading now – Click here to create your real VT Markets account
The US Federal Reserve kept the federal funds rate unchanged in March. The Federal Open Market Committee raised its inflation forecast and its growth forecast, and still projected one rate cut in 2026.
Rabobank revised its forecast for 2026 to two rate cuts, planned for September and December. It had previously forecast three cuts.
Rabobank Revises Rate Cut Outlook
Rabobank said the change follows the war with Iran and the rise in energy prices. It reported that a further escalation in the conflict could remove one more cut from its 2026 forecast.
Before the war with Iran, Rabobank expected three rate cuts in 2026 in June, September and October. It also stated that market consensus implies fewer cuts than its own forecast.
Rabobank referenced the possibility of a future change in Federal Reserve leadership to Warsh. It said this could affect future policy decisions.
The article notes it was produced with assistance from an artificial intelligence tool and reviewed by an editor.
Market Pricing And Trading Implications
The Federal Reserve is holding rates steady for now, officially projecting just one cut in 2026, but we see things differently. We are forecasting two rate cuts, one in September and another in December, because we believe the Fed will look through the temporary inflation caused by the conflict with Iran. Recent data shows core inflation remaining stubborn around 3.2%, which explains why many in the market are hesitant to price in more aggressive easing.
The situation with Iran is the primary source of uncertainty and will drive volatility in the coming weeks. We just saw Brent crude prices spike over $95 a barrel on reports of new tensions, a level not seen since the initial flare-ups in 2025. This kind of environment means traders should prepare for sudden moves, making options strategies that benefit from rising interest rate volatility particularly relevant.
There appears to be a disconnect between our view and what the market is currently pricing. As of today, interest rate futures are implying only about a 60% chance of a single rate cut by the end of the year. For traders who agree with our two-cut forecast, this suggests positions that benefit from falling rates later in the year could be undervalued.
An additional factor to watch is the potential for a new Fed Chair, who may push the Committee to be more aggressive with cuts than is currently expected. Looking back at past leadership changes at the Fed, such as the transition to Powell in 2018, we saw periods of significant market repricing. This uncertainty further supports holding positions that can profit from a wider range of outcomes, as the risk of another cut being removed from our forecast remains if the war escalates.
Create your live VT Markets account and start trading now.
Start trading now – Click here to create your real VT Markets account
S&P 500 earnings for 2026 Q1 are forecast to rise +12.0% year on year, with revenues up +8.6%. This follows 2025 Q4 growth of +14% in earnings on +9.1% higher revenues.
Forecasts for 2026 Q1 and full-year 2026 remain positive, and the revisions trend stayed positive after the start of the Middle East conflict. Energy estimates have risen since early March, and estimates also increased for 8 other Zacks sectors, including Tech, Finance, Construction, Basic Materials, and Utilities.
Tech Drives Earnings Growth
Tech is expected to deliver +24.6% earnings growth in 2026 Q1. Excluding Tech, projected S&P 500 earnings growth for the rest of the index is +5.5% rather than +12.0%.
For 2026 Q1, the Zacks Tech sector is projected to post +24.8% earnings growth on +21.8% higher revenues. Tech has supported overall earnings growth since 2023 Q3 and is expected to do so again in 2026 Q1.
Two of the Mag 7, Amazon (AMZN) and Tesla (TSLA), are not classed as Tech under Zacks, with Amazon in Retail and Tesla in Auto. Tech and Finance revisions are helping keep overall revisions positive, alongside Industrial Products and Business Services since October 2025.
Given the forecast for 12.0% earnings growth in the first quarter, we should anticipate a continued bullish environment for the S&P 500. This follows the strong 14% growth we saw in the final quarter of 2025, suggesting momentum is carrying into the new year. Bullish positions on broad market index futures or call options on ETFs like SPY appear justified based on these aggregate numbers.
Energy Revisions And Market Positioning
The recent Middle East conflict is clearly driving revisions in the Energy sector higher. With WTI crude recently breaking $88 a barrel, a level not seen since last autumn, this geopolitical tension is translating directly into profit expectations. We should consider buying call options on energy ETFs like XLE to capitalize on potential further price increases and volatility.
There is a significant disconnect between the downbeat sentiment on tech stocks and their outstanding fundamental outlook. The sector’s earnings are projected to surge by 24.6%, yet the market seems hesitant. This points to an opportunity where implied volatility might be undervalued, making long call strategies on tech-heavy indices potentially profitable.
The importance of the tech sector cannot be overstated, as S&P 500 earnings growth would drop to a modest 5.5% without its contribution. This concentration of strength reminds us of the market action in late 2023, when AI-related optimism drove the sector far ahead of everything else. The current positive earnings revisions suggest that trend is still very much in play.
This wide performance gap between tech and the rest of the market makes a pairs trade attractive. We could go long Nasdaq 100 futures or QQQ call options while simultaneously hedging with short positions in a broader, less tech-focused index like the Russell 2000. This strategy aims to capture the outperformance of the tech sector regardless of the overall market’s direction.
We should not ignore the positive revisions in other areas like the Finance sector. The recent stabilization of the 10-year Treasury yield around 4.1% provides a steady backdrop for financial institutions. This makes looking at bullish positions on financial ETFs a sound secondary strategy to diversify our exposure.
Create your live VT Markets account and start trading now.
Start trading now – Click here to create your real VT Markets account
The US Dollar stayed in consolidation after gaining in Wednesday’s American session. Markets awaited policy decisions from the SNB, BoE and ECB, while the US calendar listed weekly Initial Jobless Claims and January New Home Sales.
The Fed kept the policy rate at 3.5%–3.75%. The SEP still implied 25 bps cuts in 2026 and 2027; seven officials expected no cuts this year and one projected a hike next year.
Fed Policy Signals Higher For Longer
End-2026 PCE inflation was forecast at 2.7%, up from 2.4% in December, with core PCE also seen at 2.7%. Jerome Powell said higher energy prices could lift inflation near term and cuts would not proceed if progress on inflation stalls.
The USD Index rose nearly 0.7% on Wednesday and held above 100.00 early Thursday. The BoJ held its short-term rate at 0.75%, with one member seeking a 25 bps rise; USD/JPY eased to about 159.50 after nearing 160.00.
Australia’s February jobs rose 48.9K versus 20.3K expected, while unemployment climbed to 4.3% from 4.1%. AUD/USD traded just below 0.7050; UK unemployment stayed at 5.2% and wage growth eased to 3.8% from 4.1%, with GBP/USD below 1.3300 and the BoE expected at 3.75%.
EUR/USD held above 1.1450 after a near 0.8% fall. Gold dropped below $5,000 and to under $4,800, while WTI fell about 3.5% to near $95.50 after a near 4% rise.
Trade Setups For Rates Fx And Commodities
The Federal Reserve is signaling that it will keep interest rates higher for longer, which strongly supports the US Dollar. Recent data from earlier in the year showed that inflation remains persistent, with the Consumer Price Index for January 2026 coming in at a stubborn 3.1%, while the labor market added a robust 280,000 jobs. This economic strength gives the Fed little reason to consider cutting rates soon.
Given this backdrop, we should anticipate continued dollar strength in the coming weeks. A straightforward strategy is to buy call options on the U.S. Dollar Index (DXY) futures, betting on a rise above the 101.00 level. Alternatively, selling cash-secured puts on dollar-tracking ETFs provides a way to collect premium while expressing a bullish view on the currency.
Meanwhile, the Bank of Japan is facing its own inflationary pressures, which one board member has already acknowledged. Looking back at the data from late 2025, we saw nationwide core inflation in Japan consistently hover above the 2.5% mark, justifying the lone call for a rate hike. This growing divergence within the BoJ suggests that a policy shift could be closer than the market expects.
With USD/JPY trading near levels not seen since mid-2024, the risk of verbal or physical intervention from Japanese authorities is extremely high, as we saw them do back in 2022. Derivative traders should consider buying out-of-the-money puts on USD/JPY as a cheap hedge against a sudden, sharp reversal. This protects against both a surprise BoJ pivot and direct currency market intervention.
The strong dollar is directly pressuring commodities, especially gold, which has broken key psychological levels. Higher interest rates increase the opportunity cost of holding non-yielding assets like gold, driving its price down. For crude oil, the recent price strength is fueling the Fed’s inflation concerns, creating a tense balance in the energy market.
For gold, the path of least resistance appears to be lower, making put options on gold futures a viable strategy to capitalize on further downside. On the other hand, oil prices seem caught between strong demand signals and the dampening effect of a strong dollar. Selling an iron condor on WTI crude oil futures could be an effective way to trade the expectation that prices will remain in a defined range, such as $90-$100 per barrel.
In Europe, both the Bank of England and the European Central Bank seem content to hold their policy rates steady. Inflationary pressures in the Eurozone and the UK have been cooling faster than in the US, with recent reports from February 2026 showing headline inflation in both regions falling below 3.0%. This confirms their less aggressive stance compared to the Federal Reserve.
This clear policy divergence between the Fed and its European counterparts should continue to weigh on EUR/USD and GBP/USD. We believe selling call spreads on both pairs is an effective way to profit from expected weakness or sideways consolidation. This strategy limits risk while capitalizing on the view that the US Dollar will remain the dominant currency in the near term.
Create your live VT Markets account and start trading now.
Start trading now – Click here to create your real VT Markets account
Deutsche Bank economists expect the European Central Bank (ECB) to keep interest rates unchanged today. They expect the ECB to note higher uncertainty and higher near-term inflation risks after the Iran conflict and an oil price spike.
Market pricing has shifted since the last ECB meeting. Markets now price in at least one ECB rate rise by July and two rises by year-end, and inflation swaps have moved sharply higher across the curve.
Central Banks Hold The Line
The ECB and the Bank of England both announce policy decisions today. The ECB is widely expected to follow the US Federal Reserve and the Bank of Japan by keeping rates on hold.
Economists expect the ECB to restate its aim to keep prices stable and to signal willingness to act if needed. They refer to the 2022–23 inflation shock as a risk the ECB wants to avoid, with attention on keeping inflation expectations anchored.
A two-day European Union leaders’ summit also starts today. Higher energy prices are expected to be discussed, with policy responses likely to focus on national energy tax cuts for now.
With the ECB expected to sound more aggressive today, we should anticipate a continued rise in interest rate volatility. The conflict in Iran has pushed Brent crude futures above $115 a barrel for the first time since late 2024, directly feeding into inflation fears. This environment favors strategies that profit from wider price swings, such as purchasing options on Euribor futures.
Rates Volatility And Trading Positioning
The swaps market has already moved sharply, pricing in more than 50 basis points of hikes from the European Central Bank by December. Recent data supports this, with the latest Eurozone inflation reading for February 2026 coming in at a surprisingly high 2.8%. Traders should consider positioning for an even more hawkish shift by using interest rate swaps to bet on higher rates later this year.
This situation feels very similar to what we experienced back in 2022, when energy shocks forced central banks to act decisively. The ECB will want to prove it has learned its lesson and will not fall behind the curve on inflation again. This strong commitment to price stability means the risk is skewed towards more rate hikes than are currently priced in, not fewer.
Given the ECB’s hawkish tilt while other central banks like the Fed remain on hold, we could see significant currency movements. A firming euro against the dollar is a distinct possibility in the coming weeks. Derivative traders can position for this by looking at EUR/USD call options to capitalize on potential euro strength.
The focus on country-level tax cuts by EU leaders, rather than a unified energy support package, may do little to curb overall inflation. This suggests underlying price pressures will remain, forcing the ECB’s hand for longer than the market expects. We should therefore be cautious about positioning for any rate cuts before mid-2027.
Create your live VT Markets account and start trading now.
Start trading now – Click here to create your real VT Markets account
Switzerland’s imports fell month on month to 17,380M in February. This was down from 18,411M in the previous month.
The drop represents a decrease of 1,031M compared with January. The figures describe a month-on-month decline in the value of imports.
The drop in Swiss imports for February is a clear signal of slowing domestic demand. This points to a cooling economy, giving the Swiss National Bank (SNB) more justification to consider a more dovish monetary policy. We should anticipate that this data will weigh on the central bank’s upcoming decisions.
This development is bearish for the Swiss Franc, as a weaker economic outlook often leads to a weaker currency. The latest Swiss CPI figures, which showed inflation easing to 1.4%, further support the case for the SNB to act, possibly through a rate cut. We believe positioning for CHF weakness through options, such as buying EUR/CHF calls, is a prudent strategy.
For equity traders, this slowdown in domestic consumption could create headwinds for the Swiss Market Index (SMI). While many SMI companies are global exporters, a negative domestic sentiment can still impact the market. This import data confirms other recent weak signals, such as the procure.ch Manufacturing PMI which fell to 49.1 in February, indicating a contraction.
We are now looking at the upcoming SNB policy meeting as the next major catalyst. This situation contrasts with the economic strength we observed through most of 2025, which supported the franc. The current data increases the probability of a dovish surprise, suggesting traders could look at volatility plays on the franc in the run-up to the announcement.
Start trading now – Click here to create your real VT Markets account
Switzerland’s exports fell month on month in February. They dropped from 22,229M in the previous period to 21,584M.
This is a decrease of 645M compared with the prior month. The figures are reported in millions (M).
The February drop in Swiss exports signals a potential economic slowdown, increasing the probability of a weaker Swiss Franc. We should therefore look at derivative strategies that would benefit from a rising USD/CHF or EUR/CHF over the next few weeks. Call options on these pairs offer a defined-risk way to position for franc weakness.
This export weakness is concerning because the chemical and pharmaceutical sector, which makes up over 45% of goods sold abroad, is now showing signs of softness. This follows the trend we saw in the luxury watch sector, which has faced headwinds from slowing Asian demand since late 2025. This makes buying puts on the Swiss Market Index (SMI) an attractive hedge, as key components like Novartis and Richemont are directly exposed.
This report will give the Swiss National Bank (SNB) more reason to maintain its dovish policy, especially as domestic inflation is already low at a reported 1.4%. We saw the SNB act decisively to weaken the franc back in 2025, and this data supports the case for them to stay on the sidelines or even hint at future rate cuts. This reinforces the bearish view on the franc, making futures contracts shorting the CHF against a basket of currencies a viable strategy.
Given the uncertainty, an increase in currency volatility is likely. Looking back at the market’s reaction to weak industrial data in the third quarter of 2025, implied volatility on CHF pairs saw a significant spike. Therefore, purchasing short-dated straddles or strangles on EUR/CHF could be an effective way to profit from a sharp price move in either direction as the market reprices Switzerland’s growth outlook.
Start trading now – Click here to create your real VT Markets account
The UK claimant count rate stayed at 4.4% in February. This measure tracks the share of people claiming unemployment-related benefits.
No change was recorded from the previous month. The figure indicates stability in the number of benefit claimants during the period.
Claimant Count Rate Summary
The data refers to February and uses a percentage rate. It reports the claimant count rate as 4.4%.
The unchanged claimant count rate of 4.4% for February indicates a UK labour market that has lost momentum. We see this as a sign of economic stagnation rather than stable strength. This figure, combined with the sluggish 0.1% GDP growth we saw in the final quarter of 2025, suggests the economy is struggling to expand.
This persistent slack in the job market makes a Bank of England interest rate cut more likely in the second half of the year. We note that inflation has recently cooled to 2.8%, moving closer to the Bank’s target and giving policymakers more room to ease conditions. Therefore, we should be positioning in SONIA futures to reflect a more dovish path for rates than the market is currently pricing.
For equity traders, this economic picture puts a cap on the FTSE 100’s potential. We would advise against buying aggressive upside calls and instead look at strategies that profit from range-bound trading, such as selling covered calls on existing holdings. Corporate earnings are unlikely to surprise to the upside in this environment.
Market Implications And Trade Ideas
In the currency market, this outlook is negative for the British pound. With the Bank of England potentially pivoting to cuts while the US Federal Reserve remains on hold, the interest rate differential will likely weigh on the GBP/USD pair. We see value in buying sterling put options with a three-month expiry, targeting a move towards the 1.2400 level.
However, we must also factor in that average wage growth is still holding firm above 5%, a key metric the Bank is watching. This conflict between a cooling job market and hot wage data will create uncertainty and potential volatility. This suggests buying straddles on the FTSE 100 index ahead of the next labour market data release could be a prudent way to trade the potential for a sharp move in either direction.
Looking back, this situation is a clear shift from the narrative we followed throughout 2025. Last year, the primary concern was fighting inflation, which justified keeping rates high despite a slowing economy. Now, with inflation abating, the focus is shifting to the lack of growth, and this stagnant jobs report is a key piece of that puzzle.
Create your live VT Markets account and start trading now.
Start trading now – Click here to create your real VT Markets account
The UK ILO unemployment rate held at 5.2% in the three months to January, against a forecast of 5.3%, according to the ONS. Employment rose by 84K, up from 52K previously.
Average earnings excluding bonuses rose 3.8% year on year, below forecasts of 4.0% and down from 4.1% (revised from 4.2%). Average earnings including bonuses rose 3.9% year on year, in line with expectations and down from 4.2% in the quarter to December.
Labour Market And Sterling Reaction
After the release, GBP/USD fell to near 1.3250 from earlier levels. Earlier coverage previewed a February claimant count change of 25.8K versus 28.6K in January, with the claimant count rate previously at 4.4%.
The preview also set wage forecasts at 3.9% including bonuses and 4.0% excluding bonuses, with unemployment seen at 5.3%. It noted the Bank of England decision due later, and said markets had moved from pricing an 80% chance of a March cut before the Iran conflict.
It also reported the Fed left rates unchanged at 3.50%–3.75%. Technical levels cited included RSI 38, support at 1.3218, and resistance at 1.3323 and 1.3445.
Looking back at the jobs data from early last year, we saw that cooling wage growth was a key driver for the pound’s weakness. Even though unemployment held steady, the market focused on the reduced pressure for the Bank of England to raise interest rates. That report in 2025 sent GBP/USD down toward 1.3250 as traders priced in a more cautious central bank.
Bank Policy Divergence And Trade Implications
The situation today, in March 2026, presents a more challenging picture for the UK. The latest figures from February show the unemployment rate has now crept up to 5.5%, while wage growth remains stubbornly high at 4.6% due to persistent inflation, which is currently running at 3.8%. This stagflationary environment, with weak growth and high price pressures, continues to weigh on the pound.
This puts the Bank of England in a difficult position, forcing it to hold interest rates steady to fight inflation, despite the weakening economic activity. In contrast, the US Federal Reserve has managed to bring inflation down closer to its target, allowing it more policy flexibility. The ongoing policy divergence between a stuck BOE and a more nimble Fed suggests a continued downward trajectory for the GBP/USD pair.
Given this outlook, we believe traders should consider positioning for further weakness in the pound against the US dollar. One straightforward strategy is to buy GBP/USD put options with expiries in the coming one to two months. This approach allows for profiting from a decline in the exchange rate while limiting the potential loss to the premium paid for the option.
Furthermore, implied volatility in the pound has been increasing due to the economic uncertainty and geopolitical tensions stemming from the ongoing Iran conflict. Traders should monitor volatility levels, as a sharp spike could make options more expensive but also present opportunities. This environment suggests that any short-term rallies in GBP/USD are likely to be sold into, reinforcing the bearish outlook.
Create your live VT Markets account and start trading now.
Start trading now – Click here to create your real VT Markets account
The AI trade has spent two years rewarding the loudest names: chip designers, cloud platforms, and data centre builders. Yet one of the more interesting moves in 2026 came from a company better known for bathrooms than semiconductors.
On 22 January, shares in Japan’s TOTO jumped nearly 10% and rose as much as 11% intraday after analysts pointed investors toward its electrostatic chucks, ceramic components used in chipmaking equipment and seen as beneficiaries of tighter memory supply tied to AI infrastructure demand.
What matters here is not that TOTO suddenly became an AI company. It is that part of its business that sits further upstream, in the manufacturing layer, that helps keep semiconductor production running. That is where the market has started to widen its focus—beyond computation and models and into the materials, tools, and specialised components that support the whole buildout.
TOTO’s Key Results: Why Investors Took Notice
TOTO drew market attention not because its bathroom business changed overnight, but because its advanced ceramics segment showed how AI demand can lift smaller upstream suppliers in semiconductor manufacturing.
Operating profit from advanced ceramics rose to ¥20.2 billion, up ¥6.0 billion.
In its first-half FY ending March 2026 materials, TOTO’s business overview shows New Business Domains at 7% of the sales-mix snapshot, while the company’s reported first-half figures imply a contribution closer to 8.5% of total sales.
TOTO also said advanced ceramics benefited from stronger electrostatic chuck demand as data-centre-driven semiconductor demand improved.
TOTO’s Inclusion in the AI Conversation
TOTO is now being discussed in AI-related market commentary because part of its business supports chipmaking equipment, placing it inside the upstream semiconductor supply chain.
While they earn most of their money from housing and sanitary products, their advanced ceramics business indicates sales in electrostatic chucks and related components used inside semiconductor manufacturing equipment. It is being re-rated because part of its business sits upstream, where manufacturing bottlenecks can become just as valuable as algorithmic breakthroughs.
In its first-half FY ending March 2026 materials, TOTO said advanced ceramics benefited from stronger electrostatic chuck demand as the semiconductor market improved on data-centre demand, while higher operating levels at manufacturers also supported replacement demand.
How the Market Is Repricing Upstream AI Exposure
This move is less about toilets than it is about how the semiconductor supply chain is tightening under AI demand.
Memory is being treated as a longer-cycle constraint. Bloomberg reported that Goldman Sachs linked TOTO’s electrostatic chucks to NAND chipmaking and said they should benefit from AI infrastructure buildout, which is tightening both high-end and commodity memory supply.
Memory suppliers are planning for a cycle that lasts longer than a short spike. Reuters reported on 18 March that Samsung wants to move toward three- to five-year contracts with major customers as AI data-centre demand fuels what it called an “unprecedented supercycle.”
The latest move in TOTO reflects a broader market shift. Investors are looking beyond cloud giants and chip designers to the materials, tools and production systems that support AI hardware demand.
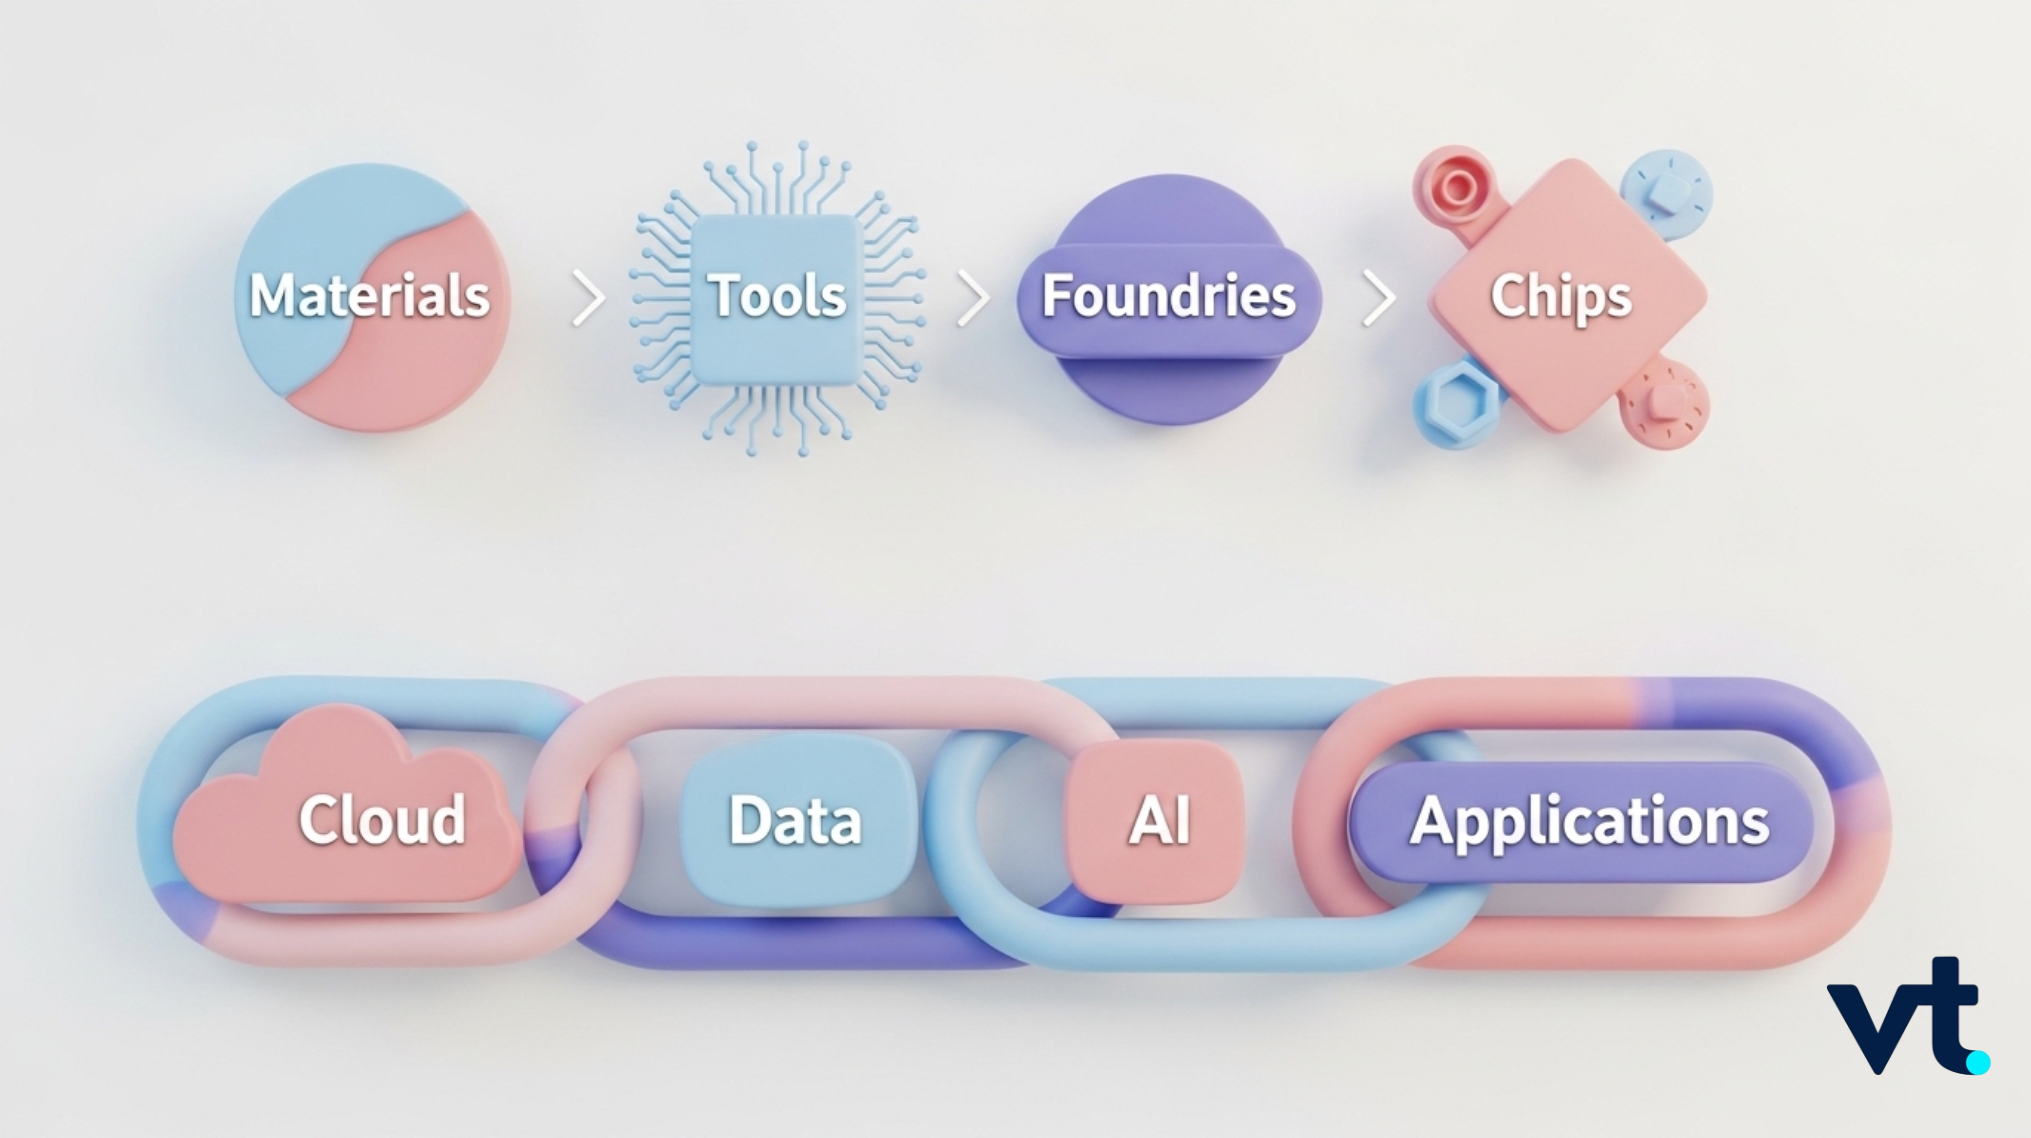
In technical terms, more AI infrastructure means more chips, more chip output means fabs stay busy for longer, and busy fabs need more tools, more replacement cycles and more specialised components inside those tools. TOTO benefits from that last part of the chain.
Supplies gases, specialty materials, glass, fibre and packaging-related inputs that keep AI hardware production and data transfer running
APD, Air Liquide, GLW, DD
Equipment intensity remains elevated because AI capacity still needs to be built. TSMC said in January that it expects 2026 capital spending of $52 billion to $56 billion, reflecting continued investment in advanced semiconductor capacity. At the industry level, SEMI said foundry and logic wafer-fab-equipment sales are expected to keep growing in 2026 as chipmakers add capacity for AI accelerators and high-performance computing.
TOTO sits in the upstream manufacturing layer, though in a more specialised form than the established equipment giants. Its connection to AI comes from the infrastructure used to make semiconductors, not from AI software, cloud applications, or chip design itself.
That places it closer to Applied Materials, KLA, Lam Research, ASML and ASM than to Nvidia-style front-end winners. Its role is smaller and more niche, but niche positions can become highly valuable when demand is strong, capacity is tight, and replacement is not easy.
TOTO is not alone. A growing number of lesser-known firms are gaining attention because they serve the manufacturing, materials and connectivity layers beneath the better-known AI winners.
A useful way to think about these names is not ‘surprise AI stock’ versus ‘obvious AI stock’. It is whether the company sits at a point in the stack where demand compounds, lead times matter, and replacement is difficult.
How Your AI Portfolio Stacks Up
As always, caution is advised. Now, with more potential selection and selectivity.
Not every hidden supplier deserves the same AI adoption re-rating. Some companies are directly linked to wafer fabrication; others are loosely adjacent. TOTO’s ceramics arm sits closer to the production bottleneck than a generic industrial name, but that still does not make it a pure semiconductor stock..
When supply chains start pricing in a long expansion, valuations can move ahead of what end demand eventually absorbs. Concerns about overheating in AI investment even as memory demand remains strong.
AI Supply Chain Stocks to Watch
The more useful distinction is not whether a stock looks like a traditional AI winner. It is whether the company sits at a part of the chain where demand compounds, capacity stays tight and substitution is difficult.
Interested in the growing AI supply chain? Monitor real-time CFD price action of these shares on VT Markets APP.
How are Upstream Chip Manufacturing Important?
AI demand still depends on semiconductor production, and that means fab tools, process systems, specialty materials and replacement cycles remain important parts of the trade. The case for these quieter names is gaining support because the AI buildout is still creating pressure in the physical layers of the supply chain, not only in software or cloud spending.
Tighter memory and fab capacity are raising the value of upstream suppliers. As chipmakers add capacity for AI accelerators and high-performance computing, the importance of tooling, replacement cycles and specialised components used in wafer production rises with it.
Smaller specialists are starting to reflect that shift in their numbers. TOTO’s advanced ceramics unit is growing much faster than the group’s housing businesses and is highly profitable relative to its small revenue share.
Taken together, that points to a broader shift in market attention: away from AI demand only at the top of the stack, and toward the supply constraints and specialised manufacturing layers underneath it.
Market Sentiment on the AI Trade
TOTO’s rally suggests the market is beginning to reward scarcity and specialised industrial roles inside the AI chain, not only the loudest names at the top. It is starting to look further upstream, where capacity constraints, specialist tooling and hard-to-replace components can matter just as much.
That shift matters because the next phase of AI trade may depend less on obvious AI exposure and more on where scarcity sits inside the chain. For TOTO, the focus now is whether advanced ceramics can continue outgrowing the rest of the business and whether that niche role in semiconductor manufacturing keeps translating into visible earnings strength.
TOTO may be a narrow expression of the theme, but narrow can still be powerful when demand is strong and substitution is difficult. That is what makes this more than a one-day surprise rally.
Key Definitions in the Upstream AI Supply Chain
What is the upstream AI supply chain?
The upstream AI supply chain refers to the materials, tools, components and fabrication systems needed to produce semiconductors before they reach cloud platforms, AI models or end-user applications.
What are electrostatic chucks?
Electrostatic chucks are specialised components used in semiconductor manufacturing equipment to hold wafers securely during processing. They are part of the infrastructure used inside chip fabrication plants.
What is fab utilisation?
Fab utilisation refers to how fully a semiconductor fabrication plant is being used. Higher fab utilisation usually means stronger production activity, which can increase demand for replacement parts, maintenance and tool-related components.
What is equipment intensity in chip manufacturing?
Equipment intensity refers to how much specialised manufacturing equipment is needed to produce semiconductors at a certain scale or level of complexity. Higher equipment intensity often supports demand for tool makers and their supply chains.
What is a bottleneck supplier?
A bottleneck supplier is a company that provides a hard-to-replace material, component or tool in a production chain. These suppliers can become more valuable when demand rises and alternatives are limited.
Start trading now – Click here to create your real VT Markets account