Back

MUFG’s Michael Wan says RBA’s 25bp hike reflects domestic inflation, as global and Asian rates reprice

Global and Asian interest rate markets have repriced since the Iran war. This repricing has affected expectations for multiple central banks. The Reserve Bank of Australia increased its policy rate by 25 bps. The move reflects how inflation levels and domestic economic conditions shape policy decisions. Markets first read the decision as a close 5–4 vote in favour of the rise. Later comments from Governor Bullock were taken as hawkish, implying discussion focused on when to raise rates rather than whether to do so. The article was produced with the help of an artificial intelligence tool and reviewed by an editor. We find ourselves in a familiar situation, recalling how rates repriced globally after the tensions in 2025. The Reserve Bank of Australia’s rate hike back then was a key example, showing us that domestic inflation is the ultimate driver for central bank policy. That hawkish turn taught us not to underestimate a central bank’s resolve when facing price pressures. This lesson is critical today, as Australia’s latest monthly CPI indicator for February 2026 just came in at a stubborn 3.8%, well above the target range. This proves that the inflationary challenges we saw developing in 2025 have persisted. Consequently, the market is no longer pricing in rate cuts this year, a major shift from just a few months ago. With the U.S. Federal Reserve also holding its key rate firm at 5.50%, the global environment supports continued restrictive policy. This echoes the post-2025 period, where central banks moved in unison to combat inflation. Therefore, traders should anticipate a higher-for-longer rate environment across the board. For derivatives traders, this points toward positioning for continued interest rate volatility. The MOVE index, which tracks bond market volatility, has already climbed to over 115 points this month, reflecting this uncertainty. We should consider strategies that profit from price swings, such as long straddles on bond futures. Specifically, the Australian dollar is likely to find support from a hawkish RBA. We see potential in using call options on AUD/USD to gain upside exposure with limited risk. The hawkish commentary we saw from Governor Bullock in 2025 seems just as relevant to the bank’s stance today.

Start trading now – Click here to create your real VT Markets account

Treasurer Jim Chalmers warned an Iran war might lift inflation 0.25 points and reduce GDP further

Australia’s Treasury modelled two Iran conflict scenarios: oil staying at $100 per barrel for H1, or rising to $120 and taking three years to return to pre-conflict prices. Updated figures, compared with modelling from a week earlier, indicate an extra 0.25 percentage point added to headline inflation and a doubling of the negative effect on GDP. Under the short-term scenario, headline inflation is estimated to peak 0.75 percentage points higher. Output is projected to be 0.2% lower around the middle of this year. Under the prolonged scenario, headline inflation is estimated to peak 1.25 percentage points higher. GDP is projected to be 0.6% lower in 2027 and still below the no-conflict path in 2029. About half of the GDP effect is linked to higher oil prices, with the rest tied to wider economic consequences. At the time of writing, AUD/USD was up 0.22% at 0.7120. Looking back at the Treasury modelling from early 2025, the prospect of inflation peaking in the high 4s is now our present reality. The latest figures for the December 2025 quarter showed headline inflation at 4.3%, making the Reserve Bank of Australia’s position increasingly difficult. This persistence suggests interest rate derivatives should be positioned for a hawkish hold from the central bank, with a non-trivial risk of a further rate hike this year. The short-term scenario, which we saw modelled with oil at $100, is effectively in play as Brent crude now trades near $98 a barrel amid ongoing Middle East tensions. This has kept volatility in energy markets extremely high, with the Crude Oil Volatility Index (OVX) sitting at a 12-month peak. Traders should consider strategies that benefit from this volatility, such as buying straddles on oil futures to profit from a large price move in either direction. The negative impact on GDP, which was then estimated to be around 0.2% lower, is now being reflected in forward-looking indicators. We are seeing this pressure in recent business confidence surveys, which fell to a two-year low in February 2026. This environment warrants caution, favoring strategies that are short domestic-focused cyclical stocks and long commodity exporters who benefit from the elevated prices. While higher oil prices would typically support the Australian dollar, the broader global risk aversion has capped any significant rally. The AUD/USD, which was trading at 0.7120 when these concerns were first modelled in 2025, is now struggling to hold the 0.6750 level against a stronger US dollar. Options traders should note that one-month implied volatility for the pair has risen to over 11%, indicating expectations of larger price swings in the weeks ahead.

Start trading now – Click here to create your real VT Markets account

Nvidia has finished its cycle since April 2025’s low and now enters a bearish corrective double-three phase

Nvidia has moved on from the April 2025 low and is now in a broader corrective phase. It is described as a double three Elliott Wave pattern, which points to a complex retracement. From the all-time high on 29 October 2025 at $212.19, wave (W) fell to $169.55. Wave (X) then rose to $203.62 on a 45-minute chart.

Wave Y Zigzag Structure

Wave (Y) is under way and is set out as a zigzag. From the end of wave (X), wave A reached $173.11. Wave B is developing as another zigzag, with wave ((a)) ending at $188.88. A brief dip in wave ((b)) is expected, followed by a rise in wave ((c)) to finish wave B. The analysis keeps $203.62 as the key pivot level. The suggested wave (Y) target sits in the 100%–161.8% Fibonacci extension of wave (W), between $127.7 and $154.2. With a short-term rally in Wave B expected, traders could consider near-term bullish positions. Buying call options with expirations in late March or early April 2026 might capture the anticipated final push toward the $190-$200 area. This bounce comes despite the latest February 2026 CPI report coming in slightly hotter than expected at 3.2%, which has generally dampened market sentiment. However, we see this rally as a temporary setup for a larger move lower. As long as the price stays below the critical $203.62 pivot from last year, the overall corrective structure remains valid. Bearish traders should be preparing to initiate positions once this Wave B bounce shows signs of exhaustion.

Broader Semiconductor Backdrop

The broader semiconductor environment supports this cautious view. Recent data released in early March 2026 by the Semiconductor Industry Association showed a slight dip in global chip sales for January, pointing to some softness in enterprise spending. This aligns with the idea that the stock needs to digest its significant gains from the run that started back in April 2025. Once Wave B completes, buying put options dated for May or June 2026 would be a direct way to play the expected decline in Wave (Y). A more conservative strategy involves using bear call spreads with a short strike above the $203.62 pivot point. The ultimate target for this downward move sits in the $127.70 to $154.20 zone. We should remember that after the massive run-up we saw through 2024 and 2025, a complex correction like this is not unusual for Nvidia. Looking back, we saw a similar multi-month correction in the latter half of 2021 before the next major leg up, suggesting such patterns are part of the stock’s long-term cycle. Implied volatility will likely rise as the next leg down begins, making put options more expensive but also potentially more profitable. Create your live VT Markets account and start trading now.

Start trading now – Click here to create your real VT Markets account

According to compiled data, Pakistan’s gold prices dropped, with declines reported in midweek trading sessions

Gold prices in Pakistan fell on Wednesday, based on FXStreet data. Gold was priced at PKR 44,631.11 per gram, down from PKR 44,828.19 on Tuesday. The price per tola dropped to PKR 520,568.50 from PKR 522,867.20 a day earlier. Other listed prices were PKR 446,294.50 for 10 grams and PKR 1,388,184.00 per troy ounce.

Gold Price Calculation Method

FXStreet converts international gold prices into Pakistani rupees using the USD/PKR rate and local units. The figures are updated daily at publication time and are for reference, with local market rates able to differ slightly. Central banks are the largest holders of gold. World Gold Council data shows central banks added 1,136 tonnes worth around $70 billion in 2022, the highest annual total since records began. Gold often moves in the opposite direction to the US Dollar and US Treasuries. As a non-yielding asset, it can be affected by interest rates, geopolitical risk, recession fears, and changes in the US Dollar. We see gold’s role as a hedge against currency depreciation and inflation as being severely tested right now. The latest US inflation report for February 2026 showed a stubbornly high 3.1% reading, which should typically support gold. However, this has been overshadowed by the Federal Reserve’s commitment to keeping interest rates elevated, strengthening the US Dollar and creating a headwind for the precious metal.

Central Bank Demand Outlook

The significant central bank buying we observed back in 2022 has established a new pattern of behavior that provides a solid floor for prices. Looking at the most recent data from the World Gold Council for the fourth quarter of 2025, central banks globally added another 290 tonnes to their reserves. This consistent demand, particularly from emerging economies, suggests that any major price dips are likely to be viewed as buying opportunities by these large institutions. Furthermore, we must watch gold’s inverse relationship with risk assets, which are showing early signs of weakness. Following a period of calm in 2025, stock market volatility has been picking up, with the VIX index recently climbing above 19 for the first time this year. This growing uncertainty in equities could channel more investment into the perceived safety of gold over the next few weeks. Given these conflicting forces, derivative traders should consider strategies that capitalize on potential volatility rather than a specific direction. Implied volatility in gold options has been rising, indicating the market is pricing in a larger-than-usual price swing. This environment makes strategies like long straddles or strangles on gold futures attractive, as they can profit from a significant price move regardless of whether it is up or down. For those with a more cautiously bullish outlook, using call option spreads offers a defined-risk way to position for a potential rally. By purchasing a call at a lower strike price and selling one at a higher strike, traders can limit their upfront cost and maximum loss. This allows for participation in a potential upside break driven by safe-haven flows, while hedging against the persistent strength of the US Dollar. Create your live VT Markets account and start trading now.

Start trading now – Click here to create your real VT Markets account

Ahead of central bank events, EUR/USD trades sideways under the 200-hour SMA near 1.1550 during Asia

EUR/USD is moving sideways after rising over the past two days, trading just below the mid-1.1500s. It is holding below the 200-hour SMA at 1.1547 after rebounding from 1.1415–1.1410, its lowest level since August 2025. Markets are waiting for the Federal Reserve decision after its two-day meeting later on Wednesday, and the ECB update on Thursday. Attention is on the future rate path, with concern that a war-driven rise in energy prices could hurt growth and increase inflation pressure. Technicals show the RSI near 62, still positive but not overbought. The MACD line has edged below the signal line near zero, pointing to weaker upward momentum. Resistance is at the 50.0% retracement level of 1.1539, then 1.1569 at the 61.8% level, and the 100-period SMA area near 1.1580. Support is at 1.1509 (38.2%), then 1.1473 (23.6%), with a break below 1.1473 targeting 1.1413, while holding above 1.1569 shifts focus to 1.1612–1.1666. Looking back at late 2025, we saw the EUR/USD get stuck below the 1.1550 level as everyone waited for guidance from the Fed and ECB. This kind of consolidation before major news creates specific opportunities for derivative traders. The key takeaway from that period was the market’s indecision, which signaled that a significant move was coming. In these situations, the primary strategy is to position for a breakout in volatility rather than a specific direction. Traders should consider buying options, such as straddles or strangles, which profit from a large price swing regardless of whether it is up or down. The goal is to own the potential for movement before the central bank announcements release the market’s pent-up energy. The technical levels mentioned were critical triggers for options traders back then. A move above the 1.1569 resistance would have been a clear signal to favor call option strategies, while a break below support at 1.1473 would have favored puts. These levels acted as clear lines in the sand for positioning for the post-announcement trend. Today, on March 18, 2026, we see a different picture with the pair trading much lower, around 1.0830. Recent data shows Eurozone inflation holding stubbornly at 2.6% while the latest US CPI came in at 2.9%, keeping both the ECB and Fed under pressure. This continued policy divergence suggests that even small surprises in upcoming statements could spark significant volatility from current levels. Given that currency market volatility has been relatively compressed in early 2026, options pricing may offer good value for traders anticipating a breakout in the coming weeks. We should be looking at the calendar for the next central bank meetings and key inflation reports as catalysts. The lesson from 2025 is that positioning for the event itself is often more profitable than trying to guess the direction beforehand.

Start trading now – Click here to create your real VT Markets account

FXStreet data shows gold prices in India declined, with the metal trading lower during Wednesday

Gold prices in India fell on Wednesday, based on data compiled by FXStreet. Gold was priced at INR 14,888.97 per gram, down from INR 14,941.65 on Tuesday. The price per tola fell to INR 173,662.40 from INR 174,276.40 a day earlier. Other listed rates were INR 148,890.00 for 10 grams and INR 463,106.90 per troy ounce.

How FXStreet Calculates India Gold Prices

FXStreet derives India gold prices by converting international prices using USD/INR and applying local units. The figures are updated daily at publication time and are for reference, as local prices may vary. Central banks hold the largest gold reserves and were reported to have added 1,136 tonnes worth about $70 billion in 2022, according to the World Gold Council. This was the highest annual total since records began, with emerging economies such as China, India and Turkey increasing reserves. Gold is described as inversely linked to the US Dollar and US Treasuries, and also inversely linked to risk assets. Price moves are linked to geopolitical risk, recession fears, interest rates, and shifts in the US Dollar because gold is priced in dollars (XAU/USD). We’ve seen a minor dip in gold prices today, but this short-term noise is less important than the metal’s role as a safe haven. This slight pullback could be a valuable entry point for traders positioning for the coming weeks. The underlying factors supporting gold remain very strong.

Outlook For Gold And Trading Strategy

The market is anticipating that the U.S. Federal Reserve may begin cutting interest rates later this year as global economic growth shows signs of slowing. Historically, lower interest rates weaken the US dollar, which is typically good for gold. We’ve already seen the Dollar Index fall nearly 2% since the beginning of 2026, creating a favorable environment for the metal. We must also consider the consistent buying from central banks, which provides a solid floor for the price. Looking back from 2025, we saw them buy a record 1,136 tonnes in 2022, and reports from the World Gold Council showed this intense demand continued through 2023 and 2024. This trend of diversifying away from the dollar by official institutions is a powerful long-term signal. With inflation still hovering above the 2% target in many major economies, gold’s appeal as a hedge remains high. Geopolitical uncertainty also continues to drive investors towards safety. For derivative traders, these factors suggest that betting on price increases is the logical path forward. Therefore, buying call options that expire in the next three to six months looks like a sensible strategy. This approach allows traders to benefit from expected price gains while limiting downside risk to the premium paid. A continued weakening of the dollar should be seen as a key indicator to increase these bullish positions. Create your live VT Markets account and start trading now.

Start trading now – Click here to create your real VT Markets account

FXStreet figures show Malaysian gold prices decreased, with data indicating a fall reported midweek in Malaysia

Gold prices in Malaysia fell on Wednesday, based on FXStreet data. Gold was priced at MYR 627.56 per gram, down from MYR 629.52 on Tuesday. The price per tola dropped to MYR 7,319.79 from MYR 7,342.64 a day earlier. Other listed rates were MYR 6,275.64 for 10 grams and MYR 19,519.49 per troy ounce.

Malaysia Gold Price Methodology

FXStreet derives Malaysia’s gold prices from international rates using the USD/MYR exchange rate and local units. Prices are updated daily at the time of publication and are for reference, with local rates able to differ slightly. Central banks hold the most gold and added 1,136 tonnes worth about $70 billion in 2022, according to the World Gold Council. This was the highest annual purchase since records began, with China, India and Turkey among the countries increasing reserves. Gold often moves inversely to the US Dollar and US Treasuries, and can also move opposite to risk assets such as shares. Prices can also react to geopolitical events, recession fears, and changes in interest rates, and are influenced by the US Dollar because gold is priced in dollars (XAU/USD). Given the minor dip in gold prices today, March 18, 2026, we see this not as a sign of weakness but as a temporary fluctuation. The real drivers for gold are tied to expectations for the US economy and Federal Reserve policy. The market is currently pricing in at least two interest rate cuts by the end of this year, a significant shift that supports a bullish outlook for non-yielding assets.

Strategy And Market Outlook

Looking back, we remember the trend from 2025 where central banks continued their aggressive gold purchases, adding over 1,030 tonnes to global reserves according to World Gold Council data. This consistent buying from institutions provides a strong floor under the market, limiting the potential downside of any price corrections. We see this institutional demand as a key stabilizing force that is likely to absorb near-term selling pressure. This environment, marked by slowing economic growth forecasts and sticky inflation around 2.7%, creates uncertainty that is increasing gold’s appeal as a safe-haven asset. Implied volatility on gold options has been creeping up from its 2025 lows, suggesting traders are preparing for a larger price move in the coming months. Therefore, simply holding futures may not be the most capital-efficient strategy. We believe traders should consider purchasing long-dated call options, such as those expiring late in the fourth quarter of 2026, to position for a significant rally when rate cuts become a reality. To offset the premium cost, one could look at selling shorter-term, out-of-the-money puts, capitalizing on the underlying support from central bank buying. This strategy positions for upside while defining risk. Furthermore, gold’s inverse correlation with risk assets is becoming more pronounced. The S&P 500 has struggled to find direction in the first quarter of 2026 amid concerns over corporate earnings in a slowing economy. As capital flows out of equities seeking safety, we anticipate gold will be a primary beneficiary. Create your live VT Markets account and start trading now.

Start trading now – Click here to create your real VT Markets account

AUD/JPY edges higher near 113.00 in Europe, buoyed by RBA hike and hawkishness, targeting 113.50 resistance

AUD/JPY edged up to about 113.00 in early European trade on Wednesday after the Reserve Bank of Australia raised rates and maintained a hawkish stance. The RBA lifted the Official Cash Rate by 25 bps to 4.10% at its March meeting, following a similar move in February and marking the first back-to-back rises since mid-2023. Governor Michele Bullock said prices remained too high, and the board was concerned about second-round effects from higher energy costs linked to the Middle East conflict. Focus now turns to Australia’s February jobs figures due on Thursday, with the Unemployment Rate forecast to hold at 4.1%.

Middle East Risk And Safe Haven Demand

Middle East developments are also being watched for their impact on safe-haven demand. The BBC reported that Iranian security chief Ali Larijani was killed in Israeli air strikes, and Iranian army chief Amir Hatami said Iran would launch a decisive and regrettable retaliation. On the chart, AUD/JPY stays above the 100-day exponential moving average near 106.40, with RSI in the low 60s. Resistance sits at 113.70 and 113.80, with 115.00 next, while support is at 111.40, 110.15–110.35, and 108.70. With the Reserve Bank of Australia hiking rates to 4.10%, we see a clear signal of strength for the Aussie dollar. This is the second consecutive rate increase, reinforcing a hawkish stance not seen since mid-2025. This policy divergence strongly favors the AUD over the Japanese Yen, making long positions in AUD/JPY attractive. The RBA’s worry about inflation is well-founded, given the recent spike in energy costs from the Middle East conflict. We saw a similar situation back in 2022 when the conflict in Eastern Europe pushed WTI crude oil prices above $120 per barrel, showing how quickly geopolitical events can fuel inflation. This history supports the RBA’s decision to act now, which should continue to prop up the Aussie. However, the escalating tension in the Middle East presents a significant risk to this trade. The killing of an Iranian security chief and vows of retaliation are driving safe-haven demand directly into the Japanese Yen. Derivative traders should consider hedging long AUD positions with puts, as a full-blown conflict could quickly unwind recent gains.

Key Catalyst Australia Jobs Data

This week’s Australian employment data is the next major catalyst. An unemployment rate holding at the expected 4.1% would confirm the labor market is resilient enough to handle higher interest rates, giving the RBA more room to hike. This figure remains low compared to historical averages, showing the economy is still on solid footing despite the global pressures we’ve seen build since 2025. From a technical standpoint, the pair’s momentum is strong, suggesting buying call options is a viable strategy. With the price holding firmly above the 100-day average near 106.40 and RSI staying below overbought levels, there appears to be more room to run. A clean break above the 113.80 resistance level could open a path toward the 115.00 psychological mark. For risk management, the 111.40 level serves as an initial floor for the current uptrend. A break below this support might be a signal to tighten stops or reduce long exposure. The most critical level to watch is the 108.70 area, as a drop below this would threaten the entire bullish structure we’ve seen build over recent months. Create your live VT Markets account and start trading now.

Start trading now – Click here to create your real VT Markets account

Dividend Adjustment Notice – Mar 18 ,2026

Dear Client,

Please note that the dividends of the following products will be adjusted accordingly. Index dividends will be executed separately through a balance statement directly to your trading account, and the comment will be in the following format “Div & Product Name & Net Volume”.

Please refer to the table below for more details:

Dividend Adjustment Notice

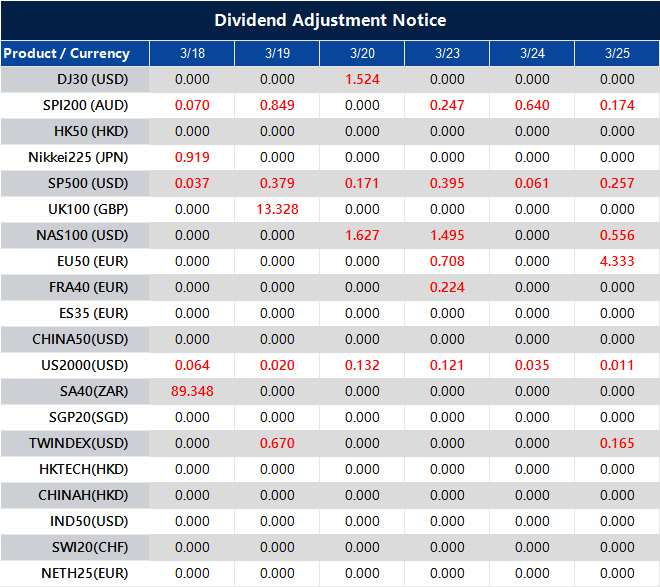
The above data is for reference only, please refer to the MT4/MT5 software for specific data.

If you’d like more information, please don’t hesitate to contact [email protected].

Dollar Slips as Oil Eases and Risk Appetite Returns

Key Points

  • USDX trades near 99.26, down -0.03%, extending its recent pullback.
  • Easing oil prices have supported risk appetite, weighing on safe-haven demand for the dollar.
  • Markets now focus on Federal Reserve and global central bank meetings for policy direction.

The U.S. dollar softened on Wednesday, giving back some of its recent safe-haven gains as oil prices eased and market sentiment improved ahead of a pivotal week for global central banks.

The US Dollar Index (USDX) is trading near 99.26, down -0.03%, marking a third consecutive session of declines. The move follows a strong rally last week that pushed the dollar to a 10-month high, driven by escalating geopolitical tensions and surging energy prices.

However, with oil prices pausing and pulling back modestly, markets have begun to reintroduce risk exposure, reducing demand for the dollar.

If oil continues to stabilise or decline, the dollar may face further short-term pressure as risk sentiment improves.

Oil Pullback Eases Safe-Haven Demand

The key driver behind the dollar’s recent weakness has been the easing in oil prices. Crude declined after Iraqi and Kurdish authorities agreed to resume exports via Turkey’s Ceyhan port, helping to ease immediate supply concerns.

While Brent crude remains above $100 per barrel, the pause in its upward momentum has been enough to shift market positioning, at least temporarily.

Lower oil prices can reduce inflation fears and ease pressure on global growth, encouraging traders to move away from defensive assets like the U.S. dollar.

If oil resumes its upward trend, safe-haven demand for the dollar could return quickly.

Central Banks Take Centre Stage

Markets are now firmly focused on a series of central bank meetings, starting with the Federal Reserve, followed by the European Central Bank, Bank of England, and Bank of Japan.

All are widely expected to keep interest rates unchanged, but traders will be closely watching for forward guidance, particularly regarding inflation and growth risks stemming from the ongoing Middle East conflict.

The key question for policymakers is whether the energy shock will primarily slow economic activity or lead to more persistent inflation.

A more hawkish tone from central banks could limit further dollar weakness, while a cautious or balanced outlook may support risk assets and weigh on the greenback.

Technical Analysis

The US Dollar Index (USDX) is trading near 99.26, marginally lower on the session (-0.03%), as the recent recovery rally begins to lose momentum just below the psychological 100 level. After rebounding strongly from the 95.33 low, the dollar has entered a phase of consolidation, suggesting the market is reassessing directional conviction.

From a technical standpoint, short-term momentum is starting to soften. The 5-day moving average (99.52) has begun to turn lower, while the 10-day (99.17) sits just beneath current price, acting as near-term support.

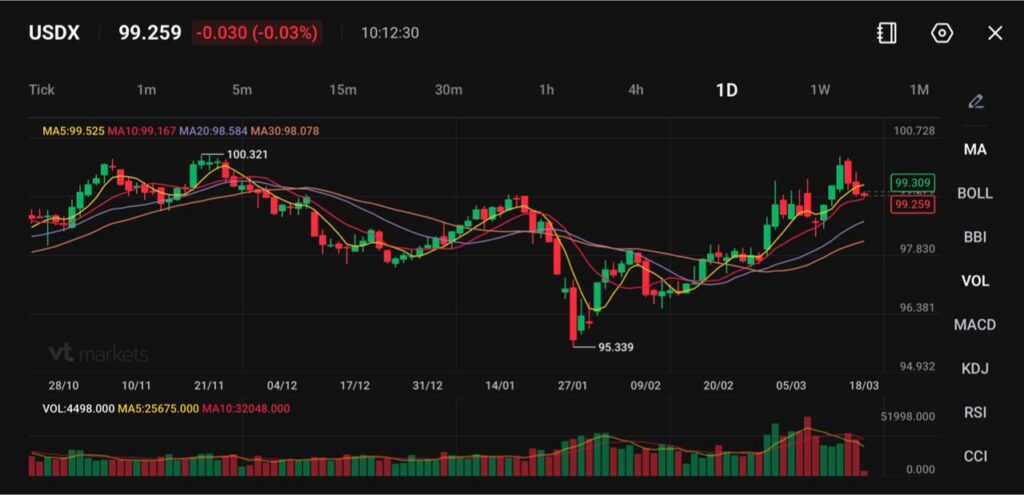
The 20-day (98.58) and 30-day (98.08) remain upward sloping, indicating that the broader recovery structure is still intact despite the current pause.

Immediate support is seen around 99.00–99.10, with a break below this zone potentially exposing downside toward 98.50, where the 20-day average aligns.

On the upside, resistance is firmly positioned at 100.30–100.70, a region that has repeatedly capped bullish attempts and remains a key barrier for further upside continuation.

Overall, the USDX appears to be consolidating below major resistance, with the broader bias still constructive following its recovery from February lows.

However, failure to reclaim the 100 level may lead to further sideways movement or a modest pullback, especially if macro catalysts—such as shifting rate expectations—begin to weigh on dollar strength.

What Traders Should Watch Next

The dollar now sits at a crossroads between geopolitical risk and improving sentiment. Key drivers to monitor include:

  • Movements in oil prices, particularly whether Brent holds above $100
  • Outcomes and guidance from major central bank meetings
  • Developments in the Middle East conflict
  • Currency moves in USDJPY and EURUSD

For now, the dollar’s pullback appears to be a reaction to easing oil prices rather than a full reversal, with broader trends still dependent on how geopolitical and macroeconomic risks evolve.

Learn more about trading Indices on VT Markets today.

FAQs

Why is the US Dollar Falling Today?

The US dollar is weakening because oil prices have eased, reducing safe-haven demand and allowing investors to shift back into risk assets ahead of central bank decisions.

What is Causing USD Weakness Right Now?

A combination of lower oil prices, improved market sentiment, and positioning ahead of central bank meetings is putting short-term pressure on the dollar.

Is the Dollar Still in an Uptrend?

Yes, the broader trend remains supported by geopolitical risks and earlier safe-haven demand. However, the current pullback suggests a short-term correction or consolidation phase.

How Do Oil Prices Affect the US Dollar?

Rising oil prices tend to support the dollar due to its safe-haven status and the U.S. being a net energy exporter. When oil falls, this support weakens, and the dollar can decline.

Why is the Yen Strengthening Against the Dollar?

The yen is gaining as risk sentiment improves and as USDJPY moves away from the 160 level, where markets had expected potential intervention from Japanese authorities.

Why is the Euro Rising Against the Dollar?

The euro is strengthening ahead of the European Central Bank meeting, as traders position for policy guidance and potential shifts in inflation outlook.

What Are Markets Expecting From the Federal Reserve?

Markets widely expect the Federal Reserve to keep interest rates unchanged, but are focused on forward guidance regarding inflation and future rate cuts.

Start trading now – Click here to create your real VT Markets account

Back To Top
server

Hello there 👋

How can I help you?

Chat with our team instantly

Live Chat

Start a live conversation through...

  • Telegram
    hold On hold
  • Coming Soon...

Hello there 👋

How can I help you?

telegram

Scan the QR code with your smartphone to start a chat with us, or click here.

Don’t have the Telegram App or Desktop installed? Use Web Telegram instead.

QR code