EUR/USD was steady after two days of losses, trading near 1.1690 in Asian hours on Tuesday. It slipped below 1.1700 and is testing support at the 50-day EMA near 1.1682.
Price action is near the lower boundary of an ascending channel, which can point to a bearish reversal if that boundary gives way. The pair is just above the 50-period EMA but remains below the nine-period EMA, suggesting consolidation.
Neutral Momentum Signals
The 14-day Relative Strength Index is near 50, indicating neutral momentum. This follows a recent recovery that has not yet developed into a clear direction.
If EUR/USD breaks below the channel, it may face downward pressure towards the nine-month low of 1.1411, set on March 13. Support is focused around 1.1682, where the 50-day EMA meets the channel base.
On the upside, the first barrier is the nine-day EMA at 1.1706. A break above it could open the way to 1.1849, the 11-week high from April 17, then the channel top near 1.1960, and later 1.2082, the highest since June 2021, reached on January 27.
Looking back at the analysis from this time in 2025, we saw the EUR/USD pair in a tight consolidation around the 1.1700 level. The market was testing its 50-day moving average, and overall momentum was neutral. This suggested a period of indecision for traders at that point.
Shift In Macro Drivers
Today, the situation has changed significantly, with the pair trading much lower near 1.0850. The primary driver is now a clear policy divergence, as the European Central Bank has begun cutting rates while the Federal Reserve signals it will hold rates higher for longer. This contrasts sharply with the technical consolidation we observed last year.
Current statistics reinforce this bearish pressure, with Eurozone inflation now at 2.4% while US inflation remains more persistent at 3.5%. This growing interest rate differential in favor of the US dollar suggests the path of least resistance for the pair remains downwards. We are seeing this reflected in derivatives pricing, which is skewed towards further euro weakness.
For the coming weeks, traders should consider strategies that benefit from this downward momentum. Buying put options with a strike price around 1.0750 offers a way to profit from a continued decline while clearly defining risk. A bear put spread could also be used to lower the upfront cost of positioning for a drop.
Given the potential for sharp moves around upcoming economic data releases, those expecting a spike in volatility could implement long strangles. This involves buying an out-of-the-money put and an out-of-the-money call option, a strategy that profits from a large price swing in either direction. This is a pure volatility play, reflecting the current market uncertainty.
The levels we watched in 2025, such as the support near 1.1682 and the high of 1.1849, are now distant memory and serve as major long-term resistance. The market’s focus has shifted substantially lower, with any rallies toward the 1.1000 level now viewed as selling opportunities. That previous ascending channel has clearly been broken for some time.
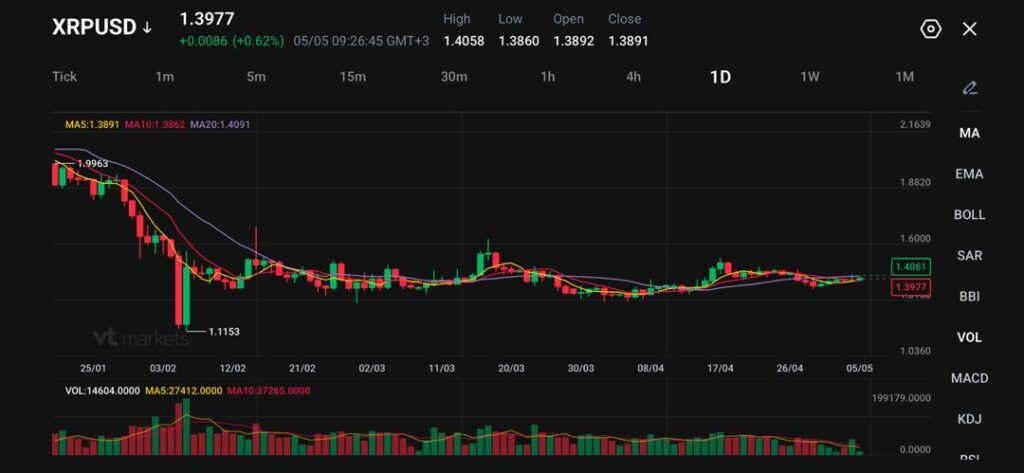
XRP/USD traded at 1.3977, up 0.0086, or 0.62%, with a session high of 1.4058.
XRP is currently trading near $1.40, up about 1.55% on the day and roughly 7% over the past month, but down 32% over the past year.
Ripple’s stronger presence at Bitcoin Conference 2026 has helped draw attention from traders who had previously avoided XRP.
The chart remains mixed, with XRP above the 5-day and 10-day moving averages but still below the 20-day moving average at 1.4091.
XRP is gaining fresh attention as sentiment around Ripple and the XRP Ledger improves. Bitcoin Conference 2026 was not only a Bitcoin event in market terms. Ripple had a clear presence, and several reports said XRP attracted interest from traders who had previously kept their distance from the token.
Jake Claver, chairman of Digital Ascension Group, said on the Good Evening Crypto podcast that longtime Bitcoin holders were starting to look at XRP and move money into its ecosystem. His view is that XRP does not need the CLARITY Act to trigger its next price move because legal and regulatory progress has already shifted the market structure around the token.
XRP RALLY MAY NOT NEED CLARITY ACT$XRP's price appreciation does not depend on the CLARITY Act clearing Congress, Jake Claver, Chairman of Digital Ascension Group, says.
Speaking on the Good Evening Crypto podcast with host Abdullah Nassif, he argued that the groundwork for a… pic.twitter.com/WbA3pOnOue
That matters because XRP has often traded less on pure crypto momentum and more on regulatory clarity, institutional use cases, and Ripple-specific headlines. The latest shift suggests traders are beginning to treat XRP less as a legal overhang story and more as a payments, settlement, and tokenisation infrastructure trade.
Regulation Is No Longer The Same Drag
The legal cloud over XRP has eased. The SEC concluded its lawsuit against Ripple Labs in August 2025, with Ripple paying a $125 million fine. The ruling kept an injunction on XRP sales to institutional traders, but it maintained that XRP sales on public exchanges did not fall under securities law.
That distinction still matters for institutions. It does not remove every regulatory question, but it gives the market a cleaner framework than the one XRP faced during the lawsuit years. The SEC also issued broader crypto-asset guidance in March 2026, saying it aimed to clarify how federal securities laws apply to certain crypto assets and transactions.
Claver argues that the SEC and CFTC have already done enough groundwork for XRP to move without Congress passing the CLARITY Act. Traders should treat that as a market view rather than a settled universal fact. The key point is that regulatory momentum now looks less hostile than it did during the lawsuit period, which can support capital inflows if the wider crypto market stays firm.
Institutional Use Case Keeps The XRP Story Alive
Ripple’s core pitch remains payments, liquidity, settlement, and tokenisation. Ripple said in March 2026 that fintech firms had adopted Ripple Payments to address liquidity and payments challenges, while the company continued to build around stablecoin and cross-border payment infrastructure.
Ripple President Monica Long has also framed 2026 as a year of institutional adoption at scale. Ripple’s own 2026 outlook said collateral mobility could become a leading institutional use case, with custodian banks and clearing houses adopting tokenisation to modernise settlement. It also said 5% to 10% of capital markets settlement could move onchain.
🚨#Ripple President Monica Long: Dozens of major U.S. banks are now actively asking about #Ripple Custody. The floodgates are opening. Institutions are moving in.$XRP WILL BRIDGE IT!✅🏦 pic.twitter.com/2DqliC2wPg
This helps explain why XRP is drawing attention even while it remains down 32% over the past year. The market is trying to decide whether XRP is still a lagging token from an earlier cycle, or whether regulatory clarity and institutional settlement demand can rebuild its premium.
Technical Analysis
XRPUSD is trading near 1.398, moving sideways after stabilising from the sharp drop earlier in the year, with price now consolidating within a tight range. The broader structure shows a clear transition from a strong downtrend into range-bound behaviour, with neither buyers nor sellers in firm control.
From a technical standpoint, momentum is neutral and compressed. Price is hovering around the 5-day (1.389) and 10-day (1.386) moving averages, both flattening out and offering little directional bias. The 20-day (1.409) sits just above current price, acting as near-term resistance and capping upside attempts.
Key levels to watch:
Support: 1.386 → 1.320 → 1.115
Resistance: 1.406 → 1.450 → 1.600
Price is currently pressing into the 1.406 resistance zone, which aligns with the 20-day moving average. A sustained break above this level could signal a shift in momentum and open a move toward 1.45, with further upside possible if buyers gain traction.
On the downside, 1.386 is acting as immediate support, and a break below this level would likely keep price trapped within the broader range, with downside risk toward 1.32 if selling pressure builds again.
Overall, XRP is consolidating after a prolonged decline, with price compressing between key moving averages. A breakout beyond 1.406 or below 1.386 will likely determine the next directional move.
Market Implications
XRP’s setup is improving, but it remains early. The token has gained about 1.55% on the day and roughly 7% over the past month, yet the 32% decline over the past year shows that confidence has not fully returned.
A break above 1.4091 would give bulls a cleaner signal and could attract momentum traders back toward 1.6000. A failure near the 20-day moving average would keep XRP trapped in a low-conviction range, especially if broader crypto sentiment cools.
The cautious forecast favours sideways-to-positive trading while XRP holds above 1.3860. Stronger upside needs a daily close above 1.4091 with better volume. If regulatory optimism fades or Bitcoin-led risk appetite weakens, XRP could slip back toward 1.3860 first, then 1.1153 if sellers regain control.
Create a live VT Markets account today to access our platform features, including market insights and educational content.
Trader Questions
What Is XRP Trading At Today?
XRP/USD is trading at 1.3977, up 0.0086, or 0.62%. The session high stands at 1.4058, with a low of 1.3860, an open at 1.3892, and a close at 1.3891.
Why Is XRP Drawing Investor Attention?
XRP is drawing investor attention because sentiment around Ripple and the XRP Ledger appears to be improving. Ripple had a visible presence at Bitcoin Conference 2026, and investors who had previously avoided XRP are now looking more closely at the token.
Jake Claver, chairman of Digital Ascension Group, said longtime Bitcoin holders were starting to move money into the XRP ecosystem.
Why Was Ripple At Bitcoin Conference 2026 Important?
Ripple’s presence at Bitcoin Conference 2026 mattered because it helped put XRP in front of a wider crypto audience. The event was centred on Bitcoin, but XRP still attracted attention from investors watching institutional adoption, payments, and tokenisation.
That shift suggests XRP is no longer being viewed only through its past legal issues.
Does XRP Need The CLARITY Act To Rise?
XRP may not need the CLARITY Act to rise if investors believe enough regulatory groundwork is already in place. Jake Claver argued that XRP’s next move does not depend on Congress passing the CLARITY Act.
Some market watchers still see the CLARITY Act as an important catalyst, but Claver’s view is that execution matters more than new legislation.
How Has XRP Performed Recently?
XRP is trading near $1.40, up about 1.55% on the day and roughly 7% over the past month. Over the past year, however, XRP is still down 32%.
That mix shows improving short-term sentiment, but the longer-term chart still needs stronger confirmation.
Start trading now – Click here to create your real VT Markets account
New Zealand’s ANZ commodity price index fell to -0.8% in April. This was down from a 4.1% rise in the previous period.
The change shows commodity prices moved from growth into decline over the month. The data compares April’s result with the earlier 4.1% figure.
Commodity Prices Reverse Into Decline
The recent commodity price data for April shows a sharp reversal, falling from a 4.1% gain to a 0.8% loss. This abrupt shift suggests a decline in export earnings and is a bearish signal for the New Zealand dollar. We are now looking for opportunities to position for further weakness in the NZD against major currencies.
This downturn is consistent with recent softer manufacturing PMI data out of China, which fell to 49.8, indicating a contraction and reduced demand for our goods. Adding to this, the latest Global Dairy Trade auction showed a 2.9% fall in the price index, confirming the downward pressure on our key exports. This external environment makes a quick rebound in commodity prices unlikely in the coming weeks.
In response, we see value in buying NZD/USD put options with expiries in the next four to six weeks to capture potential downside. For those with higher conviction, shorting NZD futures contracts offers a more direct approach. The sharp reversal also suggests implied volatility may rise, so we are monitoring for opportunities there.
We also favor a long AUD/NZD position, as Australia’s exposure to hard commodities like iron ore currently seems more resilient than our soft commodity basket. This is similar to the trend we saw in late 2025 when weakening global demand disproportionately affected New Zealand’s export mix. Back then, the AUD/NZD cross rallied significantly over the following quarter.
Implications For RBNZ Policy Outlook
This price shock significantly alters the outlook for the Reserve Bank of New Zealand’s monetary policy. While Q1 2026 inflation remained sticky at 4.1%, this new data gives the central bank a clear reason to adopt a more dovish tone. We will be watching for shifts in the interest rate swap market that price out any chance of a hike this year.
IMF managing director Kristalina Georgieva said inflation is already rising, and the global economy could face a “much worse outcome” if the Middle East war continues into 2027. Reuters reported her comments on Tuesday.
She set out a scenario in which oil prices reach about $125 a barrel by 2027. She said this could push inflation higher.
Oil Prices And Inflation Risks
Georgieva said the IMF’s “adverse scenario” was already in effect, as the conflict continued and oil was forecast at around or above $100 per barrel. She linked this to rising inflationary pressures.
She said long-term inflation expectations remained anchored and financial conditions were not tightening. She said this could change if the war continues.
She said that if oil reaches $125 a barrel, inflation would climb and inflation expectations could become de-anchored. She warned this would worsen the overall economic outcome.
The warning we received from the IMF back in 2025 is no longer a distant forecast. With the Middle East conflict dragging on and oil prices firming up, we are now living within the early stages of that “adverse scenario.” Traders should be positioning for this ongoing reality, as the conditions for a much worse outcome are beginning to materialize.
Positioning For Higher For Longer
We are seeing Brent crude futures for July delivery push past $110 a barrel, a significant increase driven by recent escalations near key shipping lanes. This makes long positions in crude futures and call options on energy ETFs a direct way to trade the ongoing tension. The path to the feared $125 target now seems increasingly clear if the geopolitical situation does not improve.
Last month’s Core CPI data, which came in at an annualized 4.2%, confirms that inflation is becoming entrenched, just as was warned. The Federal Reserve has signaled a more hawkish stance, effectively pricing out rate cuts for 2026 and reinforcing bets against interest rate futures. We should consider using put options on long-duration bond ETFs to profit from the inevitable rise in yields.
This broader uncertainty is reflected in the VIX index, which has been holding above the 25 level, a clear signal of market stress not consistently seen since late 2025. This environment suggests an increasing need for portfolio protection. Buying put options on major indices like the S&P 500 is a prudent move to hedge against the economic friction caused by high energy prices and inflation.
The critical risk we discussed last year, that inflation expectations would start de-anchoring, is now becoming the market’s central focus. The derivatives market is beginning to price in a “higher for longer” interest rate environment that could extend well into 2027. This shift means that strategies expecting a quick return to normal economic conditions are facing significant headwinds.
AUD/USD fell for a second day, trading near 0.7160 in Asian hours on Tuesday. Markets expected the Reserve Bank of Australia to raise rates later in the day, with ASX 30 Day Interbank Cash Rate Futures for May 2026 at 95.745 on 1 May, implying a 74% chance of a move to 4.35%.
The pair weakened as the US dollar strengthened on safe-haven demand after Iran attacked the United Arab Emirates. CNBC reported the UAE was targeted by Iranian drones and missiles, while the US said it destroyed Iranian boats in the Strait of Hormuz.
Geopolitical Risk And Safe Haven Flows
US President Donald Trump said Iran would be “blown off the face of the earth” if it targets US ships protecting commercial vessels in the Strait. Iran’s Foreign Minister Abbas Araghchi said the situation shows “clearly that there is no military solution to a political crisis,” and wrote on X, “Project Freedom is Project Deadlock.”
Minneapolis Fed President Neel Kashkari said additional US rate rises cannot be ruled out. He cited inflation risks linked to higher energy prices connected to the Iran conflict.
The Aussie dollar is caught between our own Reserve Bank’s expected rate hike and a surging US dollar. The safe-haven demand stemming from the Iran conflict is currently the dominant force, pushing the pair down despite a 74% probability of a rate increase to 4.35%. This fundamental conflict suggests volatility will be the main theme for the coming weeks.
We must focus on the Strait of Hormuz, as any disruption there directly threatens global energy supply and drives up oil prices. Historically, even minor incidents in the strait have caused significant price jumps; for instance, we saw Brent crude spike over 4% in a single day during similar tensions back in mid-2019. This scenario supports the US dollar as it fuels global inflation fears and reinforces the Federal Reserve’s hawkish stance.
Given the high degree of uncertainty, we should prepare for sharp price swings across asset classes, not just in currencies. The CBOE Volatility Index (VIX), which we saw jump above the 30-point mark during the onset of the Ukraine conflict a few years ago in 2022, is a key indicator to watch for signs of market stress. Derivative strategies that can profit from rising volatility, such as buying straddles on the AUD/USD, should be considered.
Managing Risk In A Volatile Macro Backdrop
We should remember that the AUD is a risk-sensitive currency that typically weakens during global turmoil. Despite our strong commodity exports, the initial flight to the safety of the US dollar often dominates market flows, as we observed during the market panic in early 2020. Therefore, buying put options on the AUD/USD could serve as an effective hedge against a further escalation of the Middle East conflict.
NZD/USD traded around 0.5865–0.5860 in the Asian session on Tuesday, with selling pressure for a third day. The pair pulled back from 0.5925, a two-week high and a horizontal resistance level.
Geopolitical tensions supported the US Dollar. Donald Trump said on Fox News on Monday that Iran would be “blown off the face of the earth” if it attacks US vessels involved in Project Freedom in the Strait of Hormuz.
Geopolitical Tensions Lift The Dollar
The UAE said its air defences engaged missile attacks and incoming drones from Iran. Limited progress in US-Iran talks kept risk concerns in the market.
The US-Iran standoff pushed Crude Oil prices higher overnight, raising inflation concerns. This supported expectations of a more hawkish Federal Reserve and helped keep US Treasury yields elevated.
The Reserve Bank of New Zealand is expected to remain cautious or tighten policy to return inflation to the 2% midpoint. This could offer some support to the NZD and curb further declines.
Technically, repeated failures near the 0.5920–0.5925 zone point to downside risk, though last week’s hold below the 200-day SMA suggests waiting for follow-through selling. Markets are watching ISM Services PMI, JOLTS Job Openings, New Home Sales, and speeches from FOMC members.
Options Strategy For Downside Exposure
We are seeing a familiar pattern in NZD/USD, reminiscent of the dynamics from early 2025 when geopolitical tensions and a hawkish Fed boosted the US dollar. Those same forces appear to be at play again, creating headwinds for the pair. The current market environment suggests a defensive posture, as safe-haven flows are once again supporting the greenback.
Renewed tensions in the Strait of Hormuz are unsettling markets, mirroring the events of last year. This risk-off sentiment is being compounded by stubborn US inflation, with the latest CPI figures coming in at 3.1%, above forecasts. As a result, US 10-year Treasury yields are holding firm above 4.60%, underpinning dollar strength.
In contrast, the outlook for the New Zealand economy is softening, creating a clear policy divergence with the US. Weaker-than-expected GDP growth of just 0.2% last quarter has led markets to price in a potential rate cut from the RBNZ later this year. This makes the Kiwi dollar fundamentally less attractive than the higher-yielding US dollar.
Given this backdrop, we believe traders should consider buying NZD/USD put options to position for a move lower. A slide towards the 0.5750 level seems plausible in the coming weeks. This strategy provides a direct way to profit from downside momentum while defining risk to the premium paid.
With implied volatility rising due to the geopolitical uncertainty, outright puts can be expensive. A bear put spread, such as buying a 0.5800 put and simultaneously selling a 0.5650 put, could be a more cost-effective approach. This strategy would reduce the initial cash outlay and still offer solid profit potential if the pair declines as expected.
Last year, we saw the 0.5925 area act as a formidable resistance level, and the 0.5900 mark is proving to be a similar ceiling today. We will be watching for a decisive break below the recent low of 0.5810. Such a move would confirm the bearish trend and serve as a trigger to enter these downside positions.
GBP/JPY fell about 0.23% on Monday, with demand for the Japanese Yen weighing on the pair. It was trading at 212.72, near the 50-day Simple Moving Average (SMA) at 212.79.
Price action remains above the March 31 cycle low of 209.64. The pair has recently tested the 100-day SMA at 211.93 and the 50-day SMA at 212.79.
Key Technical Levels
A further drop would require a move below the 100-day SMA. The next levels are the March 16 daily low at 210.81 and the 209.64 cycle low from March 29.
If the pair rises above 213.00, it may test resistance at 214.01, the April 17 low. A further target sits at the 215.00 level.
We are seeing a familiar pattern in GBP/JPY following the recent suspected intervention by Japanese authorities that pushed the dollar back from the ¥170 level. This pullback mirrors the price action we digested back in 2025 when officials also stepped into the market. The pair is now consolidating after its sharp fall, presenting a crucial decision point for us.
The fundamental divergence between the UK and Japan suggests this weakness could be a buying opportunity. UK inflation remains stubbornly above target at 2.6% as of April 2026, keeping the Bank of England hawkish, while the Bank of Japan’s policy remains loose. We can use this dip to enter long positions, perhaps through call options to limit downside risk if intervention resumes.
Options Positioning And Risk
However, we must respect the risk of further official action, as the Ministry of Finance has shown it is serious about defending the yen. Looking back at the 2025 playbook, a sustained break below key long-term moving averages signaled a much deeper correction toward levels like 209.64. Traders should therefore consider buying protective put options to hedge long positions against another sudden drop.
Implied volatility in GBP/JPY has spiked significantly, making option premiums expensive but also creating opportunities. The high volatility makes selling out-of-the-money puts or calls attractive for collecting premium, assuming the pair will stabilize in a new range. This strategy is for those who believe the most violent moves are over for now.
Crude oil prices rose on Monday after falling last week. Brent moved back above $112 a barrel, while WTI climbed above $100 to about $103, with both making multi-percentage gains during the session.
Brent reached a new weekly high, while WTI stayed below its late-April peak near $107. Prices have risen about 50% since hostilities began in late February.
Escalation Risks In The Gulf
The UAE said it intercepted 12 ballistic missiles, three cruise missiles, and four drones launched from Iran. A fire at the Fujairah oil hub was linked to a drone strike.
The US expanded activity in the Strait of Hormuz through Project Freedom, involving guided-missile destroyers and more than 100 aircraft and unmanned platforms to escort neutral commercial vessels. Iran warned the US to stay out of Hormuz.
Reports said President Donald Trump rejected an Iranian proposal to reopen the strait in return for lifting a US blockade on Iranian ports. The blockade was reported to remain in place pending a broader nuclear deal.
Goldman Sachs estimated closures and attacks have removed about 14.5 million barrels per day from global supply, and the IEA called it the largest oil disruption on record. Goldman also estimated April demand may have been up to 3.6 million barrels per day below February, led by weaker jet fuel and petrochemicals.
We look back to the spring of 2025 when oil prices surged after Iran’s strike on the UAE and the subsequent US naval operations in Hormuz. That initial shock, which took Brent crude toward $120 a barrel, established a new, volatile trading range that we still live with today. Even now in May 2026, the market remains on edge, with every tanker movement in the Gulf closely watched.
Market Positioning And Demand Headwinds
The massive supply disruption from last year’s blockade has never been fully resolved, keeping global inventories tight. The US Strategic Petroleum Reserve is now sitting at its lowest level since 1983, meaning Washington has limited ability to cushion future price spikes. OPEC+ has also been cautious, maintaining production discipline to support prices around the current $98 a barrel level for Brent.
For derivative traders, this means implied volatility is likely to remain elevated, making option strategies like straddles potentially attractive to play sharp price swings. The Brent-WTI spread, which widened dramatically during the initial 2025 supply shock, continues to be a key trade as any fresh Middle East tension will hit seaborne crude pricing hardest. We should anticipate this spread to widen further on any news of renewed escalation in the Strait.
However, we must watch the demand side of the equation, which is showing signs of weakness after a year of high energy costs. Recent inflation data from the IMF shows global headline inflation remains stubbornly above 4%, largely driven by energy, which is beginning to slow economic activity. Any sign of a coordinated global slowdown could put a ceiling on prices, creating a risk for overly bullish positions.
Gold fell more than 2% on Monday as the US Dollar rose and US Treasury yields jumped. XAU/USD traded at $4,521 after a daily high of $4,639.
Risk aversion increased as the end of the ceasefire between the US and Iran approached. The US Navy began Operation Freedom to escort commercial ships through the Strait of Hormuz, and Iran launched attacks against the UAE and used speedboats to restrict sailing.
Geopolitical Tensions And Market Reaction
Donald Trump said “we’ve shut down seven small boats” to disrupt vessel movement. CNN reported that the US and Israel could resume attacks on Iran within the next 24 hours.
US equities fell, oil prices rose, and the US Dollar Index (DXY) gained over 0.25%. The DXY rebound took it from 97.97 to 98.46.
The US 10-year T-note rose six basis points to 4.432%, adding pressure to non-yielding gold. New York Fed President John Williams said policy is “well positioned” and that risks to both parts of the mandate have increased.
Markets put a 96% chance on no rate change at the June 17 Fed meeting, according to Prime Terminal. US Factory Orders rose 1.5% month-on-month in March versus 0.5% expected, up from 0.3% in February.
Options Strategy And Technical Setup
Upcoming data includes ISM Services PMI on Tuesday and US Nonfarm Payrolls. Technical levels include resistance at $4,600, the 100-day SMA at $4,764, and support at $4,500, $4,351, the 200-day SMA at $4,287, and $4,098, with $4,000 below.
Given the surging US Dollar and Treasury yields, the path of least resistance for gold appears to be downward in the short term. We should consider buying put options with strike prices below the $4,500 psychological level, targeting the March low of $4,351. The dollar’s dominance is clear as the DXY index breaks above 98.45, a direct result of the flight to safety.
However, the situation in the Strait of Hormuz is highly unpredictable, creating immense potential for price swings. This suggests that a long volatility strategy, such as buying a straddle on gold futures, could be profitable if tensions escalate or de-escalate suddenly. The VIX has already jumped to over 25 today, reflecting the market’s heightened anxiety not seen since the fourth quarter of 2025.
We saw a similar dynamic during the South China Sea naval standoff in late 2025, where the dollar initially rallied hard on risk aversion. In that instance, gold first dipped before finding its footing as a sustained store of value once the initial shock passed. This historical precedent suggests we should not rule out an eventual reversal in gold’s favor, especially if the conflict widens.
With new Fed Chair Kevin Warsh at the helm, the market is almost certain rates will remain on hold through June, with the CME FedWatch Tool now showing a 96% probability. This is a stark shift from just last month, when futures markets were still pricing in a 30% chance of a summer cut. The 10-year Treasury yield hitting 4.432% makes holding non-yielding bullion an expensive trade right now.
The technical picture shows gold trapped between its 200-day moving average at $4,287 and its 100-day average at $4,764. This defined range makes selling premium an attractive option for us. A bear call spread with a short strike above the $4,700 resistance area could capitalize on the struggling momentum while defining our risk.
NZD/USD traded near 0.5870 on Tuesday, pressured by broad US Dollar demand linked to risk-off conditions. The pair struggled to rise as safe-haven flows supported the US Dollar.
Sentiment stayed weak after reports of an alleged Iranian attack on US boats, though US officials denied the claims. The uncertainty reduced risk appetite and weighed on the New Zealand Dollar.
Key Data And Policy Focus
Markets are watching New Zealand employment data for clues on labour market conditions and the Reserve Bank of New Zealand policy outlook. US releases due this week include the ISM Services PMI and labour market indicators.
On the four-hour chart, NZD/USD traded at 0.5874 and kept a modest bearish bias. The 20-period SMA was 0.5882 and the 100-period SMA was 0.5884, with the RSI near 46.
Resistance sat at 0.5882, then 0.5884 and 0.5899, with a further level at 0.5954. Support was seen at 0.5868 and 0.5860, with a break below 0.5860 pointing to more downside.
We saw a similar setup back in 2025 when the NZD/USD was struggling around the 0.5870 level due to a strong US dollar and global uncertainty. That dynamic of safe-haven demand for the dollar overpowering the Kiwi is a recurring theme. The key drivers then were geopolitical nerves and the relative strength of the US economy.
Current Macro Backdrop
Today, on May 5, 2026, the story feels familiar even with the pair trading higher near 0.6050. The US Dollar Index (DXY) is currently holding firm above 105.50 after last month’s US inflation data came in hotter than expected at 3.1%, pushing back expectations of a Federal Reserve rate cut. This underlying dollar strength continues to put a ceiling on any significant Kiwi rallies.
In New Zealand, the picture is different as first-quarter inflation for 2026 cooled to 2.8%, which is now inside the RBNZ’s target band. This suggests the Reserve Bank of New Zealand may need to consider rate cuts sooner than the Fed, creating a policy divergence that favors the US dollar. This economic contrast is weighing on the NZD/USD pair’s ability to push higher.
Adding to this, ongoing trade tensions in the South China Sea are pushing investors toward the safety of the dollar. This backdrop of risk aversion limits the appeal of currencies tied to global growth, like the Kiwi. Broader market sentiment remains the primary driver, just as it was when reports of attacks surfaced in 2025.
For derivative traders, this suggests that selling NZD/USD call options with strike prices above the 0.6100 resistance level could be a viable strategy in the coming weeks. This approach allows us to collect premium while betting that the pair will struggle to rally significantly against the strong dollar and risk-off sentiment. The technical resistance we see today is reinforced by these fundamental factors.
Alternatively, buying put options with a strike near 0.6000 could offer a direct way to profit if upcoming US labor market data continues to show strength. This provides downside exposure if the dollar continues its run. This strategy would be a hedge against further weakness in the NZD, driven by the same fundamental pressures we observed in the past.