EUR/USD rose to about 1.1670 in early Asian trading on Wednesday, moving above 1.1650. The Euro strengthened against the US Dollar after US President Donald Trump agreed to a two-week ceasefire with Iran.
A White House official said Trump agreed to the two-week ceasefire on Tuesday, on the condition that Iran reopen the Strait of Hormuz. CNN reported that Israel also agreed to the ceasefire.
Ceasefire Developments And Market Focus
The announcement followed a proposal from Pakistan’s Prime Minister Shehbaz Sharif for a ceasefire to allow diplomatic talks between the US and Iran. Markets are watching developments around the ceasefire and wider Middle East tensions.
Later on Wednesday, attention turns to the minutes of the Federal Open Market Committee meeting. The minutes may provide detail on how officials assess the recent energy shock linked to Middle East conflicts.
Looking back at the events of 2025, we saw the EUR/USD spike above 1.1650 on the temporary US-Iran ceasefire news. That rally was a classic risk-on reaction, driven by the immediate relief of tensions in the Strait of Hormuz. The effect was short-lived, as the underlying disagreements were never resolved.
As of today in April 2026, the market has completely priced out that optimism, with EUR/USD having fallen back to a range around 1.0900. We’ve seen Brent crude prices creep back up, averaging over $92 per barrel in the first quarter of 2026, reflecting the renewed geopolitical risk premium. This sustained pressure on energy contrasts sharply with the brief dip we saw following the 2025 ceasefire announcement.
Positioning And Volatility Implications
The lesson from last year is that any diplomatic progress can cause sharp, but temporary, drops in volatility. We are seeing one-month implied volatility for EUR/USD options trading near 8.2%, up significantly from the lows of around 5.5% seen during that brief de-escalation period. Traders should consider buying options, such as straddles or strangles, to position for sharp moves in either direction as headlines continue to create uncertainty.
Last year, we noted the Federal Reserve was monitoring the energy shock, but their focus has since returned to domestic inflation and labor data. Recent inflation figures in the US for February 2026 came in at 2.8%, still stubbornly above the Fed’s target, limiting their ability to ease policy. In contrast, the European Central Bank remains more exposed to energy price volatility, creating a policy divergence that weighs on the euro.
Given this context, selling rallies in EUR/USD on any new, temporary peace headlines appears to be the prudent strategy. We can use last year’s spike to 1.1670 as a historical reference point for an extreme risk-on reaction. Using call credit spreads on the euro could be an effective way to collect premium while defining risk against another short-lived relief rally.
South Korea’s current account balance rose in February. It increased to 23.19B from 13.26B in the previous period.
Given the massive jump in South Korea’s current account surplus, we should anticipate continued strength in the Korean won. This surplus indicates a huge demand for the won from foreign trading partners. For the coming weeks, we will be looking at long positions on the KRW against the USD through futures or options contracts.
This economic strength is largely powered by a global recovery in semiconductor demand, with recent preliminary trade data for March 2026 showing chip exports are already up 18% year-over-year. The USD/KRW exchange rate has already broken below the key 1,280 support level on this news. We see a potential move towards 1,250 in the near term.
This trend also signals a bullish outlook for the Korean stock market, particularly export-heavy giants in the tech and auto sectors. We should consider buying call options or futures on the KOSPI 200 index. These companies are the direct beneficiaries of a strong export cycle and a favorable global economic backdrop.
The size of this surplus was a surprise, which means we can expect increased volatility in currency markets leading up to the release of the March data in early May. We could use straddles on the KRW to play a big move, as the market will be pricing in either a continuation of this powerful trend or a sharp reversion. This is a significant shift from what we saw last year in 2025, when the trade balance was far more unpredictable due to fluctuating global energy prices.
That prior uncertainty in 2025 kept many traders on the sidelines. The current stability and powerful export performance suggest a much clearer directional trend for us to follow. The strength of the economy also reduces the likelihood of an interest rate cut by the Bank of Korea, which provides a fundamental floor for the won’s value.
Donald Trump posted on Truth Social that he would suspend US bombing and attacks on Iran for two weeks. He said the pause followed talks with Pakistan’s Prime Minister Shehbaz Sharif and Field Marshal Asim Munir, and was subject to Iran agreeing to the COMPLETE, IMMEDIATE, and SAFE OPENING of the Strait of Hormuz.
He described the plan as a double sided CEASEFIRE and said US Military objectives had been met and exceeded. He said the US had received a 10 point proposal from Iran, and that a two week period would allow an agreement to be finalised.
Market Reaction And Key Price Moves
After the post, US equities rose, with the S&P 500 up over 1.50% and the Nasdaq 100 up more than 1.70%. Gold also rose over 1.50%, trading at around $4,770.
WTI fell more than 7.50%, dropping from around $108 to $101 per barrel. The US Dollar Index (DXY) extended losses, down 0.47% at 99.51 at the time of writing.
The article also explains market terms “risk-on” and “risk-off”, and lists assets and currencies that often move in each environment. It notes that safe-haven moves often involve bonds, Gold, the US Dollar, the Japanese Yen, and the Swiss Franc, while AUD, CAD, NZD, RUB, and ZAR tend to rise in risk-on periods.
The announcement of a two-week ceasefire has injected a strong “risk-on” sentiment into the market, but this is built on a very fragile foundation. The immediate sharp drop in WTI crude oil and the rally in equities reflect relief, yet the situation hinges entirely on negotiations over the next fourteen days. Derivative traders must position for the binary outcome of this period, where volatility is almost a certainty.
Given the immediate 7.50% drop in WTI crude, the implied volatility in oil options has likely surged. We should consider strategies like long straddles or strangles on oil futures, which profit from a large price move in either direction without betting on the outcome of the talks. The Strait of Hormuz, a chokepoint for nearly 20% of global petroleum liquids consumption, remains the key variable, meaning a deal failure would send prices soaring well above their previous levels.
Equities Volatility And Options Positioning
For equity indices like the S&P 500, the recent spike has likely crushed the CBOE Volatility Index (VIX), making options premiums cheaper. We saw a similar pattern after the initial Russia-Ukraine de-escalation talks back in 2022, where the VIX fell over 15% in a single week. Traders who believe the ceasefire will hold could sell put spreads on the SPX, collecting premium as fear continues to recede from the market.
The US Dollar Index’s decline signals a flight from safety, which benefits commodity currencies. We should look at proxy trades for risk appetite, such as going long the Australian Dollar against the Japanese Yen (AUD/JPY). Historically, this pair shows a strong positive correlation with the S&P 500, making it an effective way to trade the broader risk-on sentiment in the FX market.
The unusual rally in gold alongside equities, pushing it toward $4,800, suggests the market is pricing in a weaker US dollar and persistent inflation rather than seeking a traditional safe haven. US CPI data from last month showed core inflation remains stubbornly above 3.5%, a trend that a peace-driven economic boom could worsen. We can use options on gold futures (GC) to bet that this inflation hedge demand will continue, even if the geopolitical risk premium fades.
South Korea’s current account balance rose to 23.19B in February. This was up from 13.26B in the previous period.
The sharp rise in South Korea’s current account surplus is a strong bullish signal for the South Korean Won. This massive inflow of foreign currency puts direct upward pressure on the KRW against the US dollar. We should therefore consider positioning for a lower USD/KRW exchange rate in the coming weeks by buying Won call options or selling USD call options.
Trade Surplus Supports Equity Upside
This surplus is not an anomaly, as March’s preliminary trade data showed semiconductor exports surged by over 40% year-over-year, their eighth consecutive month of growth. A robust export sector directly boosts the earnings of major companies listed on the KOSPI index. This makes buying KOSPI 200 index futures an attractive trade to capture the broad market upside.
Such a strong external position gives the Bank of Korea more flexibility to keep interest rates firm to combat inflation, which is still hovering just above their 2% target. We remember how the BOK’s hawkish stance in late 2025 stabilized the currency during a period of global uncertainty. Therefore, the risk of a sudden dovish pivot that could weaken the Won appears low for now.
From an equity derivative standpoint, implied volatility on the iShares MSCI South Korea ETF (EWY) has been steadily declining. This makes buying call options on the ETF a cost-effective strategy to gain exposure to the strengthening Korean market. We see this as a better risk-reward than last year, when concerns over global supply chains in mid-2025 kept volatility elevated.
Donald Trump posted on Truth Social that the United States would suspend bombing and attacks on Iran for two weeks. He said the pause followed talks with Pakistan’s Prime Minister Shehbaz Sharif and Field Marshal Asim Munir, and was conditional on Iran agreeing to the “COMPLETE, IMMEDIATE, and SAFE OPENING” of the Strait of Hormuz.
Trump described the pause as a “double sided CEASEFIRE” and said US military objectives had been met. He also wrote that the US had received a 10 point proposal from Iran, and that many past disputes between the two countries had been agreed, with the two-week period intended to finalise an agreement.
Markets React To Ceasefire Headlines
After the post, risk appetite improved and US equities rose. The S&P 500 gained over 1.50% and the Nasdaq 100 rose more than 1.70%.
Gold climbed over 1.50% to around $4,770. WTI fell more than 7.50%, dropping from about $108 to $101 per barrel.
The US Dollar Index (DXY) extended losses by 0.47% to 99.51 at the time of writing.
We are seeing a significant drop in WTI crude oil because the potential reopening of the Strait of Hormuz eases major supply fears. This strait is a critical chokepoint; as recently as 2024, data showed it handled about 21 million barrels per day, or roughly 20% of global petroleum consumption. Given the fragile two-week nature of this ceasefire, we should look at options that profit from high volatility, as a snap-back is very possible if talks fail.
The sharp rally in the S&P 500 has likely crushed the Volatility Index (VIX), making protective options cheaper. We remember from the trade disputes back in 2019 how quickly positive sentiment could be reversed by a single message, causing volatility to spike from below 15 to above 20 in a matter of days. Buying VIX call options or puts on the SPY ETF now could serve as inexpensive insurance against this deal collapsing before the deadline.
Positioning For A Binary Two Week Outcome
We noticed that gold rallied alongside equities, which is explained by the dollar’s sharp decline, with the DXY falling below 100. Historically, a weaker dollar provides a strong tailwind for gold prices, a relationship we saw play out repeatedly during the high inflation years of 2021-2022. Any sign of the ceasefire failing would likely reverse this, strengthening the dollar as a safe haven and putting pressure on gold.
The central theme for the next two weeks is the temporary nature of this social media-announced ceasefire. The market is reacting as if peace is secured, but we should position for the binary outcome of the deadline. This suggests strategies like buying straddles or strangles on the most affected assets, like oil ETFs, to play the expected explosion in volatility rather than picking a definitive direction.
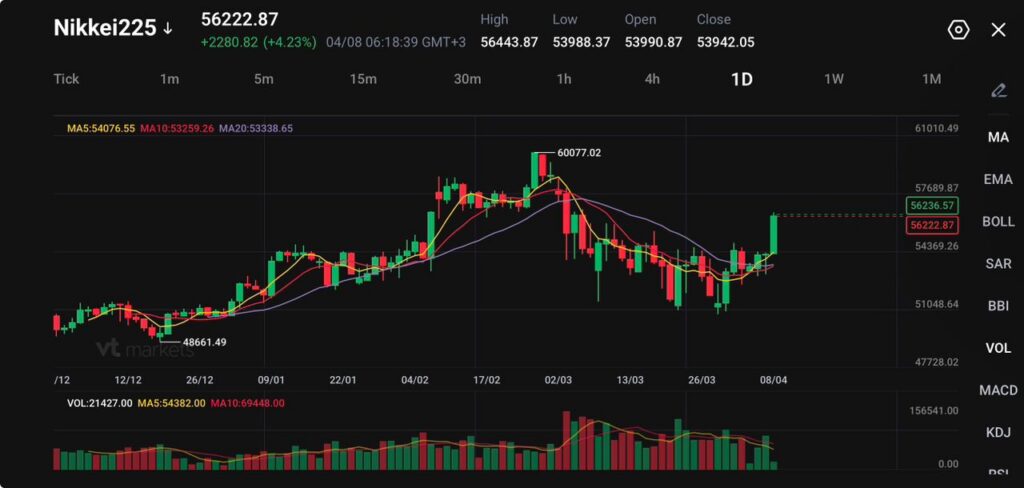
Nikkei 225 rose 4.96% to 56,078.83 in the morning session, while the broader move in the chart shows 56,222.87, up 2,280.82 (+4.23%).
A two-week ceasefire and a temporary reopening of the Strait of Hormuz triggered a relief rally across Asia and knocked back crude prices.
Japan posted a current account surplus of 3.933 trillion yen in February, above the 3.549 trillion yen forecast, with exports up 2.8% and imports up 9.7%.
Japanese equities jumped as traders rushed back into risk after the ceasefire announcement cut the immediate threat to Gulf energy flows. The Nikkei 225 rose 4.96% to 56,078.83 in the morning session, and the broader chart reading at 56,222.87 shows the strength of the rebound.
The move followed a sharp drop in crude after the United States and Iran agreed to a two-week ceasefire tied to safe passage through the Strait of Hormuz.
Lower oil is a direct tailwind for Japan. The country imports most of its energy, so a fall in crude reduces pressure on margins, cools imported inflation, and eases the drag on household spending. That shift supported a broad rally rather than a narrow bounce.
A cautious near-term view still favours follow-through while crude stays off the highs, though the market will keep treating the ceasefire as temporary until shipping flows normalise more clearly.
Exporters, Banks, and Chip Stocks Lead the Charge
The rebound spread across nearly every major cyclical group. Exporters rose as the drop in oil improved the macro backdrop. Financials moved higher as lower energy stress reduced immediate stagflation fears. Chip names and index heavyweights led the sharpest gains as traders rotated back into growth after last week’s risk-off trade.
In the session snapshot, SoftBank Group rose more than 6%, Fast Retailing gained almost 5%, Toyota climbed almost 4%, and Honda added more than 2%.
In technology, Advantest jumped more than 10%, Screen Holdings surged almost 8%, and Tokyo Electron advanced almost 9%. Banks also joined the move, with Sumitomo Mitsui Financial and Mizuho Financial up more than 4%, while Mitsubishi UFJ Financial gained almost 3%.
The laggards made sense too. Energy names slipped because the crude rally broke lower. Inpex fell more than 5%, while shipping stocks such as Mitsui O.S.K. Lines, Kawasaki Kisen Kaisha, and Nippon Yusen moved lower as the oil risk premium started to unwind.
With the Nikkei’s performance increasingly tied to global tech flows, traders may consider tracking key AI and semiconductor stocks available across our CFD Shares offering.
Wall Street Gave the Rally a Solid Base
The overnight lead from the United States also helped. The Nasdaq rose 0.1% to 22,017.85, the S&P 500 edged up 0.1% to 6,616.85, and the Dow slipped 0.2% to 46,584.46. That was not a runaway rally, but it was enough to keep the tone constructive going into the Asian session.
The bigger catalyst still came from the ceasefire and the drop in oil, but the US close removed one more obstacle to aggressive dip-buying.
US stocks ended mixed amid signs of progress in negotiations as the minutes ticked down to President Trump's deadline for Iran to open the Strait of Hormuz https://t.co/fZemHx9vEVpic.twitter.com/GxQ1ObQB2B
Across Asia, the move was broad. South Korea and Taiwan surged, while Hong Kong, China, Australia, and New Zealand all traded higher. That regional strength confirmed that traders were buying the same macro theme everywhere: lower oil, lower inflation pressure, and a temporary break in the war premium.
Nikkei 225 Technical Outlook
The Nikkei 225 is trading near 56,223, staging a sharp rebound after the recent pullback that followed the rejection from the 60,077 high.
Price action shows strong bullish momentum returning, with a wide bullish candle breaking out from the recent consolidation range and pushing back above key moving averages.
This move suggests buyers are stepping back in aggressively after the correction phase seen through March.
From a technical standpoint, the structure is shifting back toward bullish. Price has reclaimed the 5-day (54,076) and 10-day (53,259) moving averages, both of which are now turning higher and providing immediate support.
The 20-day (53,338) is also flattening and beginning to slope upward, indicating that downside pressure is fading and momentum is rebuilding. The recent push higher signals a potential trend continuation if price can sustain above current levels.
Key levels to watch:
Support: 54,300 → 53,300 → 51,000
Resistance: 56,300 → 57,700 → 60,000
The immediate focus is on the 56,300 zone, which price is currently testing as resistance. A sustained break above this level could open the path toward 57,700, with a broader move potentially retesting the 60,000 region if momentum continues to build.
On the downside, 54,300 now acts as first support, aligning with the recent breakout area. A break below this level could signal a loss of short-term momentum and lead to a pullback toward 53,300, though such a move would likely remain corrective within the improving structure.
Overall, the Nikkei is showing strong recovery momentum after its recent dip, with buyers regaining control in the short term. If price can hold above the 54,000–54,300 region, the bias shifts back toward upside continuation, with the market potentially building toward another test of prior highs.
What Traders Should Watch Next
The next move depends on whether the ceasefire turns into stable energy flows rather than another short pause. Lower crude has done most of the heavy lifting so far.
If Hormuz traffic stays open enough to keep oil under control, the Nikkei can keep rebuilding toward the upper 50,000s. If the truce frays and crude reverses higher, the same sectors driving today’s rally could give back ground quickly.
The rally came after a two-week ceasefire and a temporary reopening of the Strait of Hormuz reduced immediate energy-supply fears. Lower oil prices improved the outlook for Japan, which imports most of its energy, and that helped trigger a broad risk-on move across the region.
Why Does Falling Oil Help Japanese Stocks So Much?
Lower crude prices reduce imported energy costs, ease inflation pressure, and improve the outlook for household spending and corporate margins. That tends to support the Nikkei more than many other major indices because Japan is highly exposed to external energy prices.
Why Did Exporters, Chip Stocks, and Banks Lead the Rally?
Exporters benefited from an improving macro backdrop, chip stocks tracked stronger risk appetite and growth expectations, and banks gained as the market moved away from the worst stagflation fears. The move was broad enough to lift most cyclical sectors together rather than just one narrow theme.
Why Did Energy Stocks Lag the Nikkei?
Energy names weakened because the same drop in oil that helped the broader index reduce earnings support for producers and oil-linked shares. That is why stocks such as Inpex moved the other way while the rest of the market rallied.
What Did the Current Account Data Add to the Story?
Japan posted a 3.933 trillion yen current account surplus in February, above the 3.549 trillion yen forecast. Exports rose 2.8%, imports rose 9.7%, and the trade balance showed a 267.6 billion yen surplus. That data added to the sense that Japan’s external position was holding up better than feared.
Start trading now – Click here to create your real VT Markets account
TD Securities’ Global Strategy Team expects the Reserve Bank of New Zealand to keep the Official Cash Rate unchanged at its next meeting, in line with market expectations.
The team expects the RBNZ to communicate a patient approach to supply shocks while the economy is operating below capacity.
Market Pricing And Policy Signals
It reports that markets are pricing in more than 75 basis points of interest-rate rises in 2026, and says it will review that pricing against what the RBNZ communicates.
The team plans to read the meeting Minutes for any indication that the RBNZ could shift towards bringing forward rate rises.
The article states it was produced with the assistance of an artificial intelligence tool and reviewed by an editor.
We believe the market is misinterpreting the Reserve Bank of New Zealand’s intentions. Current market pricing is factoring in more than 75 basis points of hikes for 2026, which seems excessive. We expect the RBNZ to hold the Official Cash Rate and communicate a need for patience.
Implications For Traders And Nzd
This view is supported by the latest economic data. Inflation has been steadily cooling from the stickier levels we saw through 2025, with the latest Q1 2026 figures showing CPI at 3.1%. Furthermore, recent GDP data showed the economy expanded by only 0.2%, confirming that it is operating below its potential and is sensitive to further tightening.
For derivatives traders, this suggests a strategy of positioning against the market’s aggressive rate hike expectations. This could involve using overnight index swaps or options to bet that the OCR path will be much lower than currently priced in. The core of the trade is that the central bank will use its statement to push back against current market assumptions.
This dovish stance should also weigh on the New Zealand dollar. We saw a similar pattern in 2025 when the RBNZ signaled a pause, causing the NZD/USD to weaken considerably over the following weeks. Options strategies that would profit from a falling Kiwi dollar could therefore be advantageous.
The primary risk is a surprise hawkish tone in the upcoming meeting Minutes. We will be looking for any signs that the Bank’s concern over persistent domestic inflation is starting to override its worries about weak economic growth. Such a change would indicate that earlier rate hikes are, in fact, back on the table.
NZD/USD traded near 0.5720 on Wednesday, with the US Dollar supported by safe-haven demand ahead of the Reserve Bank of New Zealand (RBNZ) policy decision. Markets have broadly priced in a rate hold, so attention is on the RBNZ’s guidance.
Geopolitical tension lifted risk aversion after US President Donald Trump set a deadline on Iran, while Tehran reportedly cut diplomatic channels with the US. Concerns around the Strait of Hormuz added to market caution and kept energy prices elevated, which supported the USD.
RBNZ Guidance In Focus
Traders are watching whether the RBNZ signals a more hawkish or more cautious path. A hawkish tone could support the New Zealand Dollar, while a patient stance could leave it open to further falls against a firm USD.
On the 4-hour chart, NZD/USD traded at 0.5735, above the 20-period moving average at 0.5710 but below the falling 100-period moving average at 0.5780. The Relative Strength Index was 56.
Resistance was listed at 0.5736, then 0.5780 and 0.5907. Support was given at 0.5724, with 0.5704 and 0.5702 below.
We recall the neutral sentiment for NZD/USD around this time in 2025, when the pair struggled near 0.5720 ahead of a key Reserve Bank of New Zealand decision. That period of market hesitation gave way to a clearer trend after the central bank held rates through 2025 before signaling a more dovish stance. Now, with the pair trading significantly higher, the context for derivative plays has completely changed.
Volatility And Strategy Considerations
The focus in 2025 was on whether the RBNZ would look through what was then 3.1% inflation. As we now know, those price pressures proved transitory, with New Zealand’s latest quarterly CPI figure for Q1 2026 coming in at a more manageable 2.1%. This slowdown was a primary driver behind the central bank’s recent policy pivot, a stark contrast to the hawkish signals some had anticipated last year.
While the specific geopolitical drivers have shifted from the US-Iran standoff that supported the dollar in 2025, overall market uncertainty remains. Current trade negotiations between the US and China are keeping markets on edge, which suggests implied volatility in NZD/USD could see short-term spikes. This environment makes strategies like purchasing straddles or strangles potentially useful for traders positioning for a breakout from the current range.
The technical picture has evolved from the struggle below the 0.5780 moving average we observed last year. With NZD/USD now finding support near 0.5910, traders might consider positioning for a continued, but measured, recovery toward the 0.6050 level seen in late 2025. A bull call spread, buying a 0.5950 strike call and selling a 0.6050 strike call, could offer a cost-effective way to capitalize on potential upside over the next few weeks.
TD Securities’ Global Strategy Team expects the Reserve Bank of New Zealand (RBNZ) to keep the Official Cash Rate unchanged, matching market consensus. It expects RBNZ communication to focus on patience in responding to supply shocks while the economy is operating below capacity.
The team says markets are pricing in more than 75 bps of rate rises in 2026. It describes this level of pricing as excessive and plans to review the meeting Minutes for any indication of earlier tightening.
Reserve Bank Of New Zealand Outlook
The article states it was produced with help from an artificial intelligence tool and reviewed by an editor.
We are not expecting any change to the cash rate from the Reserve Bank of New Zealand. The bank will likely emphasize patience because the economy is running below its full potential. This view challenges the market’s current pricing of more than three rate hikes before the year is out.
The bank’s cautious stance is understandable given recent data showing the economy is weak. We saw GDP growth turn slightly negative at -0.1% at the end of 2025, and the unemployment rate has climbed to 4.8%. While Q1 inflation is still sticky at 3.1%, the RBNZ will likely prioritize growth over fighting this last bit of inflation for now.
For derivative traders, this suggests positioning for interest rates to be lower than the market currently implies. We saw a similar pattern throughout 2025, where the market got ahead of the central bank’s actual pace, rewarding those who bet against aggressive tightening. Therefore, positions that benefit from the RBNZ holding rates steady, such as receiving fixed in interest rate swaps, could be favorable.
What To Watch In The Minutes
The key is to watch the language in the upcoming meeting minutes very closely. Any wording that hints the Bank is losing patience with inflation or sees growth picking up would be a sign to exit these positions. This communication will be the primary catalyst for the market in the coming weeks.
NZD/USD traded near 0.5720 on Wednesday, keeping a neutral tone as the US Dollar stayed firm on safe-haven demand ahead of the Reserve Bank of New Zealand (RBNZ) policy decision. Markets are focused on RBNZ guidance, as a rate hold is already priced in.
Geopolitical tensions supported the USD after US President Donald Trump set a deadline on Iran a few hours away, while Iran reportedly reduced diplomatic communication with the US. Concerns around the Strait of Hormuz lifted risk aversion and energy prices.
RBNZ Guidance In Focus
Traders are watching whether the RBNZ signals a hawkish or cautious policy path, with inflation near 3.1% seen as partly temporary and linked to energy. A hawkish tone could support the NZD, while a patient stance may leave it open to further weakness.
On the 4-hour chart, NZD/USD was at 0.5735, above the 20-period moving average at 0.5710 but below the falling 100-period moving average at 0.5780. The RSI was 56, above the midline.
Resistance levels were 0.5736, 0.5780, and 0.5907, while support sat at 0.5724, 0.5704, and 0.5702. A break below 0.5702 could reopen the wider downtrend.
We are seeing a familiar pattern as we approach the April 10 RBNZ decision, reminiscent of the situation in mid-2025. Just like then, a rate hold is almost entirely priced into the market, so our focus shifts entirely to the central bank’s forward guidance. The key question is whether they will maintain a hawkish stance or signal a more cautious outlook.
How Inflation Shapes The Decision
Last year, the concern was an inflation rate around 3.1% that policymakers viewed as temporary. Today, with the latest quarterly CPI data showing inflation stubbornly at 3.8%, well above the RBNZ’s target band, the challenge is even greater. They must decide if this persistence warrants delaying any hints of future rate cuts, which could surprise the market.
While the specific geopolitical risks have shifted from the US-Iran tensions of 2025, the outcome is the same. Heightened trade friction and European instability are fueling safe-haven demand for the US dollar, with the Dollar Index (DXY) holding firm above 105.50. This creates a significant headwind for the NZD/USD pair, regardless of the RBNZ’s domestic focus.
Given the binary nature of the RBNZ’s potential tone, traders could consider using options to position for a potential spike in volatility. A long straddle strategy, buying both a call and a put option, would profit from a significant move in either direction without betting on the outcome. This approach protects against being on the wrong side of a hawkish surprise or a dovish disappointment.
For those holding existing NZD positions, purchasing out-of-the-money put options offers a cost-effective way to hedge against a dovish RBNZ that could send the kiwi lower. We saw how a cautious stance in 2025 preceded a slide in the pair, and puts can act as insurance against a repeat scenario. This allows for participation in any upside surprise while capping potential losses.