Japan’s Finance Minister Satsuki Katayama said on Tuesday that financial markets are showing high volatility. She said she is monitoring the situation.
Katayama said she will respond to volatility in financial markets, including foreign exchange. She did not give details on what actions might be taken.
Market Volatility And Yen Watch
At the time of writing, USD/JPY was up 0.09% on the day at 159.20.
There is high volatility in the markets, and we are being told a response is coming to counter it, including in foreign exchange. With USD/JPY trading at 159.20, this statement is a clear warning of potential government intervention to strengthen the yen. Traders should view levels above 159.50 and 160.00 as extremely risky for long dollar positions.
We saw this playbook used before, looking back from our perspective in early 2026. When the pair crossed 160 in October of 2024, the Ministry of Finance stepped in, selling an estimated $55 billion to push USD/JPY back down toward 153 in a matter of days. That history suggests that verbal warnings at these levels are often followed by real action.
This threat directly impacts the options market, as uncertainty about the timing of intervention pushes up prices. One-month implied volatility for USD/JPY has already spiked to 13.1%, a significant jump from the 9.8% average seen last month. This makes buying options more expensive, but it reflects the market’s expectation of a large, sudden move.
Options Strategies And Intervention Risk
Given this, traders could consider buying put options with strike prices around 158 or 157 to profit from a sharp drop caused by intervention. Another strategy is to sell out-of-the-money call spreads with a ceiling around 160.50. This position profits if the verbal warnings successfully keep the pair from rising further.
The timing of any action remains the biggest question, creating opportunities in the short term. Some may sell weekly call options just above the current price, collecting the high premium while betting that intervention is not imminent within the next few days. This is a risky strategy that should be hedged with longer-dated puts in case the government acts sooner than expected.
Create your live VT Markets account and start trading now.
Start trading now – Click here to create your real VT Markets account
US President Donald Trump said the US has asked to delay his planned meeting with Chinese President Xi Jinping in Beijing by “a month or so”, according to CNBC. He linked the change to the ongoing war with Iran.
Trump said he did not know if he would still travel to China at the end of March as previously scheduled. He said he wanted to remain in the US because of the war, and that the delay would be limited.
Trade War Definition
A trade war is an economic conflict driven by protectionist measures such as tariffs. These barriers can trigger counter-measures, pushing up import costs and the cost of living.
The US-China trade dispute began in early 2018 after the US imposed trade barriers on China over claims of unfair practices and intellectual property theft. China responded with tariffs on US goods, including automobiles and soybeans.
The two countries signed the US-China Phase One trade deal in January 2020. The deal required structural reforms and other changes to China’s economic and trade system, while the Coronavirus pandemic shifted attention away from the dispute.
After taking office, President Joe Biden kept tariffs in place and added further levies. During the 2024 campaign, Trump pledged 60% tariffs on China and imposed them on 20 January 2025, renewing tensions.
Market Volatility Outlook
Looking back, we can see how the events of early 2025 created significant market instability for traders. The combination of 60% tariffs on China and a new war in Iran caused the CBOE Volatility Index (VIX) to surge, as it briefly spiked above 28 in March 2025. This prolonged period of uncertainty has established a new, higher baseline for implied volatility in equity index options.
The currency market reacted exactly as we anticipated, with a flight to safety benefiting the US dollar. The offshore yuan weakened sharply against the dollar last year, with USD/CNH breaking past 7.9 for the first time as capital flowed out of China. Traders should be positioned for further yuan depreciation if trade relations do not improve, using options to hedge exposure.
Commodities saw a split reaction, creating distinct opportunities. As we saw during the conflict last year, Brent crude futures briefly topped $115 per barrel on fears of supply disruptions through the Strait of Hormuz. In contrast, agricultural futures, particularly soybeans, remain under pressure, echoing the price patterns we observed during the 2018 trade dispute.
The impact of those tariffs is now evident in our inflation data, complicating Federal Reserve policy. The latest CPI reading for February 2026 came in at a stubborn 3.4%, well above the 2% target, limiting the Fed’s ability to lower interest rates. This environment suggests selling call options on rate-sensitive sectors that are unlikely to rally until inflation is controlled.
Given the lingering geopolitical tensions, traders should continue to buy protection against sudden market swings. We have seen how quickly headlines can move the market, so holding long-dated puts on multinational industrial companies exposed to tariffs is a prudent strategy. VIX call options also remain a relatively inexpensive way to hedge an entire portfolio against another flare-up.
Create your live VT Markets account and start trading now.
Start trading now – Click here to create your real VT Markets account
China began 2026 with strong economic readings, including higher than expected industrial production and exports. Fixed-asset investment also rebounded, supported by quasi-fiscal measures.
Risks to growth have increased due to higher oil prices linked to the Middle East conflict and uncertainty around US–China trade talks. These factors could weigh on the 4.6% GDP forecast for 2026.
Key Market Volatility Setup
If manufacturing input costs rise, authorities may expand fiscal support to prevent firms from cutting output. Measures mentioned include targeted tax cuts and subsidies for small and medium-sized enterprises and manufacturers.
A scenario is set out in which oil remains near US$100 per barrel for the next 3 months, which could trigger additional targeted support. The policy focus would shift towards sustaining growth, placing more reliance on fiscal tools than monetary action.
The 4.6% 2026 GDP forecast is kept unchanged because any oil-related drag may appear later in the year and fiscal capacity could cushion it. A possible cancellation of a Trump visit to China is described as a risk that could raise the chance of tariffs returning.
China’s economy showed a strong start to the year, with industrial output for January and February beating expectations by rising 6.8% from a year earlier. This positive domestic data, however, is being overshadowed by external pressures creating significant uncertainty. For traders, this clash between good local news and risky global events is a classic setup for higher market volatility.
Trading And Hedging Considerations
With Brent crude futures holding stubbornly above $98 per barrel for the past month, we see a direct threat to Chinese manufacturers’ profit margins. We expect Beijing will prioritize growth and stability by offering fiscal support like subsidies, rather than tightening monetary policy to fight inflation. This playbook is similar to measures we saw them deploy during the global supply chain crunch back in 2025.
This uncertainty suggests that volatility itself is a tradable asset in the coming weeks. We have already seen the implied volatility on Hang Seng Index options climb to a three-month high of 28% last week, indicating the market is bracing for larger price swings. Strategies that profit from increased chop, such as buying straddles or strangles on major Chinese ETFs, should be considered.
The biggest immediate risk is the potential cancellation of President Trump’s visit, with preliminary talks reportedly stalling over tariff disputes. A cancellation would likely trigger a sell-off, making protective put options on indices a necessary hedge for any long positions. We believe the market is currently underpricing the probability of relations souring again, which reminds us of the sudden tariff escalations we witnessed in late 2024.
These pressures are also weighing on the currency, with the offshore yuan already testing the 7.30 level against the U.S. dollar. Given the expectation of targeted government easing and ongoing geopolitical tensions, further weakness seems likely. We are looking at call options on the USD/CNH pair as a way to position for a depreciation of the yuan through the second quarter.
Create your live VT Markets account and start trading now.
Start trading now – Click here to create your real VT Markets account
Gold traded slightly lower near $5,000 in early Asian trading on Tuesday. Expectations for near-term US Federal Reserve rate cuts eased ahead of the Fed’s decision on Wednesday.
Oil stayed above $100 a barrel as the US-Israeli war on Iran entered its third week. Higher crude prices raised inflation concerns, which reduced expectations for imminent rate cuts and weighed on non-yielding assets such as gold.
Fed Policy Outlook
The Fed is expected to keep the federal funds rate unchanged at 3.50%–3.75% at its March meeting on Wednesday. Some forecasts place the next reductions in 2026, with the pace and size not yet clear.
Fed funds futures now price out a September cut and point to one cut in December, according to the CME FedWatch tool. Market pricing has shifted as inflation risks remain in focus.
Gold is widely used as a store of value and a medium of exchange, and is also purchased for jewellery. It is often used as a hedge against inflation and currency weakness, as it is not tied to a single issuer.
Central banks are the largest holders of gold. They added 1,136 tonnes worth about $70 billion in 2022, the highest annual total on record, according to the World Gold Council.
Market Drivers And Positioning
Gold often moves opposite to the US Dollar and US Treasuries. It also tends to move against risk assets, and can be affected by geopolitical events, recession fears, and interest-rate changes.
Based on the environment we saw develop in 2025, the path for gold in the coming weeks appears guided by interest rate expectations over geopolitics. The persistent conflict in the Middle East drove oil above $100 last year, which we can now see directly influenced the Fed’s decision to delay rate cuts. This has established a high-rate environment that continues to pressure non-yielding assets like gold.
With this backdrop, volatility should be a primary focus for derivative traders. We are seeing implied volatility in gold options tick up, similar to the 15-20% levels observed during the early stages of the 2022 Ukraine conflict, reflecting the market’s uncertainty between geopolitical risk and monetary policy. This suggests strategies like long straddles or strangles could be positioned to profit from a significant price move in either direction, regardless of the catalyst.
The prevailing trend, however, is downward pressure from high interest rates, making protective puts or bear put spreads logical positions. Options market data shows a growing skew, with puts trading at a higher premium than calls, indicating a collective expectation of further downside or at least a high demand for downside protection. A break below the psychological $5,000 level could trigger further selling toward support levels we haven’t seen since late 2024.
Still, we must acknowledge the strong underlying support from central bank buying, which has continued unabated. World Gold Council data showed that central banks added a net 800 tonnes in 2023 and we saw that trend continue through 2025, providing a floor for prices. Therefore, traders might consider selling cash-secured puts at lower strike prices, aiming to collect premium while being willing to own gold at a significant discount if a sharp, unexpected sell-off occurs.
The inverse relationship with the US Dollar remains a critical factor to watch. Last year, the Dollar Index (DXY) rallied strongly as rate cut expectations faded, directly weighing on gold prices. We should therefore monitor options on currency-tracking ETFs as a leading indicator for gold’s next move.
Create your live VT Markets account and start trading now.
Start trading now – Click here to create your real VT Markets account
Pound Sterling rose about 0.75% on Monday as the US Dollar weakened. GBP/USD moved from near 1.3220 on Friday to above 1.3300.
The pair remains below recent peaks, with a downtrend from late January near 1.3870. It has also closed below key moving averages for several sessions, with resistance near the 200-day EMA.
Key Events In Focus
Markets focus on three events over three days, starting with the US Federal Reserve decision on Wednesday. A hold at 3.75% is expected, with attention on the SEP and Chair Powell’s press conference.
On Thursday, the Bank of England is expected to hold rates at 3.75%. Forecasts point to an MPC split of 2-0-7 (cut-hike-unchanged), compared with 4-0-5 in February.
UK employment data is also due Thursday, with ILO unemployment forecast to stay at 5.2%. Earnings including bonuses are expected at 3.9% YoY, down from 4.2%.
The Pound Sterling is the UK currency and dates to 886 AD. It accounts for 12% of FX transactions, or about $630 billion a day (2022), with GBP/USD at 11%, GBP/JPY at 3%, and EUR/GBP at 2%.
Bank Of England Policy Overview
BoE policy targets inflation around 2% using interest rates. Economic data and trade balances can affect Sterling’s demand.
We’ve seen Pound Sterling gain a little ground against the Dollar, but this feels more like a temporary pause than a real change in direction. The pair is still clearly trending down from its highs back in January 2026, and any strength is likely to face resistance. For now, the pressure remains on the buyers to prove this bounce is sustainable.
All eyes will be on the Federal Reserve’s decision this week, where we expect them to hold rates steady at 5.50%. The real market-mover will be the tone of their statement and projections, especially after recent inflation data for February came in a bit hot at 3.1%. Any signal that they plan to keep rates high for longer will likely strengthen the Dollar and push GBP/USD lower.
The Bank of England is also expected to keep its rate at 5.25%, but the situation here is different. Looking back at 2025, we saw the committee was very divided, and we’re watching the vote split closely for signs of a shift towards rate cuts. With the UK economy having contracted slightly at the end of last year and unemployment ticking up to 4.5%, the BoE is under more pressure to ease policy than the Fed.
This potential for a hawkish Fed and a more cautious Bank of England creates a clear policy divergence that typically favors a stronger Dollar. For derivative traders, this outlook suggests positioning for potential downside in GBP/USD, as a firm stance from the US contrasted with UK economic concerns could renew the selling pressure. Options strategies that benefit from a drop in price or an increase in volatility could be worth considering around these key central bank announcements.
Create your live VT Markets account and start trading now.
Start trading now – Click here to create your real VT Markets account
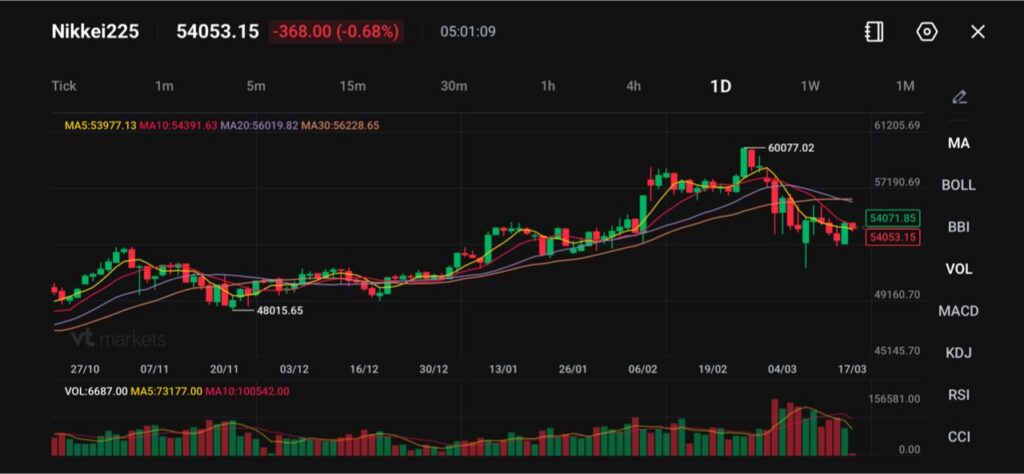
Nikkei 225 rose 0.3% in broader market trading, even as the chart shows 54,053.15, down 368.00 (-0.68%) on the session snapshot.
Brent crude climbed 2.7% to $102.89 per barrel, keeping pressure on Japan as a major energy importer.
The yen weakened 0.2% to 159.415 per dollar, staying close to the 160 level despite official verbal warnings.
The Nikkei 225 is trying to recover, but the backdrop remains difficult. Broader Asian equities moved higher on Tuesday, and Japan’s Nikkei 225 rose 0.3% as traders pushed for a second day of gains. Still, the wider tone remains cautious as markets try to price the economic damage from the US-Iran war and the policy response it may trigger.
Japan’s defense minister said the US hadn’t made a specific demand to send ships to the Middle East, following media reports that Tokyo has started to explore that possibility ahead of Takaichi’s summit with Trump this week https://t.co/nsFshGSVFW
This is not a clean risk-on move. Chris Weston of Pepperstone said the rally still feels like a positioning squeeze rather than the start of a fresh directional trend. That fits the Nikkei well. The index is trying to bounce, but traders still face high oil prices, a weak yen, and a packed week of central bank meetings.
If global risk sentiment improves and oil stops climbing, the Nikkei may extend its rebound. If energy prices stay high and markets keep doubting the bounce, upside may remain limited.
Oil Above $100 Keeps Pressure on Japan
For the Nikkei, oil is one of the biggest macro risks. Brent crude rose 2.7% to $102.89 a barrel after several US allies rejected calls to send warships to escort tankers through the Strait of Hormuz. Since about one-fifth of global energy shipments move through that route, any prolonged disruption matters.
A policy hold by the Bank of Japan this week is a foregone conclusion for most economists, but the deliberations will still be highly significant as authorities start to mull whether surging oil prices might warrant preemptive action https://t.co/6ISoQ3V6Zc
Japan is highly exposed to higher imported energy costs. That can hurt margins for manufacturers, transport firms, and consumer-facing businesses. It can also weigh on household spending if energy bills rise.
This is why the Nikkei can lag even when some global markets recover. Higher oil is not just an inflation story for Japan. It is also a growth headwind.
If Brent stays above $100, the Nikkei may continue to face pressure from weaker earnings expectations and tighter financial conditions.
Yen Near 160 Adds Another Layer of Stress
The currency picture also matters. The Japanese yen weakened 0.2% to 159.415 per dollar, staying just shy of the 160 level despite verbal warnings from Japanese authorities.
A weaker yen can help exporters in normal times, but this situation is less straightforward. When oil prices are high, the weaker currency also makes imported energy more expensive. That weakens one of the Nikkei’s usual supports from yen depreciation.
Bank of Japan Governor Kazuo Ueda said underlying inflation was gradually accelerating toward the bank’s 2% target. Even so, analysts expect the bar for intervention to be higher because of rising oil prices. That leaves the market in a difficult spot, where the yen stays weak while inflation risks rise.
If USDJPY pushes closer to 160, volatility in Japanese equities may increase, especially if traders start to question whether authorities will step in.
Central Bank Week Could Drive the Next Nikkei Move
This week’s central bank calendar is packed, and that matters for the Nikkei. The Reserve Bank of Australia was first up, with economists expecting a second hike this year to 4.1%. After that, attention turns to the Federal Reserve, European Central Bank, Bank of England, and Bank of Japan.
The Fed funds market shows a 99.1% probability that the Federal Reserve will remain on hold at the end of its two-day meeting on Wednesday. That suggests traders expect caution rather than a strong policy shift.
This month’s surge in oil prices and the market’s move to ratchet back expectations for Federal Reserve policy easing have generated a $10 million profit for one options bet in short-term interest rates https://t.co/pDFGfMzi1a
For Japanese equities, the issue is not just what the BoJ says. It is how all major central banks respond to an energy shock that could lift inflation and slow growth at the same time. If policymakers turn more hawkish, equities may struggle. If they sound calm and patient, the Nikkei may find some relief.
If central banks emphasise inflation risk over growth concerns, the Nikkei may remain under pressure. If they signal patience and avoid hawkish surprises, the index may stabilise.
Nikkei 225 Technical Outlook
The Nikkei 225 is trading near 54,053, down roughly 0.68% on the session as the index continues to struggle after failing to hold above the 60,077 peak reached earlier in the quarter. The recent pullback suggests the market remains in a corrective phase following the strong rally seen earlier in the year.
Technically, the index remains below several key moving averages. The 5-day moving average (53,977) is close to the current price but flattening, while the 10-day (54,392) sits slightly above the market and continues to trend lower. Meanwhile, the 20-day moving average (56,020) and 30-day (56,228) remain significantly above current levels, reinforcing the near-term bearish pressure as the index trades beneath this cluster of resistance.
Immediate support appears around the 53,800–54,000 region, where prices are currently attempting to stabilise. A break below this area could expose further downside toward 52,500–53,000, where previous buying interest has emerged. On the upside, initial resistance is located near 54,400, followed by stronger resistance around 56,000, where the 20-day moving average sits.
Overall, the Nikkei appears to be consolidating after the sharp rejection near 60,000, with the broader trend turning cautious in the short term. Unless the index can reclaim the 54,400–56,000 region, momentum may remain limited, leaving the market vulnerable to further downside consolidation before a clearer directional move develops.
What Traders Should Watch Next
The Nikkei now sits at the intersection of three major forces: oil above $100, USDJPY near 160, and central banks trying to respond to a war-driven inflation shock without overreacting.
That makes the next move less about one headline and more about whether all three start easing at once. If oil cools, the yen stabilises, and central banks avoid a hawkish tilt, the Nikkei may recover further. If those pressures stay in place, the index may keep trading with a fragile tone.
What is Driving the Nikkei 225 Right Now? The Nikkei 225 is being driven by a mix of rising oil prices, a weaker yen, and global central bank expectations, all of which are shaping investor sentiment.
Why Does Higher Oil Pressure the Nikkei? Japan is a major energy importer. When oil prices rise above $100 per barrel, it increases costs for businesses and consumers, which can weigh on corporate earnings and economic growth.
How Does a Weak Yen Affect the Nikkei? A weaker yen can support exporters by making Japanese goods cheaper overseas. However, when oil prices are high, it also increases import costs, which can offset those benefits.
Why is USDJPY Near 160 Important? The 160 level is seen as a key psychological threshold. If the yen weakens further, it could increase volatility and raise the risk of intervention from Japanese authorities.
What Role Do Central Banks Play in the Nikkei’s Outlook? Global central bank decisions influence liquidity, interest rates, and risk appetite. A more hawkish stance could pressure equities, while a cautious or neutral tone may support the Nikkei.
Start trading now – Click here to create your real VT Markets account
Spot Gold was little changed on Monday as easing tensions around the Strait of Hormuz reduced the fear premium. Prices have fallen from the spike high near 5,600 and are now consolidating close to 5,000.
XAU/USD traded in a narrow range and ended near 5,000 after last week’s sharp drop from the highs. The 5,000 level is acting as near-term support while the market waits for fresh direction.
Gold Consolidates Near Key Support
The earlier jump towards 5,600 followed disruption in the Strait of Hormuz that cut a large share of global seaborne oil supply. As the initial shock has faded and crude prices have fallen, safe-haven demand has cooled.
Market focus now turns to the US Federal Reserve decision on Wednesday and the updated Summary of Economic Projections. Markets expect rates to be held at 3.75%, and the outlook for the rate path will be monitored for its impact on the US Dollar and real yields.
We remember well the sharp spike to 5,600 during the Strait of Hormuz supply shock back in 2025, and how the market found its footing around the 5,000 level once tensions eased. That event established a playbook for how gold reacts to sudden geopolitical crises, creating a volatility ceiling that we now see priced into long-dated options. This memory serves as a crucial guide for structuring trades today.
That period of extreme volatility has now passed, with the CBOE Gold Volatility Index (GVZ) currently trading near 14.5, significantly below the highs seen during the 2025 panic. This lower implied volatility makes buying options strategies more affordable for traders looking to position for a breakout. It suggests the market is not expecting a repeat of that kind of shock in the immediate term.
Fed Outlook Shapes Range Trading
The Federal Reserve is now in a different position than it was when its rate was 3.75% during that period. With the latest February CPI data for 2026 showing inflation holding stubbornly at 2.9%, expectations for another rate cut in the second quarter are fading. This “higher for longer” reality is capping gold’s upside potential and keeping it within a more defined range.
Current tensions in other global shipping lanes are providing a modest and consistent fear premium, unlike the acute shock we saw in 2025. This acts as a support floor for the price, preventing a significant sell-off even as the Fed maintains its cautious stance. We see this reflected in steady, though not panicked, inflows into gold ETFs, which are up 1.2% over the last month.
Given this environment, we are seeing traders use options to trade the expected range rather than a new crisis. Selling call credit spreads with a strike price above the 5,400 resistance level allows for income generation while defining risk against a sudden upward move. Simultaneously, buying protective puts below the key 4,850 support level offers a cost-effective hedge against any unexpected breakdown in the market structure.
Create your live VT Markets account and start trading now.
Start trading now – Click here to create your real VT Markets account
USD/JPY fell about 0.4% on Monday, ending a four-session rise and moving back to the 159.00 area. The pair had climbed from around 152.10 in February, but the move up to 159.75 did not hold.
The Japanese Yen firmed as the US Dollar weakened in broader trading. The Bank of Japan is expected to keep its policy rate at 0.75% on Thursday, while inflation remains above the 2% target.
Japan Data And Boj Outlook
Japan will also publish February trade figures on Thursday after exports rose 16.8% year on year in the previous release. Markets will also focus on comments from Governor Ueda for any timing on future tightening.
On the US side, reduced Strait of Hormuz tensions eased demand for the Dollar as a safe haven. The New York Empire State Manufacturing index was -0.2 versus a 3.2 forecast.
The Federal Reserve decision is due Wednesday, with rates expected to stay at 3.75%. The updated Summary of Economic Projections is due alongside the decision.
Looking back a year ago, we recall the market dynamics in March 2025 when USD/JPY was pushing toward 160. The narrative was dominated by a massive policy gap, with the Bank of Japan holding its rate at 0.75% while the Federal Reserve stood firm at 3.75%. This wide differential was the primary driver for being long the dollar against the yen.
Policy Convergence And Market Implications
Since that peak, the landscape has shifted significantly, making long dollar positions far more risky. The Federal Reserve, responding to slower growth, has initiated a cutting cycle, bringing its policy rate down to its current 2.75%. In contrast, the Bank of Japan has continued its slow normalization, hiking rates twice in late 2025 to bring its benchmark rate to 1.25%.
This policy convergence has squeezed the crucial US-Japan 10-year bond yield spread, which has narrowed from over 350 basis points back in early 2025 to just 240 basis points today. This compression removes a key pillar of support for the pair and caps its upside potential. The current price of 154.50 reflects this new reality of a less attractive carry trade.
With Japan’s national core CPI for February 2026 coming in at 2.3%, remaining stubbornly above the BoJ’s target, expectations for another rate hike this year are firming up. For traders, this suggests that selling call options with strike prices above 157.00 could be a prudent strategy to collect premium, as a return to the 160 level from 2025 seems unlikely. We see that past resistance as a psychological barrier that will be difficult to breach now.
Given the reduced momentum, strategies like put spreads could also be considered to position for a gradual drift lower in the pair. The Yen’s safe-haven status, which was dormant during the 2025 rally, could re-emerge if the global economic slowdown deepens, adding another headwind for USD/JPY. The period of straightforward dollar strength we saw last year is clearly behind us.
Create your live VT Markets account and start trading now.
Start trading now – Click here to create your real VT Markets account
AUD/USD rose about 1.25% on Monday and ended near 0.7070 after rebounding from last week’s lows. Since peaking around 0.7190 in early February, it has moved in a choppy range, often dipping towards 0.7000 before recovering.
Monday’s close was near the middle of that range. The daily move was linked to broad US Dollar weakness rather than new demand for the Australian Dollar.
Rba Decision In Focus
The Reserve Bank of Australia is due to set rates on Tuesday. Markets expect a 25 basis point rise to 4.10%, which would be a second straight increase.
Inflation remains above the 2%–3% target band, with trimmed mean inflation still elevated. Australia’s employment report is due on Thursday, with forecasts of 20.3K new jobs and unemployment edging up to 4.2%.
US Dollar moves were shaped by easing worries about a Strait of Hormuz closure, reducing safe-haven demand. The NY Empire State Manufacturing Index for March came in at -0.2 versus a 3.2 forecast.
The Federal Reserve decision on Wednesday is expected to keep rates at 3.75% and include an updated Summary of Economic Projections.
Policy Divergence And Trade Setup
Looking back at the market in early 2025, we saw the AUD/USD pair trapped in a choppy range around the 0.7100 handle. The dynamic was driven by a hawkish Reserve Bank of Australia, which hiked rates to 4.10%, while the US Federal Reserve was signaling a pause. This divergence in central bank policy set the stage for the trend we have seen over the past year.
That policy gap has since widened significantly, benefiting the Aussie dollar. The RBA has held its cash rate steady at its peak of 4.35% as Q4 2025 inflation, while lower, was still stubborn at 3.4%. In contrast, the Fed began its cutting cycle late last year and has now brought the Fed Funds Rate down to 3.25% in response to slowing growth and inflation nearing their target.
This interest rate differential in Australia’s favor provides a strong positive carry, making it attractive to hold long Australian dollar positions. The US economy showed signs of this weakness back in 2025, and that trend has continued with recent data showing US Q4 2025 GDP growth at a soft 1.2%. This confirms the Fed’s reasoning for easing policy and continues to weigh on the US dollar.
For derivative traders, this environment suggests maintaining a bullish bias on AUD/USD. With the pair currently trading near 0.7480, buying call options with strike prices above 0.7500 could be a strategic way to capture further upside while defining risk. We should look for volatility to remain relatively low as long as central banks stick to their current, predictable paths.
Create your live VT Markets account and start trading now.
Start trading now – Click here to create your real VT Markets account
Malaysia recorded MYR426.7bn in approved investments in 2025. Approvals were concentrated in digital projects, electrical and electronics, chemicals, and next‑generation mobility.
The research note links the outcome to policy upgrades, including the New Incentive Framework. It also points to updated industrial regulations aimed at providing clearer rules and reshaping incentives.
Momentum Into 2026
The report says Malaysia is moving into 2026 with resilience despite global headwinds. It cites global uncertainty and energy price swings tied to conflict in the Middle East as factors affecting supply chains.
Malaysia’s position is described in terms of diversification across states and rising renewable energy commitments. It also notes deeper industry clusters in E&E, petrochemicals, EV-related activity, and digital services.
The outlook over the next 12–24 months is framed around continued progress in digital infrastructure and higher-value manufacturing. It also depends on project execution and ongoing policy implementation.
The article states it was produced with the help of an AI tool and reviewed by an editor.
Trading Implications For Myr
The record MYR 426.7 billion in approved investments we saw throughout 2025 is now translating into tangible economic momentum as we move through 2026. This sustained policy delivery creates a constructive view on the Malaysian Ringgit for the next 12 to 24 months. Traders should therefore look to position for MYR strength against the US dollar in the coming weeks.
Given this outlook, buying MYR call options or selling USD/MYR futures appears attractive. We’ve seen the USD/MYR pair already retreat from its late 2025 highs near 4.75, finding solid support around the 4.60 level in early 2026. This suggests underlying strength is building as those high-quality investment flows begin to materialize.
The positive sentiment extends to local equities, with the FBM KLCI having already rallied 5% year-to-date and broken through the 1,600 level. We should consider buying FBM KLCI futures contracts to gain exposure to this upward trend. The focus on high-value sectors like E&E and digital services should disproportionately benefit a number of the index’s largest components.
This view is supported by recent data, such as February’s manufacturing PMI which climbed to 51.2, its third consecutive month in expansionary territory. This pattern reminds us of the 2017 investment cycle, which saw sustained Ringgit appreciation following a similar pickup in economic activity. The initial 4.5% year-on-year rise in January’s industrial production confirms this trend has momentum.
Despite the positive outlook, global energy volatility remains a risk, so outright positions should be managed carefully. Selling out-of-the-money USD/MYR call options could be a way to generate income while maintaining a bullish MYR stance. This strategy benefits from both a strengthening Ringgit and potentially decreasing currency volatility as the policy framework provides stability.
Create your live VT Markets account and start trading now.
Start trading now – Click here to create your real VT Markets account