South Korea’s trade balance fell to $15.376bn in February. It had been $15.5bn in the previous period.
The change equals a drop of $0.124bn. This is a decrease of about 0.8%.
Trade Surplus Slips And Momentum Cools
We are seeing South Korea’s trade surplus dip slightly to $15.376 billion for February, a small step down from the prior month. This is not a cause for alarm, but it is a signal of slowing momentum in a key global exporter. For us, this suggests that the strong upward trend in Korean assets may be pausing, making it a time to consider protective strategies.
This data could put some light pressure on the Korean Won, which has already softened to around 1,275 per U.S. dollar this past week. We might look at buying some short-term, out-of-the-money USD call options as a cheap way to bet on further Won weakness. This provides a hedge against our exposure to Korean equities without taking on massive risk.
The KOSPI index, which is heavy with major exporters, is sensitive to this kind of news. Given that global demand for semiconductors shows signs of moderating—with chip export growth slowing to 5% from 8% a month earlier—we could use KOSPI 200 index put options. This would protect our long-term holdings from a potential short-term dip over the next few weeks.
Looking back to the spring of 2025, we saw a similar dip in the trade balance which preceded a brief period of volatility in the Won. That experience taught us that volatility itself can be the most profitable asset to trade in these moments. Buying VIX-equivalent options on the Korean market (VKOSPI) could be a smart play if we expect market uncertainty to increase.
US President Donald Trump said NATO could face a “very bad” future if US allies do not help to open the Strait of Hormuz, according to the Financial Times. He said on Sunday that he had asked about seven countries to send warships to keep the strait open.
Trump said the requests have not produced any commitments. The report said oil prices are rising during the Iran war.
Oil Market Reaction And Volatility
Australia’s Transport Minister Catherine King told ABC on Monday that Australia will not send ships. She said Australia has not been asked to contribute.
Market prices moved slightly, with West Texas Intermediate (WTI) down 0.08% at $97.35 at the time of writing.
Given the lack of commitment from allies to secure the Strait of Hormuz, we should anticipate continued or increased volatility in oil markets. The CBOE Crude Oil Volatility Index (OVX) has been trading above 55 for the past two weeks, a level we haven’t sustained since the initial phase of the conflict in late 2025. This suggests that options premiums will remain elevated, making strategies like buying straddles on oil ETFs like USO attractive to capture sharp price moves in either direction.
The primary risk is a further supply constriction, as about a fifth of the world’s petroleum passes through the Strait. Recent maritime data shows tanker insurance premiums for the region have tripled in the last month, and traffic is down nearly 15%. A sustained disruption could easily push WTI prices toward the $110-$120 range, making long-dated call options a logical consideration for traders with a bullish outlook.
Historical Parallel And Positioning
We must remember the price action from the initial invasion of Ukraine in 2022, when Brent crude briefly topped $130 per barrel before settling. The current lack of a unified NATO naval response creates a similar, if not more precarious, situation for global supply chains. This historical precedent suggests the current price of $97.35 has significant room to run higher if the conflict escalates further.
Beyond direct energy plays, we see opportunities in hedging against broader economic fallout. Persistently high oil prices will strain transportation and industrial sectors, and we’ve seen funds increasing short positions on airline and shipping stocks. Buying put options on transportation ETFs could serve as an effective hedge against a prolonged period of expensive fuel.
The geopolitical tension also reinforces the classic safe-haven trades. Gold has already seen inflows, with futures climbing 4% over the past two weeks to over $2,450 an ounce. Simultaneously, call option volume on major defense contractors like Lockheed Martin and RTX has increased, as the market anticipates more military spending regardless of how the Strait of Hormuz situation is resolved.
Create your live VT Markets account and start trading now.
Start trading now – Click here to create your real VT Markets account
A spokesperson from China’s National Bureau of Statistics said the economy has started the year well, driven by “new productive forces” such as technological innovation and AI. The spokesperson said the economy still faces a pattern of strong supply and weak demand.
The spokesperson said China’s energy supply capacity is sufficient to handle volatile global prices. The spokesperson also said the economy is expected to maintain a steady trend this year.
Policy Support And The Demand Gap
China’s price situation is expected to improve as the government implements plans to raise incomes and support consumption. These measures are intended to support consumer demand and the wider economy during 2026.
There was no immediate market impact reported for the Australian Dollar. At the time of writing, AUD/USD was 0.4% higher, trading near 0.7000.
We are hearing familiar reassurances from Beijing about a sound start to the year. However, the key admission remains the ‘strong supply, weak demand’ imbalance. This is why the market showed little reaction, as this problem has been priced in for months.
For traders, this reinforces the strategy of selling rallies in the Australian dollar, particularly as AUD/USD approaches the 0.7000 resistance level. Recent data supports this caution, with China’s February 2026 retail sales missing forecasts by coming in at just 4.2%. This signals that the consumer is not yet spending with confidence.
Trading Implications Across Fx And Commodities
The gap between official optimism and weak underlying data suggests a period of heightened uncertainty. We should consider buying volatility, perhaps through put options on the AUD or proxies for Chinese growth. We saw a similar pattern in the third quarter of 2025, where official statements were followed by spikes in CNH volatility.
This weak demand directly impacts industrial metals, meaning any strength in copper or iron ore should be viewed with skepticism. Portside iron ore inventories have recently climbed above 148 million tonnes, a two-year high, underscoring the supply glut. This creates opportunities for traders to position for a potential pullback in commodity prices.
The mention of ‘new productive forces’ like AI does present a more nuanced opportunity. A potential strategy is to go long Chinese tech indices, which benefit from state support, while maintaining a short position on old-economy proxies. This allows us to trade both sides of China’s uneven economic recovery.
Create your live VT Markets account and start trading now.
Start trading now – Click here to create your real VT Markets account
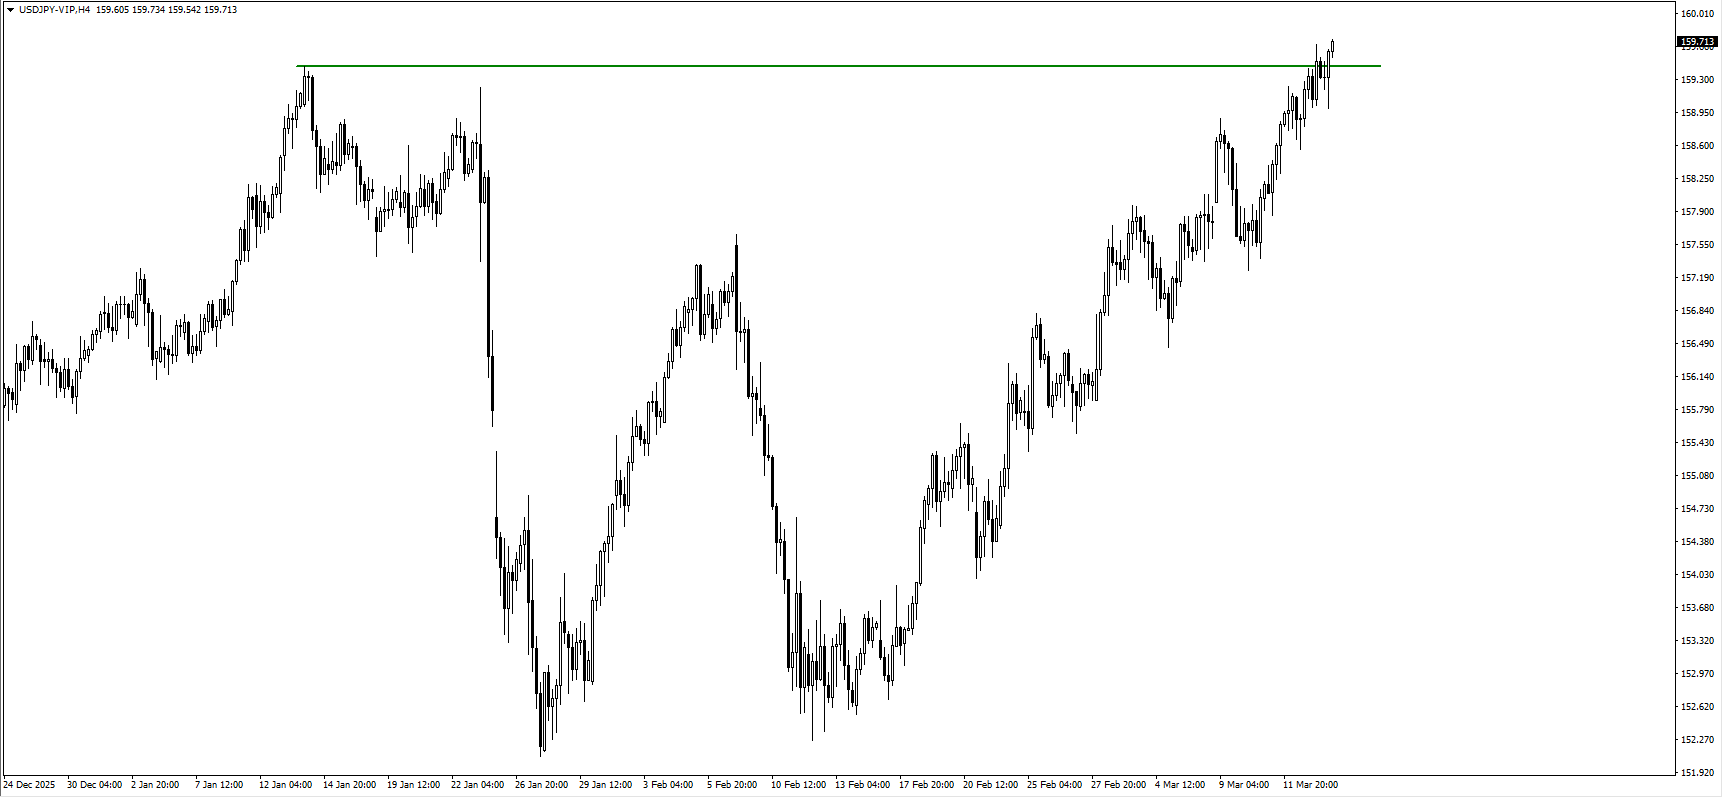
USD/JPY edged lower after four straight days of falls, trading near 159.60 in Asian hours on Monday. It stayed inside an ascending channel on the daily chart.
The pair remained above the rising 50-day Exponential Moving Average (EMA), keeping the near-term direction upward. The nine-day EMA sat just under the spot price and acted as support.
Momentum Signals Remain Bullish
The 14-day Relative Strength Index (RSI) was in the high 60s, pointing to strong upward momentum. It was not yet at an extreme overbought level.
Price tested 159.75, the highest level since July 2024, reached on 13 March. The next level was the top of the channel near 161.30.
A break above the channel could open a move towards 162.00, the all-time high from July 2024. On the downside, first support was near 158.55 at the channel base and the nine-day EMA.
If price falls below that area, momentum could weaken and bring 156.44, the medium-term average, into view. The technical analysis in the report used an AI tool.
Options Strategy And Key Risks
The USD/JPY pair is holding strong near 159.60, reflecting a persistent bullish sentiment. We’re seeing this strength because recent US inflation and jobs data for February 2026 came in hotter than expected, suggesting the Federal Reserve will keep interest rates high. In contrast, the Bank of Japan remains cautious, having only made minor adjustments since ending negative rates back in 2024, which keeps the yen weak.
For derivative traders, this points toward buying call options to capitalize on the upward momentum. We are looking at strike prices near the 161.30 channel resistance or even the historic 162.00 high that was recorded back in July 2024. Options with expirations in late April or May 2026 could provide enough time for these levels to be tested.
However, we must be cautious as the pair approaches levels that prompted verbal warnings from Japanese officials throughout 2024 and 2025. The risk of sudden intervention to strengthen the yen makes outright long positions risky and increases the cost of options due to higher implied volatility. A bull call spread, such as buying a 160.00 call and selling a 162.00 call, could be a prudent way to capture upside while limiting cost and defining risk.
We should also prepare for a potential pullback if the pair breaks below the key support confluence around 158.55. Such a move could be triggered by any surprise shift in Bank of Japan commentary or weaker-than-expected US economic figures. In that case, buying put options with a strike price around 158.00 would offer a hedge or a way to profit from a reversal towards the 156.50 area.
Create your live VT Markets account and start trading now.
Start trading now – Click here to create your real VT Markets account
South Korea’s money supply growth slowed to 7.1% in January. This was down from 7.3% in the previous period.
The slowdown in South Korea’s M2 money supply growth to 7.1% in January is a signal we can’t ignore. It suggests a tightening of financial conditions, even without an official interest rate hike from the Bank of Korea (BOK). This trend points to less liquidity available in the system, which typically precedes a cooler economic environment.
This aligns with the latest February 2026 inflation report, where core CPI remained sticky at 3.2%, continuing to exceed the central bank’s 2% target. The BOK has maintained its policy rate at 3.5% for over a year, and this persistent inflation gives them no reason to consider cutting rates soon. This reinforces the idea that monetary policy will remain restrictive for the foreseeable future.
For our strategies, this points towards a stronger Korean won. As long as the BOK maintains this tighter stance while other major central banks appear more dovish, the interest rate differential should support the currency. We are therefore looking at opportunities in KRW/USD call options or futures contracts betting on won appreciation.
This environment is also a headwind for the KOSPI index. Reduced liquidity and the prospect of borrowing costs staying high will likely weigh on corporate earnings and equity valuations. Consequently, we see value in protective strategies, such as buying puts on the KOSPI 200 index or establishing bearish put spreads for the second quarter.
We must remember how the market incorrectly priced in significant rate cuts throughout the second half of 2025, only to be disappointed by the BOK’s resolve. That experience suggests the market may again be too optimistic about a policy pivot. This makes short-term bond futures, which would rally on rate cuts, a risky proposition right now.
Start trading now – Click here to create your real VT Markets account
Gold traded near $5,000 in Asia on Monday, but came under selling pressure. Attention was on central bank policy announcements this week, alongside the Middle East conflict.
Traders monitored developments in the US-Israel war with Iran, which can support demand for safe-haven assets. The Trump administration said it expects the conflict to end within weeks or “sooner”.
Geopolitical Conflict Drives Market Focus
Israel’s military said its campaign is planned to continue for at least three more weeks. Over the weekend, US forces targeted every military site on Kharg Island, an Iranian oil export hub.
Iran threatened retaliation against any US-linked oil facilities in the region. Rising tensions pushed oil prices higher, adding to inflation worries.
These inflation concerns led markets to expect the Federal Reserve to delay interest-rate cuts. Higher rate expectations can weigh on non-yielding assets such as gold.
Monetary policy decisions are also due from the RBA, BoJ, ECB, and BoE this week, alongside the Fed. Rates are expected to stay unchanged at current levels, except the RBA, which is expected to raise them again.
Central Bank Decisions Shape Rate Expectations
We are seeing a tug-of-war in the gold market right now. While the conflict in Iran would normally boost safe-haven demand, the side effects are creating a headwind. The main issue is that rising oil prices are fueling inflation fears, making a Fed rate cut less likely.
The surge in oil prices is not a small matter; we have seen WTI crude futures jump over 20% in the last ten days to trade above $155 a barrel, a level not seen in over a decade. This directly impacts inflation expectations, which were already elevated after last month’s CPI report showed a stubborn 4.5% annual rate. This data makes it very difficult for the Federal Reserve to signal any upcoming policy easing.
This situation feels very similar to the energy crises of the 1970s, where geopolitical conflict in the Middle East led to soaring energy costs and inflation. We also saw a smaller preview of this effect back in 2025 during the expanded conflicts in the Red Sea, where shipping disruptions caused a temporary spike in commodity prices. Historically, gold performs well in these environments, but only if central banks are not forced into aggressive tightening cycles.
For derivative traders, this suggests a period of extremely high volatility, which is where opportunities can be found. With the Fed’s decision looming this week, implied volatility on gold options has reached its highest point in two years, making strategies like straddles attractive if you expect a large price swing in either direction. One could also consider buying call options on oil futures as a direct hedge against further conflict escalation and its inflationary impact.
We should also keep an eye on the other central banks, especially the Reserve Bank of Australia. If the RBA goes ahead with its expected rate hike while the Fed holds firm, it could create significant movement in currency pairs like the AUD/USD. This global divergence shows that the inflation fight we thought was ending in 2025 is far from over.
The immediate focus for the next few days will be the central bank announcements, which will likely dominate the geopolitical headlines. However, any retaliatory action by Iran against oil facilities would immediately shift the market’s attention back to the conflict. The key is to trade the volatility over the next three weeks, as the market is pulled between fears of war and fears of sustained high interest rates.
Create your live VT Markets account and start trading now.
Start trading now – Click here to create your real VT Markets account
AUD/USD rose after two days of declines, trading near 0.7010 in Asian hours on Monday. The move followed the release of Chinese economic data, which can affect the Australian Dollar due to trade links between China and Australia.
China’s National Bureau of Statistics said Retail Sales increased 2.8% year-on-year in February, compared with 2.5% expected and 0.9% in December. Industrial Production rose 6.3% year-on-year, versus a 5.1% forecast and 5.2% previously.
Dollar Weakness Supports Risk Mood
The pair stayed supported as the US Dollar weakened while risk aversion eased, after The Guardian reported US Energy Secretary Chris Wright expects the US-Israel conflict with Iran to end within “the next few weeks”. The report suggested this could allow oil supplies to recover and energy prices to fall.
Tensions also increased after US forces reportedly targeted every military site on Kharg Island, which handles nearly 90% of Iran’s oil exports. President Donald Trump said oil infrastructure was not struck, while Iran warned it could retaliate against US-linked oil facilities in the region.
Trump called on allied nations, including the UK, France, China, and Japan, to help secure the Strait of Hormuz, with reports of a possible White House announcement soon. EU foreign ministers are meeting in Brussels to discuss a naval response to the effective closure of the Strait.
Attention now turns to the US Federal Reserve meeting on Wednesday. No change to the federal funds rate is expected, with focus on guidance for the rest of the year and inflation risks linked to higher energy prices.
China Data Lifts Aussie Dollar Outlook
The better-than-expected economic data from China provides a short-term boost for the Australian dollar. We are seeing Australia’s commodity exports to China remain robust, with iron ore shipments in February 2026 totaling over 78 million tonnes. This underlying strength suggests that selling out-of-the-money puts on the AUD/USD could be a viable strategy to collect premium while the 0.7000 level holds.
Conflicting reports from the Middle East are creating significant uncertainty for the US dollar and oil markets. While talk of the conflict ending has eased immediate fears, the US strikes on Kharg Island introduce a serious risk of escalation. This push-and-pull on sentiment makes trading short-term volatility, perhaps through options on the VIX index, a key consideration.
We must prepare for the risk of a sudden oil price shock, as nearly 90% of Iran’s oil exports are now threatened. Looking back, we remember how Brent crude prices jumped 12% in a single week in mid-2025 when shipping was last seriously threatened in the Strait of Hormuz. Consequently, buying call options on crude oil futures could serve as a vital hedge for portfolios over the next few weeks.
The Federal Reserve meeting on Wednesday is the main event risk this week. While no rate change is expected, the latest US inflation report for February 2026 showed CPI at a stubborn 3.2%, which will force policymakers to address rising energy costs. Any surprisingly hawkish tone from the Fed would likely strengthen the US dollar, making protective puts on pairs like AUD/USD a sensible precaution ahead of the announcement.
Create your live VT Markets account and start trading now.
Start trading now – Click here to create your real VT Markets account
Middle East conflict keeps USOil elevated and may delay Fed rate cut expectations.
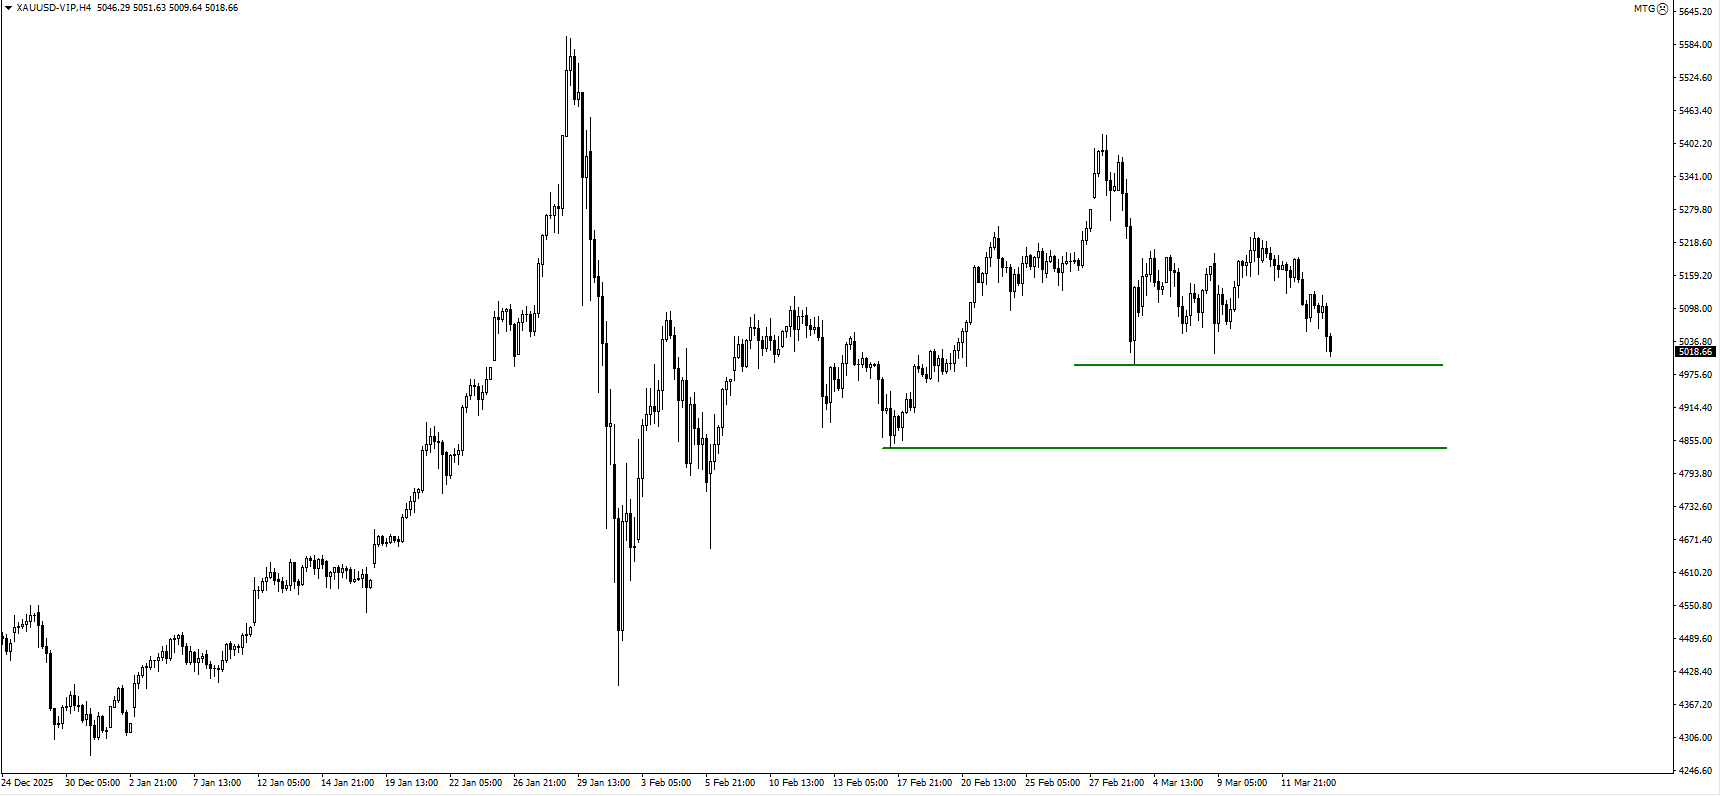
XAUUSD tests downside liquidity near 4,996 as USDX consolidates.
BOJ policy decision could move USDJPY as price approaches 160.
FOMC press conference may reset Fed rate expectations.
Markets are now reacting to a geopolitical confrontation that began with Operation Epic Fury on 28 February 2026. What initially started as targeted US strikes has expanded into a broader regional conflict with no clear timeline for resolution.
Bloomberg's Jeff Mason, Joumanna Bercetche and Ethan Bronner discuss US, Israel launch of 'Operation Epic Fury' in Iran on Bloomberg This Weekend.
The conflict has quickly moved beyond military headlines and into macroeconomics. Traders are now focused on how long the US economy can absorb the shock of rising energy prices and geopolitical risk.
Brent crude surged from roughly $70 to above $110 per barrel, signalling a sharp repricing of geopolitical risk. Analysts warn that if oil prices remain above $130, global GDP growth could fall by about 0.6% in the first half of 2026.
If oil prices continue to rise, inflation expectations could climb again and delay Fed rate cuts.
The Market “Crack” Point
Energy markets influence consumer spending faster than most macro variables.
Historically, US gasoline prices approaching $4.00 per gallon have triggered sharp declines in consumer spending. That level is often where the broader economy begins to feel the full impact of rising oil prices.
If consumer demand slows while inflation remains elevated, the Federal Reserve faces a difficult choice between supporting growth and controlling prices.
For traders, this creates a two-sided risk environment.
Equities and crypto tend to weaken if economic growth slows, while gold can benefit from uncertainty and geopolitical demand.
Consumer stress from energy prices can drive volatility across XAUUSD, BTCUSD and SP500.
The Strait Of Hormuz And Global Oil Supply
Energy supply risk has become another major concern.
Roughly 20% of the world’s oil supply passes through the Strait of Hormuz, making it one of the most important energy chokepoints in global trade.
Any threat to shipping routes or tanker traffic in that region can immediately push oil prices higher.
The US Navy can attempt to secure shipping lanes, but maintaining that protection requires a large and sustained military presence. Strategic petroleum reserves can cushion short-term disruptions, but they cannot fully offset a prolonged supply shock.
President Donald Trump said he is “demanding” that other countries contribute to the defense of Strait of Hormuz as it remains effectively closed to oil tankers https://t.co/ARQXPCyWw2
Continued threats to the Strait of Hormuz could keep oil elevated and sustain inflation pressure.
If you’d like to read more about how wars affect oil prices, check out our Opinion article here.
The Stagflation Risk
The most dangerous scenario for markets is stagflation.
Rising oil prices increase inflation while also reducing consumer spending and corporate profitability. That combination slows economic growth while keeping prices elevated.
This creates a policy dilemma for the Federal Reserve. Under normal circumstances, the Fed would keep rates high to control inflation. However, a sharp slowdown or market sell-off could increase pressure on policymakers to ease financial conditions.
The geopolitical context adds another layer to the debate. Some analysts believe that a severe market downturn during a national security crisis could push political pressure on the Fed to cut rates aggressively.
Stagflation would create volatility across currencies, commodities and equities.
Strategic Endurance And Market Psychology
The conflict also introduces a strategic endurance element that markets must consider.
Iran has built a decentralised defence structure designed to withstand sustained attacks. Instead of relying on a single command centre, the country operates through multiple regional zones that can continue functioning even if leadership structures are disrupted.
This strategy is designed to prolong the conflict and increase the economic cost for its opponents.
The longer the conflict continues, the greater the pressure on oil prices, inflation and financial markets.
A prolonged conflict increases the probability of persistent oil volatility and macro instability.
Key Symbols To Watch
XAUUSD | BTCUSD | USDX | SP500 | USDJPY
Upcoming Events
17 March 2026
1. AUS RBA Press Conference
RBA tone may affect risk sentiment across Asia.
18 March 2026
1. CAD BOC Press Conference
Guidance on inflation outlook may influence oil-linked currencies
USDJPY near 160 increases intervention sensitivity
3. UK Official Bank Rate
UK policy outlook may influence GBP volatility
4. EU ECB Press Conference
ECB commentary may affect the EURUSD and USDX direction
Key Movements Of The Week
Gold (XAUUSD)
XAUUSD continues drifting lower with 4,996.04 acting as the key downside trigger.
Buyers may reappear near 4,842 if geopolitical risk increases.
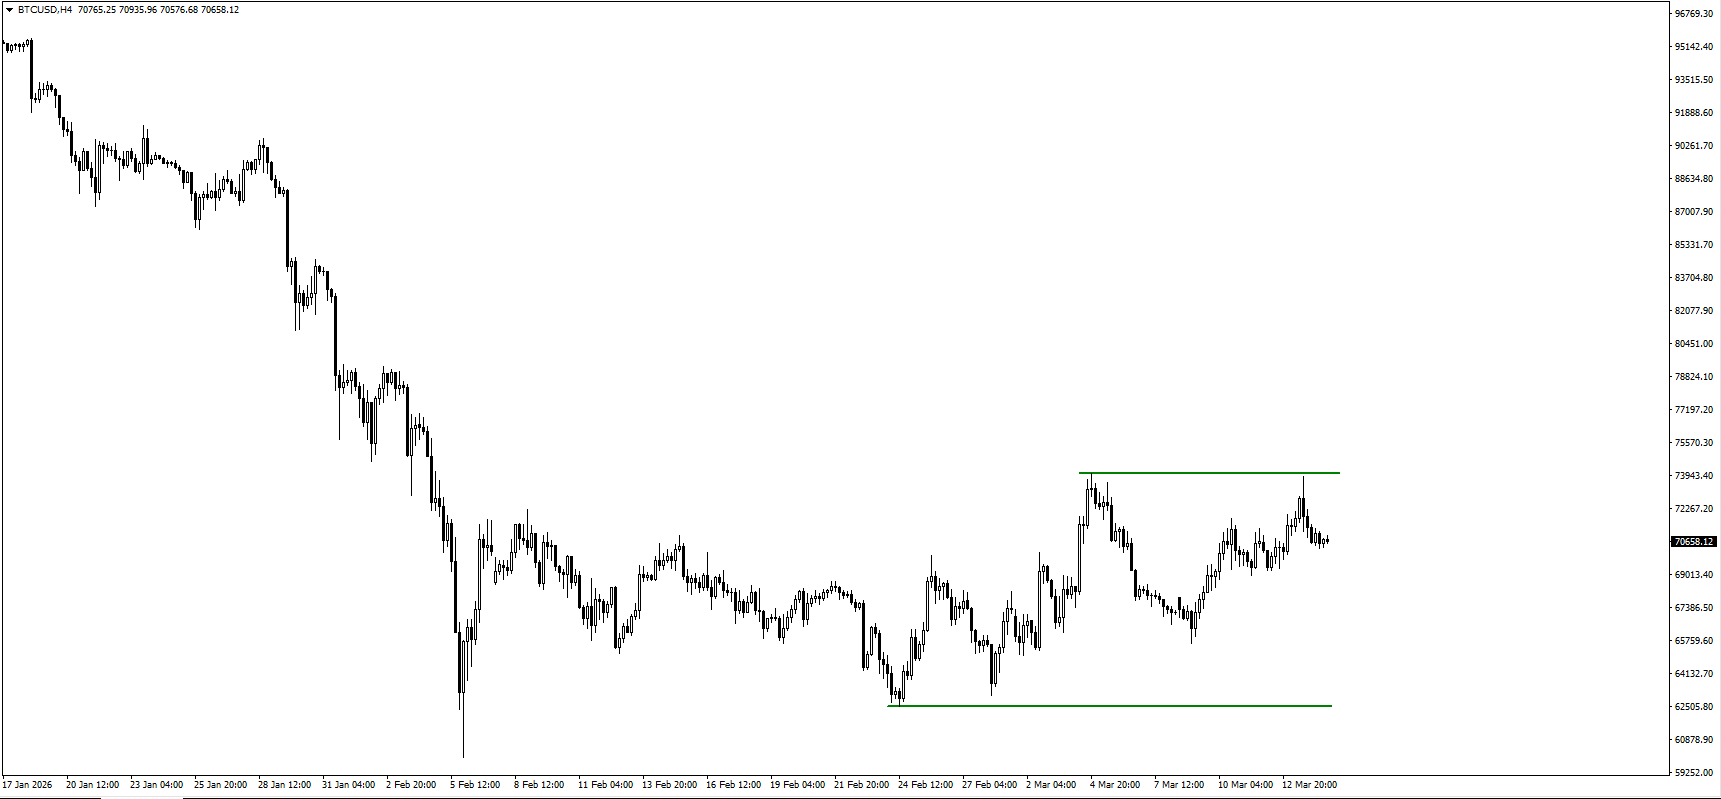
Bitcoin (BTCUSD)
BTCUSD consolidating below 74,041 resistance.
62,502 remains the last structural defence for bullish momentum.
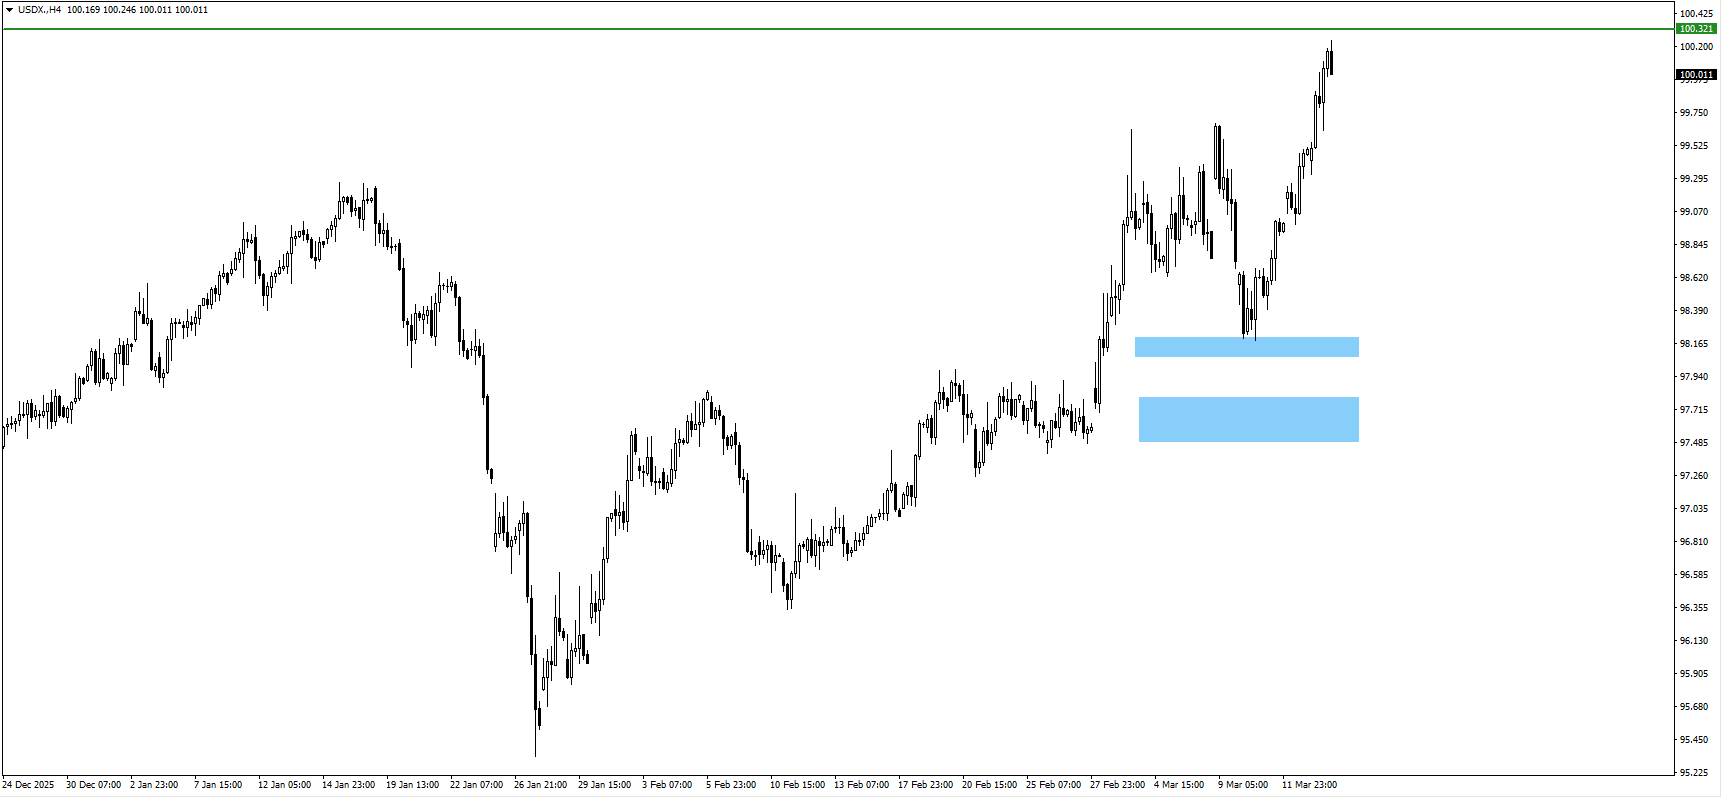
US Dollar Index (USDX)
USDX completed a five-wave advance.
100.321 remains the next upside target if dollar strength continues.
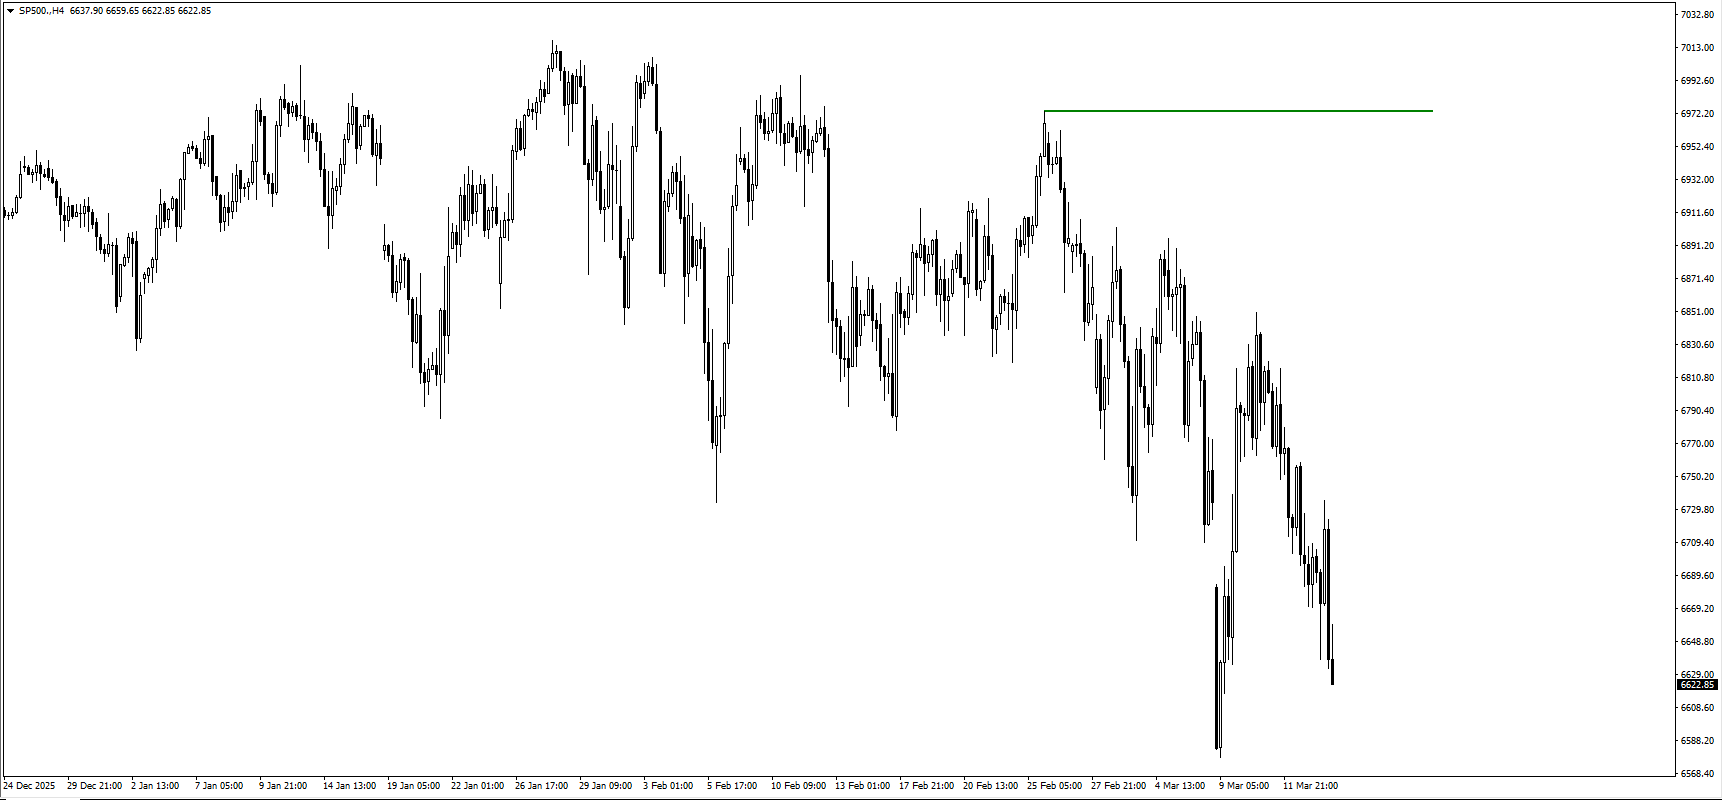
S&P 500 (SP500)
SP500 erased more than 50% of weekly gains during Friday’s session.
6,517 becomes the key downside trigger for sellers.
USDJPY
USDJPY broke above the 159.45 high, signalling continued yen weakness.
Traders now watch 160.00 as the next psychological level ahead of the BOJ press conference.
Bottom Line
The central market theme this week revolves around the interaction between geopolitics, oil prices and monetary policy. Rising energy prices from the Middle East conflict increase inflation risk just as traders anticipate potential Fed easing.
That tension creates a volatile backdrop for XAUUSD, BTCUSD and SP500, while USDJPY approaches the psychologically important 160 level ahead of the BOJ decision.
Central bank communication from the FOMC and BOJ may therefore determine whether markets stabilise or enter another phase of macro-driven volatility.
Oil sits at the centre of the macro story because the Middle East conflict has turned energy supply risk into an inflation risk. If crude stays elevated, traders may push Fed rate cut expectations further out, which can ripple through XAUUSD, USDX, BTCUSD and SP500.
2. Why does the Strait of Hormuz matter so much to traders?
The Strait of Hormuz handles a large share of global oil flows, so any threat there can keep crude prices bid. For traders, that means higher inflation pressure, more uncertainty around central bank policy, and wider volatility across commodities, currencies and equities.
3. How do higher oil prices affect Fed rate cut expectations?
Higher oil prices can keep headline inflation sticky even if broader growth begins to soften. That makes it harder for the Fed to sound dovish, because cutting too soon could risk another inflation push.
4. Why is XAUUSD under pressure if geopolitical risk is rising?
Gold usually benefits from fear, but it also reacts to the dollar and interest rate expectations. If traders respond to war-driven inflation by buying USDX and pushing back Fed rate cut expectations, XAUUSD can struggle even in a tense geopolitical backdrop.
5. What is the key level to watch on XAUUSD this week?
The first downside level is 4,996.04. If that gives way, traders may start looking for a deeper move, while 4,842 remains the area where buyers could step back in.
NZD/USD rose to about 0.5805 in Asian trading on Monday, with the New Zealand Dollar edging up after new Chinese activity data. China’s Retail Sales rose 2.8% year on year in January–February, up from 0.9% and above the 2.5% forecast.
China’s Industrial Production increased 6.3% year on year in January–February, compared with 5.2% previously and above the 5.1% consensus. The report noted limited impact on the Kiwi despite the stronger China figures.
Rbnz Policy Outlook
The Reserve Bank of New Zealand kept the Official Cash Rate at 2.25% at its February meeting. Markets are pricing in a 25-basis-point rise in September 2026.
Rising Middle East tensions, including disruption risks in the Strait of Hormuz, may support the US Dollar due to demand for safer assets. US President Donald Trump said the US is discussing policing the strait with other countries, and that Israel is working with the US on securing the route.
Over the weekend, US forces targeted military sites on Kharg Island, an Iranian oil export hub. Iran has said it will retaliate against any US-linked oil facilities in the region.
As of March 16, 2026, we see the New Zealand Dollar facing significant headwinds despite a small rally near 0.5805. The escalating geopolitical tensions in the Middle East are pushing capital towards the safe-haven US Dollar. This flight to safety is being amplified by recent events, with WTI crude oil prices surging over 12% in the last month to trade above $92 a barrel, reflecting a substantial risk premium in the market.
Market Implications For Nzdusd
While the latest Chinese industrial and retail data for early 2026 came in stronger than expected, we note that the market has largely ignored this positive news for the Kiwi. The muted reaction suggests that traders are far more concerned with the dovish Reserve Bank of New Zealand (RBNZ) and global risk sentiment. This is a clear signal that the NZD’s traditional link to Chinese economic health is currently being overshadowed by more powerful forces.
The policy divergence between central banks is a critical factor driving our view. The RBNZ is firmly on hold at a 2.25% cash rate, with markets not pricing in a hike until September, whereas the US Federal Reserve’s policy rate stands at a more attractive 3.50%. This yield differential of 1.25% in favor of the US Dollar makes holding Kiwi positions costly and encourages a carry trade that sells the NZD.
Given this environment, we see limited upside for the NZD/USD pair in the coming weeks. Broader market fear, as measured by the VIX index, has climbed to over 20, a sharp contrast to the calmer sub-15 levels we enjoyed for much of 2025. In such risk-off periods, commodity-linked currencies like the Kiwi tend to underperform significantly as investors prioritize capital preservation.
For traders using derivatives, this points towards strategies that benefit from a falling or range-bound NZD/USD. We believe buying put options with strike prices below 0.5750 offers a direct way to profit from a potential downturn. Alternatively, establishing bear call spreads by selling a call option around 0.5850 and buying one at a higher strike could be an effective way to generate income while defining risk.
Adding to the domestic pressure, the latest Global Dairy Trade auction showed a 1.8% fall in whole milk powder prices, further weighing on New Zealand’s terms of trade. We saw a similar playbook during the geopolitical turmoil of 2022, where a hawkish Fed and global uncertainty drove the NZD/USD sharply lower. History suggests that in a battle between a dovish RBNZ and a fearful global market, the path of least resistance for the Kiwi is downwards.
Create your live VT Markets account and start trading now.
Start trading now – Click here to create your real VT Markets account
China’s Retail Sales rose 2.8% year-on-year in January to February, above the 2.5% forecast and up from 0.9% in December. The figures were released by the National Bureau of Statistics on Monday.
Industrial Production increased 6.3% year-on-year over the same period, compared with a 5.1% forecast and 5.2% previously. Fixed Asset Investment rose 1.8% year-to-date year-on-year in January to February, beating the -0.4% forecast and improving from -3.8% in December.
China Data Beats Expectations
In currency markets, the release had limited effect on the Australian Dollar. At the time of writing, AUD/USD was up 0.44% on the day at 0.7011.
We are looking back at the strong Chinese economic data from early 2025, where industrial production beat expectations by rising 6.3%. At that time, retail sales also showed a solid 2.8% year-over-year increase, signaling a potential rebound. Despite this surprisingly positive news, the Australian dollar saw almost no reaction.
This event taught us that the tight link between Chinese data and the Aussie dollar was loosening. Other factors, likely concerns about global central bank policies or our own domestic inflation, were weighing more heavily on traders’ minds. It was a clear sign that we could no longer trade the AUD as a simple proxy for China’s economic health.
Now in March 2026, this lesson is even more critical as China’s recovery shows signs of maturing unevenly. Recent manufacturing PMI figures have struggled to consistently stay in expansionary territory above 50, a very different picture from the strong industrial numbers we saw last year. Furthermore, China’s consumer price index just recently moved out of deflationary territory, showing that domestic demand remains fragile.
For us, the price of iron ore is now a much more dominant driver for the Aussie dollar. After hitting peaks over a year ago, iron ore prices have recently fallen below $110 per tonne amid concerns over Chinese property sector demand and steel production cuts. This is directly pressuring the AUD, regardless of broader industrial production figures.
Iron Ore Drives The Aussie
Therefore, we should be wary of buying AUD/USD call options based solely on upcoming Chinese data releases. The muted reaction we witnessed in 2025 is likely to be repeated, especially with weak commodity sentiment. We must consider that even a positive surprise in China’s numbers may not be enough to lift the currency.
Instead, traders should consider strategies that benefit from volatility around our own Reserve Bank of Australia announcements or US inflation data. These domestic and global factors are now more influential on the AUD’s direction than the headline figures from China. The market is looking for stronger signals about commodity consumption, not just production output.
Create your live VT Markets account and start trading now.
Start trading now – Click here to create your real VT Markets account