The Reserve Bank of Australia (RBA) said it cannot forecast the cash rate path with confidence because of uncertainty over the breadth and duration of the Middle East conflict. The minutes noted that oil price moves are a key risk to the outlook.
The RBA estimated that oil staying around $100 would push headline CPI to about 5% in Q2. This would be 0.75% higher than expected in February, and the minutes said persistently higher oil prices would lift inflation more widely over time.
Policy Outlook Under Oil Price Uncertainty
A majority of policymakers considered further policy tightening likely in the near term. A minority raised concerns about the risk of stagflation.
Separately, the text reported that about half a million young Australian workers will receive up to a 42% pay increase linked to changes in minimum wage rates. The article stated it was produced with help from an AI tool and reviewed by an editor.
We see the RBA’s stated uncertainty playing out as we head into the second quarter of 2026. Back in 2025, we saw inflation moderate, but with Brent crude now hovering near $98 a barrel, that progress is at risk. This brings the central bank’s old forecast of 5% headline CPI directly into the spotlight for the coming months.
This high degree of uncertainty suggests traders should consider buying volatility on Australian interest rate futures. The RBA is clearly split between fighting inflation and worrying about stagflation, meaning their next moves are genuinely unpredictable. This environment makes strategies that profit from a large move in either direction, rather than a specific directional bet, more appealing.
Implications For Rates Wages And Currency Markets
We cannot forget the domestic wage pressures that were flagged, which continue to be a factor. The latest data from the end of 2025 showed the Wage Price Index was still elevated at 4.2%, confirming that inflation has deep domestic roots beyond just energy costs. This gives the more hawkish members of the RBA board ammunition to argue for further tightening.
For currency traders, this puts the Australian dollar in a difficult position, creating opportunities in the options market. While higher interest rates should be supportive, the risk of a sharp economic slowdown could weigh heavily on the currency. Therefore, positioning for a wider trading range in AUD/USD seems more sensible than betting on a breakout in one direction.
Create your live VT Markets account and start trading now.
Start trading now – Click here to create your real VT Markets account
German retail sales fell again in February, based on figures from Destatis. Sales dropped by 0.6% month-on-month, compared with a forecast rise of 0.2%.
January sales were revised down to a 1.1% monthly fall from -0.9%. On a year-on-year basis, retail sales rose by 0.7%, below the 1% forecast and down from the previous 1.2%.
Euro Reaction After The Release
There was no immediate move in the euro after the release. At the time of reporting, EUR/USD was slightly higher at about 1.1470.
Retail sales data from Statistisches Bundesamt Deutschland track short-term changes in sales across Germany’s retail sector. The monthly percentage change is used as an indicator of consumer spending and is often monitored for possible effects on the euro.
We remember looking at German retail sales data from February 2025, which showed a surprising contraction and a downward revision for the prior month. This data pointed toward weakness in the German consumer, a trend that warrants close attention. That annualized growth of only 0.7% last year was an early warning sign for the broader Eurozone economy.
That pattern of consumer weakness appears to be continuing into this year. The latest data for February 2026, released just weeks ago, showed another monthly decline of 0.4%, defying expectations for a modest rebound. This confirms that the consumer spending issue we saw developing in 2025 has not yet been resolved and may be deepening.
Implications For Traders And The Euro
This persistent weakness, combined with the latest Eurozone manufacturing PMI which printed at a contractionary 47.8, puts pressure on the European Central Bank. While the March flash HICP inflation estimate held at 2.6%, the deteriorating growth outlook complicates the ECB’s policy path. We believe this increases the probability of the central bank signaling a more dovish stance in the coming months.
For traders, this outlook suggests considering downside protection on the Euro. Buying EUR/USD put options with an expiry in late April or May could be a prudent way to position for a potential slide. This strategy offers a defined risk while providing exposure to any negative reaction from upcoming ECB commentary or data releases.
Volatility in the currency markets may also present an opportunity. With the market uncertain about the timing of any potential ECB rate cut, options pricing may not fully reflect the risk of a sharp move. We see value in looking at short-dated volatility instruments tied to the Euro, as a surprise in either growth or inflation data could trigger a significant repricing.
Specifically, with EUR/USD currently trading around 1.0830, we are monitoring key support levels. Any break below the 1.0800 psychological level could accelerate selling pressure. Therefore, puts with strike prices around 1.0750 could offer an effective hedge against a fresh downturn in the currency pair.
Create your live VT Markets account and start trading now.
Start trading now – Click here to create your real VT Markets account
The US Dollar rose for a seventh straight day against the Canadian Dollar on Tuesday. USD/CAD held above 1.3920 after reaching a 2026 high of 1.3945 on Monday.
The US Dollar trend stayed positive even as the US Dollar Index eased. Reports that President Donald Trump may seek a swift end to the war in Iran lifted risk appetite in early Asian trading.
Trump Signals Potential Iran Exit
The Wall Street Journal reported on Tuesday that Trump told close aides he is willing to end the military campaign in Iran even if the Strait of Hormuz stays largely closed. The report said he sees reopening it as extending the war beyond five or six weeks, so he would leave that for later.
The report pushed the US Dollar lower against major peers as demand for safe assets eased. Asian markets fell moderately, while European and Wall Street futures pointed to a positive open.
Trump repeated a threat to destroy Iran’s energy plants if Tehran does not open the Strait of Hormuz. Iran rejected US peace proposals, launched more missiles at Israel, and Kuwaiti authorities reported an attack on an oil tanker anchored at Doha harbour.
On Monday, Federal Reserve Chair Jerome Powell played down expectations of an immediate rate rise and said inflation pressures are anchored for now. Treasury yields fell, adding pressure on the US Dollar.
Volatility Strategy Considerations
Given the conflicting signals, we see a high probability of sharp, unpredictable moves in the currency markets. The President’s comments on a swift end to the Iran conflict contrast sharply with the Fed’s dovish stance, creating an environment ripe for volatility. Derivative traders should consider strategies that profit from a large price swing, regardless of the direction.
We are seeing implied volatility on USD/CAD one-month options surge to levels not seen since the energy market turmoil in 2025. This indicates the market is pricing in a significant move as traders hedge against both a sudden peace deal or a major escalation in the conflict. Buying options, such as a straddle, could be an effective way to position for this uncertainty.
The situation is further complicated by oil prices, with West Texas Intermediate (WTI) crude currently holding above $95 per barrel due to the risk in the Strait of Hormuz. Normally, this would strengthen the Canadian dollar, but the overwhelming safe-haven demand for the US dollar is overriding this effect. A sudden resolution in Iran could cause both oil prices and the USD to fall simultaneously, leading to a complex reaction in USD/CAD.
The Fed’s recent communication adds another layer of risk for those holding long US dollar positions. According to the CME’s FedWatch tool, futures markets are now pricing in less than a 10% chance of an interest rate hike by June, a dramatic reversal from over 50% just last month. This dovish shift could quickly undermine the dollar’s strength if geopolitical tensions ease even slightly.
This reminds us of market reactions during the initial phases of past Middle East conflicts, where sharp risk-off rallies were often followed by equally sharp reversals on news of de-escalation. The current situation, with Trump’s rhetoric on one hand and ongoing missile attacks on the other, creates the perfect setup for a whipsaw market. We should therefore be prepared for the USD/CAD pair to violently reverse its recent gains.
Create your live VT Markets account and start trading now.
Start trading now – Click here to create your real VT Markets account
Tokyo’s March core CPI rose 1.7% year on year, below forecasts, as fuel subsidies reduced the impact of higher costs. An index excluding fresh food and fuel rose 2.3% after a 2.5% increase in February.
Higher oil prices and a weaker yen are expected to push inflation up. Markets are pricing a 70% chance of a Bank of Japan rate rise in April, with Governor Kazuo Ueda indicating that action is possible.
Growth Data And Near Term Context
February figures showed a 2.1% month-on-month fall in factory output and a 0.2% year-on-year drop in retail sales. These data are described as less relevant to current conditions.
The Q1 Tankan business survey is due next and is expected to inform the Bank of Japan ahead of its policy meeting. Rising energy costs and yen weakness may reduce household purchasing power and weigh on the recovery.
We see the market pricing a high probability of a Bank of Japan rate hike in April, driven by rising oil prices and a persistently weak yen. With USD/JPY having recently tested the 152 level, similar to the situation back in 2024, the pressure on the central bank to act is immense. Traders should consider buying puts on USD/JPY or establishing call spreads on the JPY to position for a potential strengthening of the currency.
The anticipation of this policy shift has pushed up implied volatility on yen currency pairs, making options more expensive. As of this morning, three-month implied volatility on USD/JPY is sitting near 9.5%, a significant jump from the lows we saw at the end of 2025. This suggests that while a hike is expected, the magnitude of the market’s reaction remains a key uncertainty.
Rates Positioning And Risk Assets
In the rates market, we are positioning for a steeper yield curve by selling short-term Japanese Government Bond (JGB) futures. This is a direct play on the Bank of Japan lifting its policy rate, a move that would echo the historic decision in March 2024 to end negative interest rates. Any hawkish surprise in the upcoming Tankan survey will only accelerate this repricing.
For equities, a rate hike could create headwinds for the Nikkei 225, which has been hovering near all-time highs above 40,000 points. We are hedging long equity portfolios by purchasing out-of-the-money puts on Nikkei futures. Looking back at the market’s initial wobble after the 2024 hike, we see a precedent for short-term weakness even if the long-term trend remains positive.
These pressures are not happening in a vacuum, as WTI crude oil is now firmly above $85 per barrel, directly feeding into inflation and squeezing consumer spending. The drop in February retail sales, although dated, highlights the fragility of the consumer. This combination of external cost pressures and a weak currency gives the Bank of Japan very little room to remain accommodative.
Create your live VT Markets account and start trading now.
Start trading now – Click here to create your real VT Markets account
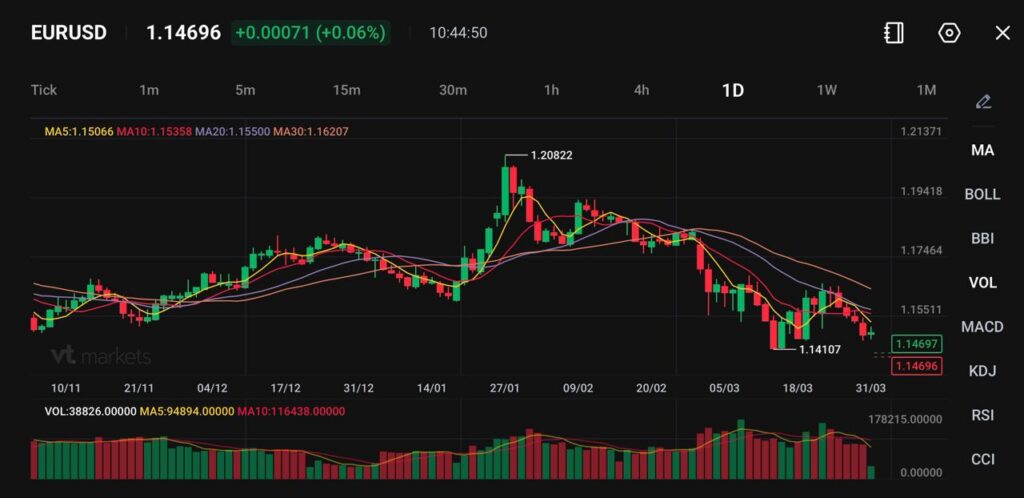
EURUSD trades at 1.14696, up +0.00071 (+0.06%), but the euro ended March below $1.15 after losing more than 2% against the dollar during the month.
Markets now expect at least two ECB rate hikes in 2026, replacing earlier pricing that implied a 40% chance of a rate cut.
Rising energy costs and a largely blocked Strait of Hormuz are feeding inflation fears across Europe and weighing on the euro.
The euro closed March below $1.15, leaving the single currency close to its weakest level in nearly two weeks. The broader picture is more telling than the small day-to-day moves. Over the month, the euro lost more than 2% against the dollar as traders worked through the economic fallout from the deeper Middle East conflict.
That decline reflects a market that has become less confident in Europe’s near-term growth outlook. When energy costs rise sharply, the euro zone tends to feel the pain quickly because it remains heavily exposed to imported energy.
Inflation expectations of euro-area consumers jumped in March — a warning sign for the ECB as it assesses the danger of a renewed price spike due to the Iran war https://t.co/NsUAArhgoS
That mix can hurt growth, keep inflation high, and leave the euro caught between weak activity and tighter policy expectations.
If energy prices stay elevated and the conflict remains unresolved, EURUSD may struggle to build a strong rebound and could stay heavy around the mid-1.14 area.
Oil Shock Forces a Sharp Rethink on ECB Policy
The biggest shift this month has been in rate expectations. Soaring oil prices have pushed inflation fears higher across Europe, and that has forced markets to radically reprice the European Central Bank path.
Investors now anticipate at least two interest rate hikes in 2026. Earlier, the market had been pricing a 40% chance of a rate cut instead. That is a sharp swing in expectations, and it tells you just how much the energy shock has changed the tone.
European Central Bank Governing Council Madis Muller said policymakers will have to act if energy costs remain high for an extended period https://t.co/M1BtxR0KIe
In theory, more rate hikes should help the euro. In practice, the euro has still weakened because the market sees the hikes as defensive rather than growth-positive. Tighter policy in response to an oil shock does not necessarily improve the outlook for risk assets or the currency if the economy is also slowing.
French central bank chief François Villeroy de Galhau reinforced that cautious tone by saying the ECB remains committed to containing energy-driven inflation, but also warned it is “too early” to say when any move will come.
If ECB officials keep sounding worried about inflation but reluctant to commit on timing, EURUSD may remain range-bound rather than stage a clean recovery.
Middle East Tensions Keep Pressure on the Euro
Geopolitics remains at the centre of the move. A Wall Street Journal report said former US President Donald Trump had signalled a possible end to the US military campaign against Iran, even if the Strait of Hormuz remained largely blocked.
Shippers remain doubtful of a wholesale return to the Strait of Hormuz while the conflict in the Middle East continues https://t.co/QMf8zNLAzV
That is important because the market is no longer trading just the risk of war. It is trading the risk of an energy bottleneck that may outlast the most intense phase of direct military action. A blocked or partially blocked Strait keeps freight, insurance, and crude costs elevated. Europe feels that quickly.
This helps explain why the euro has not benefited much from any relief headlines. Traders are looking past diplomatic tone and focusing on physical energy flows.
Even if the conflict cools at the political level, EURUSD may stay under pressure if oil routes remain disrupted and inflation stays sticky.
Technical Analysis
EURUSD is trading near 1.1470, hovering just above recent lows as the pair struggles to recover from its broader decline following the rejection from the 1.2080 high. Price action shows continued downside pressure, with rallies failing to hold and sellers stepping in on strength, keeping the pair under sustained resistance.
From a technical standpoint, the trend remains bearish. Price is trading below all key moving averages, with the 5-day (1.1506) and 10-day (1.1535) positioned just above current levels, acting as immediate resistance. The 20-day (1.1550) and 30-day (1.1620) continue to slope downward, reinforcing the weakness in the broader structure and confirming that momentum remains tilted to the downside.
Key levels to watch:
Support: 1.1410 → 1.1350 → 1.1300
Resistance: 1.1500 → 1.1550 → 1.1620
The pair is currently consolidating below the 1.1500–1.1550 zone, which has capped recent upside attempts. A break above this region would be needed to ease immediate bearish pressure and open a move toward 1.1620, though momentum would still need to build to sustain a broader recovery.
On the downside, 1.1410 remains the key near-term support. A break below this level could trigger a move toward 1.1350, with further downside risk if selling accelerates.
Overall, EURUSD remains in a clear downtrend, with price action suggesting continued pressure on support levels. Unless the pair can reclaim the 1.1550 area, rallies are likely to be sold into, keeping the bias skewed to the downside in the near term.
What Traders Should Watch Next
The euro now sits at the intersection of three forces: energy prices, ECB repricing, and geopolitical headlines. For the next move, traders will need to see whether oil stays high, whether the ECB becomes more explicit about the new rate path, and whether the Strait of Hormuz remains effectively constrained.
If oil cools and freight risk eases, EURUSD could stabilise quickly. If Europe keeps importing an energy shock while policy turns more defensive, the euro may stay under pressure even with rate-hike expectations rising.
EURUSD ended March below $1.15 because the euro lost more than 2% against the dollar during the month as traders priced the economic damage from the Middle East conflict and the inflation shock caused by higher energy costs.
Why Can the Euro Fall Even if Markets Expect Ecb Rate Hikes?
The euro can still weaken when rate hikes are driven by an oil shock rather than stronger growth. Markets now expect at least two ECB rate hikes in 2026, but the euro zone is also more exposed to expensive imported energy, which hurts growth and offsets the usual support from higher rates.
What Has Changed in ECB Expectations?
Markets have swung from pricing a 40% chance of a rate cut earlier to pricing multiple ECB hikes in 2026. Reuters reported that markets are now forecasting three rate hikes in 2026, with the first expected by June, which shows how sharply the energy shock has changed rate expectations.
Why Does the Strait of Hormuz Matter So Much for EURUSD?
The Strait of Hormuz matters because it carries about 20% of the world’s oil and a large share of LNG. If it stays largely blocked, Europe faces higher import costs, higher inflation, and weaker growth, which can keep pressure on the euro.
Did Relief Headlines Around Trump Help the Euro?
Only briefly. Reuters reported that the Wall Street Journal said Trump was open to ending the military campaign even if Hormuz stayed shut, which gave markets some relief. But oil stayed elevated and traders kept focusing on energy flows rather than political tone alone.
What Did François Villeroy De Galhau Say About ECB Policy?
Villeroy said the ECB is ready to act against energy-driven inflation, but that it is too early to discuss the timing of any rate hike. That message supports a hawkish bias, but it does not yet give traders a firm timetable.
Start trading now – Click here to create your real VT Markets account
Price action reads the raw price movement directly on the chart. Indicators process the same price data through a formula and display the result as a line or histogram. The core difference is timing. Price moves first, indicators follow. If you want to read the market, it makes more sense to read the source.
Quick Comparison: Price Action Vs Indicators
For a more detailed breakdown, jump to this section.
Price action trading means making decisions based on what the price is doing on the chart, nothing else.
You’re looking at how candles form. You’re seeing where price stalls. You’re seeing where it reverses. This shows who controls the market at any moment.
The idea is that everything you need to know about a market is already visible in price. If buyers are stepping in aggressively, you’ll see it in the candles. If the price breaches key levels twice, that’s meaningful.
Not because a formula tells you so, but because you can see it happening in real time.
For CFD traders, this matters.
Markets can move fast. If you wait for an indicator to confirm what price showed a few candles ago, you may miss a good entry. You could even miss the trade!
What Price Action Traders Actually Look At
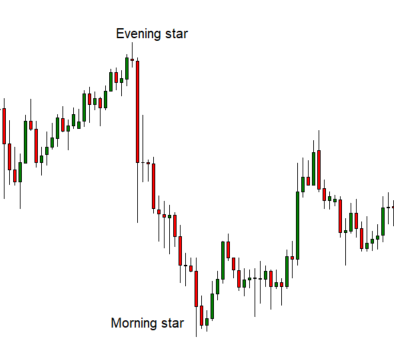
Candlestick Patterns
Engulfing candles, morning star, and evening star that signal potential reversals or continuation.
Support And Resistance Levels
Horizontal zones where price has previously reacted, stalled, or reversed.
Market Structure
The sequence of highs and lows that tells you whether a market is trending, ranging, or breaking down.
Break And Retest Setups
Where price breaks a key level and returns to it before continuing.
Momentum Shifts
Changes in candle size, wick length, or closing position that suggest conviction is changing.
What Are Technical Indicators?
Technical indicators are tools that calculate a value based on past price or volume data. The indicators then plot this value visually on your chart.
The most common indicators are RSI (Relative Strength Index), MACD (Moving Average Convergence Divergence), and Bollinger Bands.
Each of them is trying to answer a specific question: Is price overbought or oversold? Is momentum shifting? Is volatility expanding or contracting?
This is what you’ll get when you add all three indicators to one chart.
Used selectively, indicators can add structure to your analysis, particularly as a secondary filter before entering a trade. The issue isn’t that they’re wrong. The issue is that they’re a step removed from the actual market.
Why Indicators Lag Price
Here’s the insight that changes how most traders think about this: every single indicator is derived from price.
RSI is calculated from closing prices. MACD is built from moving averages of price. Bollinger Bands are plotted around a moving average of price.
None of them generates new information. They reprocess information that already exists in the raw chart.
That’s what makes them lag by nature. They can only tell you what price has already been done, formatted into a different visual.
Price action is the upstream source. It builds the indicators. When you read the price directly, you’re working with the original data, not a processed summary.
This doesn’t make indicators useless. But it does mean this: if you trust an indicator more than the price, you have it going on backwards.
The 6 Biggest Differences Explained
1. Speed Of Signal
Price action is immediate. The signal is the candle closing, the level holding, the structure breaking. You see it as it happens.
Indicators, by design, process historical price data before producing an output, which means the signal always arrives after the fact. In fast-moving CFD markets, that delay can be the difference between a clean entry and chasing a move that’s already extended.
2. Learning Curve
Indicators feel easier to start with, and that’s precisely what makes them appealing to newer traders. You attach RSI to a chart, you see a line cross a level, and there’s an immediate sense of structure.
Price action, by contrast, asks you to develop pattern recognition and contextual judgment. These are skills that need nurturing.
3. Chart Clarity
A clean price action chart contains just candlesticks and the levels you’ve drawn.
Is your chart too busy and blurry? Price action offers a clearer view of market activities.
A chart loaded with indicators quickly becomes visually cluttered. Imagine multiple lines, histograms, bands, and oscillators all competing for attention.
For some traders, that extra data feels reassuring. For most, it creates noise.
4. Subjectivity
Indicators feel objective because they produce a specific number. RSI reads 68.4, not “somewhere around overbought.”
Price action carries moderate subjectivity. Traders will draw levels slightly differently. But the underlying information is unfiltered. With indicators, you’re interpreting data that’s already been processed once.
5. Interpretation In Trending Markets
Both approaches work in trends. A moving average crossover or MACD holding above its signal line can be useful for staying in a move and avoiding early exits.
Price action gives you the same information faster. Higher highs and higher lows confirm the trend. A break of a prior swing low signals it may be ending. The indicator tells you the same thing, just a bit later.
6 Interpretation In Range-Bound Markets
This is where the gap widens. Price action in a range is straightforward. Buy support, sell resistance, wait for a breakout with conviction. The logic stays consistent.
Indicators break down in ranging conditions. RSI repeatedly tags overbought and oversold without follow-through. MACD crossovers fire false signals in both directions.
Which Should You Use First?
People often frame the price action vs technical indicators debate as an either/or choice. It doesn’t need to be.
But the order you learn them in matters more than most traders realise.
Start with price action. Learn to read structure, identify key levels, and understand what a chart is telling you before you add anything else on top of it. Once you have that foundation, indicators can play a supporting role rather than thinking for you.
The reason this order matters.
If you start with indicators, you end up relying on a layer of abstraction you don’t fully understand.
You see RSI cross 70 and call it overbought, but without understanding the price context around it, that number means nothing. Plenty of strong trending markets will hold RSI above 70 for extended periods and keep running.
Silver demonstrated an impressive bullish rally from November 2025 until late January 2026. The RSI showed sustained >70, which clashes with common RSI wisdom that price will likely reverse once it crosses overbought territory.
Price action gives you the context. Indicators, when used selectively, can help confirm timing or filter out lower-quality setups. That’s a sensible combination. Just don’t let the indicator become the primary signal.
For CFD traders in forex, indices, or commodities, this approach is practical.
It works on all timeframes and instruments. You do not need to reset your tools when market conditions change. Price is price.
Frequently Asked Questions
1. Which indicators work best with price action?
To trade effectively, it is not about which indicators work best, but about avoiding indicators that give the same information. The Golden Rule is to combine indicators from different categories.
If you use the Relative Strength Index (RSI) and Stochastics together, you are just looking at two different versions of bound oscillators.
Instead, combine bound oscillators, like RSI, with a Trend Following Momentum indicator like MACD. This creates confluence, where two different mathematical models agree on a trade setup.
2. Does price action trading apply to all asset classes?
Yes. Price action is universal because it is a visual representation of human psychology, like greed, fear, and indecision, which exists in every market.
3. Can you trade with price action only?
This is often referred to as “naked trading.”
Many professional traders prefer a clean chart because it allows them to focus purely on market structure, support/resistance levels, and candlestick patterns without the noise of lagging indicators.
You only have to be an expert at reading the story the market is telling.
4. Does high-impact economic news disrupt price action trading principles?
Yes and no. While news can cause temporary chaos on a chart, it rarely breaks the long-term price action structure.
Instead, news often acts as a catalyst for a move that the price action was already preparing for.
For example, this is often seen in the “Priced In” phenomenon, where bullish patterns like higher lows or continuation patterns form days before a positive release as “smart money” positions itself. The news then acts as the wind in the sails to break price out of the continuation pattern and continue the previous trend.
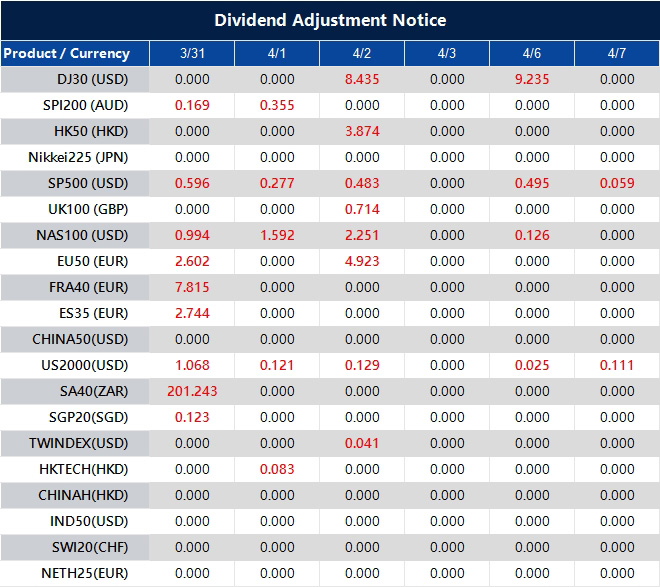
Please note that the dividends of the following products will be adjusted accordingly. Index dividends will be executed separately through a balance statement directly to your trading account, and the comment will be in the following format “Div & Product Name & Net Volume”.
Please refer to the table below for more details:
The above data is for reference only, please refer to the MT4/MT5 software for specific data.
If you’d like more information, please don’t hesitate to contact [email protected].
Germany’s retail sales fell by 0.6% month on month in February. This was below the forecast of a 0.2% rise.
The result shows weaker retail activity than expected for the month. No further figures were provided in the update.
German Consumer Demand Weakens
The unexpected drop in February’s retail sales signals that the German consumer is weaker than we anticipated. This challenges the recent optimism priced into the market. We must now adjust our view to account for slowing domestic demand in Europe’s largest economy.
This weak consumer data follows the recent March Ifo Business Climate index, which also fell to 89.5, confirming a broader cooling trend. Looking back, this marks a clear departure from the slow but steady recovery we witnessed in the second half of 2025. This pattern suggests the risk of a German economic contraction in the first quarter has now significantly increased.
For the DAX index, which is up nearly 8% year-to-date, this news makes it vulnerable to a correction. We should consider buying put options with May expirations to protect against a potential downturn. The sectors most at risk are consumer discretionary and automotive.
This data will likely weigh on the euro, reinforcing its recent weakness against the dollar. With the EUR/USD exchange rate already testing the 1.0750 level, this could be the catalyst for a move lower. We see an opportunity in shorting EUR/USD futures, as money markets are now pricing in a 75% chance of an ECB rate cut by June.
Positioning And Hedging Ideas
In fixed income, we anticipate a flight to safety, which will increase the value of German government bonds. We should look at buying call options on Bund futures, betting that yields will fall further on these recessionary fears. This strategy also provides a hedge against the bearish equity positions we are considering.
Create your live VT Markets account and start trading now.
Start trading now – Click here to create your real VT Markets account