François Villeroy de Galhau, a member of the European Central Bank Governing Council and Governor of the Bank of France, spoke about monetary policy on Monday. He said policymakers are ready to act if inflation driven by energy spreads more widely.
He said it is too early to discuss the timing of any interest rate rise, despite rising market expectations. He described an energy shock linked to the Iran war as inflationary in the near term, but said the ECB cannot prevent the initial price spike.
Policy Focus On Second Round Inflation
He said policy is aimed at second-round effects rather than the first-round rise in energy prices. At the time of reporting, EUR/USD was down 0.14% on the day at 1.1492.
Looking back, we can see how the comments from early 2025 framed the current market. The focus then was on whether the Iran war-driven energy shock would create broader, second-round inflation effects. It was clear even then that the European Central Bank could not stop the initial price surge but was poised to act on its aftermath.
Those second-round effects did materialize, which is why we are where we are today. The latest Eurostat flash estimate shows headline inflation has cooled from its 2025 peak but remains sticky at 2.9%, well above the target. This persistence forced the ECB to hike its deposit facility rate to the current 4.25%, where it has remained for the last five months.
Now, traders face a conflict between stubbornly high core inflation and deteriorating economic growth, with the last quarter’s GDP figures showing a meager 0.8% annualised expansion. This puts the ECB in a difficult position, creating uncertainty about its next move. Therefore, we believe positioning for increased volatility is a primary strategy for the coming weeks.
Strategies For Volatility And Rates
Traders should consider using options to play this divergence, such as buying straddles on the Euro Stoxx 50 Volatility Index (VSTOXX). This strategy profits from a large market move in either direction, whether the ECB signals a hawkish surprise to crush inflation or a dovish pivot to support the economy. The cost of these options remains historically reasonable, providing an attractive risk-reward profile.
In interest rate markets, futures are pricing in nearly 75 basis points of cuts by year-end, which seems aggressive given recent wage growth data. We see an opportunity in positioning for a slower cutting cycle than the market expects. This could involve using Euribor futures to bet against the most dovish contracts for the fourth quarter of 2026.
The EUR/USD exchange rate, now trading near 1.0750, never regained its footing after failing to rally on those hawkish comments last year. While the path of least resistance appears lower due to growth differentials with the US, the market is heavily short the Euro. We advise using cheap, out-of-the-money call options as a hedge against any unexpected hawkish rhetoric from the ECB that could trigger a sharp short squeeze.
Create your live VT Markets account and start trading now.
Start trading now – Click here to create your real VT Markets account
EUR/USD fell for a fifth straight trading day on Monday, down 0.15% to about 1.1490 in early Asian trade. The move came as risk mood weakened after remarks on Iranian state TV from Brigadier General Ebrahim Zolfaqari about possible US ground action.
S&P 500 futures were 0.5% lower at the time, pointing to lower demand for risk assets. The US Dollar Index was 0.15% higher at about 100.35.
Geopolitical Risk And Market Reaction
A Wall Street Journal report late Thursday said the US Pentagon is planning to send an extra 10,000 troops to Iran. This came despite President Donald Trump referring to negotiation talks with Tehran.
Markets are also waiting for Germany’s preliminary Harmonised Index of Consumer Prices data for March at 12:00 GMT. The release is being watched for what it may mean for European Central Bank policy and Eurozone rate expectations, including effects linked to energy prices and Middle East conflict.
We remember how geopolitical flare-ups, like the one involving Iran in March 2025, can quickly sour market sentiment and send the EUR/USD tumbling. That event was a clear signal that headline risk can easily override economic data in the short term. The dollar strengthens when fear takes over, a pattern we have seen repeatedly.
This creates an environment where owning volatility could be beneficial for traders. Looking back at the S&P 500 futures drop and the DXY surge in 2025, we are reminded that calm markets can become turbulent overnight. Currently, with implied volatility on major currency pairs trading at relatively subdued levels, protective options contracts are comparatively inexpensive.
Energy Prices And Central Bank Implications
The connection between Middle East tensions and energy prices remains critical, just as it was a year ago. A spike in tensions in the Persian Gulf almost always leads to a jump in oil prices, which we saw when Brent crude briefly topped $90 per barrel in late 2023 following regional conflicts. This directly impacts the Eurozone, which is a major energy importer and sensitive to inflationary shocks from higher fuel costs.
As a result, we should pay close attention to the European Central Bank’s reaction function. The latest Eurostat data for February 2026 showed core inflation still hovering at 2.9%, above the central bank’s target. Any new energy-driven price shock could complicate the ECB’s policy path, creating uncertainty for the euro.
The US dollar’s status as a primary safe-haven asset was reinforced during the 2025 scare when the DXY pushed towards 100.35. That dynamic has not changed, and traders should anticipate dollar strength during any new geopolitical escalations. This suggests that positioning through long dollar call options or short EUR/USD futures could be a prudent hedge against sudden global instability.
Create your live VT Markets account and start trading now.
Start trading now – Click here to create your real VT Markets account
The Japanese Yen weakened against the US Dollar at the start of trading in Asia on Monday. USD/JPY rose to about 160.50, the highest level since July 2024.
The Middle East conflict entered its fifth week with no negotiated truce reported. The war widened in the Gulf after the Iran-backed Houthi group in Yemen launched strikes at Israel over the weekend.
Red Sea Risk And Market Impact
Israel said early Monday that it intercepted two drones fired from Yemen. Markets are concerned that threats to Red Sea shipping could harm the global economy.
Demand for the US Dollar increased as risk aversion stayed high, which supported the currency’s safe-haven role and reserve status. That demand put pressure on the Yen and pushed the pair higher.
Further gains in USD/JPY may be limited by the risk of Japanese foreign exchange intervention. The Yen may also find support if the Bank of Japan raises interest rates at its upcoming meeting.
Attention is on the Bank of Japan’s Summary of Opinions from its March meeting.
Looking Back At Dollar Surge
We recall the situation in late 2025 when geopolitical risks in the Middle East drove a flight to the US dollar. This risk-aversion pushed the USD/JPY pair to levels we hadn’t seen since mid-2024, touching a high near 160.50. It was a period of extreme strength for the dollar, fueled by its safe-haven appeal.
As we expected back then, that peak was short-lived because of the looming threat of intervention by Japanese authorities. They did indeed step in during November 2025 with significant yen-buying, reminiscent of the over ¥9 trillion ($60 billion) used in similar operations back in 2022. This action established a hard ceiling for the pair and triggered a sharp reversal.
The Bank of Japan also followed through on market expectations, delivering a modest interest rate hike in January 2026 to 0.25%. This move continued the policy normalization that began when they ended negative interest rates in March 2024. This action helped narrow the wide interest rate differential with the United States, adding further downward pressure on the currency pair.
Today, with USD/JPY trading much lower around 148.50, the memory of that volatility is critical. The massive gap between U.S. rates, currently at 5.50%, and Japan’s 0.25% remains the primary driver, but the market is now highly sensitive to official warnings from Tokyo. This creates an environment where sharp, sudden moves are more likely than a steady trend.
For derivative traders, this suggests that implied volatility in USD/JPY options will remain elevated. Strategies like buying long straddles could be effective, as they profit from a large price move in either direction without needing to predict the specific trigger. Such a strategy positions a trader to capitalize on the next major shift, whether it’s from intervention fears or a surprise in U.S. inflation data.
Another approach involves looking at volatility itself as an asset. Given the established resistance near the 160 level, selling call options with strike prices significantly above current levels could be a way to collect premium. This strategy bets that Japanese authorities will effectively cap any extreme upside moves in the coming weeks.
Create your live VT Markets account and start trading now.
Start trading now – Click here to create your real VT Markets account
This route has become a critical lifeline for global oil flows, helping to offset some of the disruption.
However, the shift introduces new risks.
Analysts warn that this infrastructure could become a target, particularly as the conflict broadens.
Any disruption to this pipeline could trigger another sharp leg higher in oil prices.
Geopolitical Risks Deepen Market Uncertainty
Geopolitical tensions continue to escalate on multiple fronts.
Reports indicate that the U.S. is considering a military operation to extract nearly 1,000 pounds of uranium from Iran, raising the risk of further escalation.
The result is a tightening of financial conditions, which can weigh on broader economic growth.
Persistent high oil prices may keep inflation elevated and constrain policy flexibility.
Technical Analysis
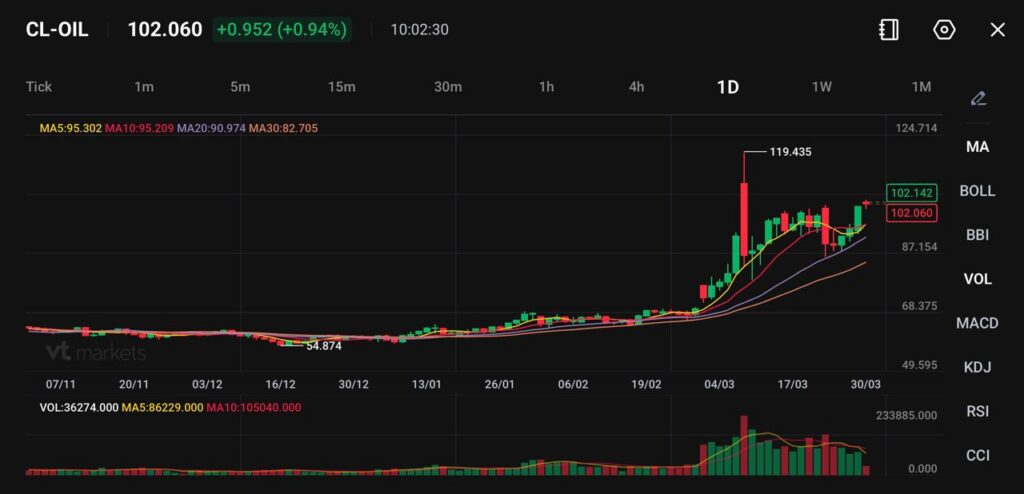
Crude oil is trading near 102.00, holding firm after its recent surge toward the 119.40 high, with price now stabilising just above the psychological 100 level. The market is showing signs of consolidation following the sharp rally, but the underlying structure continues to reflect sustained bullish pressure, with buyers still active on dips.
From a technical standpoint, the trend remains firmly bullish. Price is trading well above all key moving averages, with the 5-day (95.30) and 10-day (95.20) positioned comfortably below current levels, providing immediate support. The 20-day (90.97) and 30-day (82.70) continue to slope upward, reinforcing the strength of the broader uptrend.
Key levels to watch:
Support: 100.00 → 95.00 → 90.00
Resistance: 102.00 → 105.00 → 110.00
Price is currently consolidating just above the 100–102 zone, which is acting as a short-term pivot. A sustained break above 105.00 could trigger renewed upside momentum toward 110.00, with further extension possible if buying pressure builds.
On the downside, 100.00 is acting as immediate support. A break below this level could lead to a deeper pullback toward 95.00, though such a move would likely remain corrective unless broader sentiment shifts.
Overall, crude oil remains in a strong uptrend, with current price action suggesting a pause rather than a reversal. However, with price holding near elevated levels after a rapid advance, traders should remain alert to potential volatility as the market works through this consolidation phase.
The Australian Dollar (AUD) fell at the start of the week, down 0.27% to about 0.6850 against the US Dollar (USD). The move came as markets reacted to warnings from Iran about possible US ground military action.
The Wall Street Journal reported last week that the US Pentagon is planning to send up to 10,000 additional ground troops to Iran. This came as President Donald Trump announced a 10-day postponement of planned military action on Iran’s power plants.
Iran Warning Raises Market Tension
Iran’s Brigadier General Ebrahim Zolfaqari issued a warning on Iranian state TV about attempts at a ground invasion. He said “US troops will be good food for sharks of the Persian Gulf”.
S&P 500 futures were down 0.55% early in the week, pointing to cautious risk appetite. The US Dollar Index (DXY) was up 0.15% to near 100.35.
Attention this week is also on key US employment data. These releases may affect expectations for the Federal Reserve’s next policy steps.
We are seeing a familiar pattern of risk aversion in the markets, reminiscent of the US-Iran tensions back in 2025. The current uncertainty surrounding naval traffic in the Strait of Hormuz is pushing investors toward safe-haven assets. The US Dollar Index has reflected this flight to safety, climbing to a high of 105.20 this past week.
Options Market Signals Higher Risk
Volatility is the main story for derivative traders right now, with the VIX index having spiked by 30% this month to trade above 22. This suggests that buying put options on broad market indices like the S&P 500 or the ASX 200 could be a prudent way to hedge against further downside. These elevated volatility levels also make selling covered calls on existing stock positions more profitable.
The geopolitical tensions have directly impacted energy markets, with Brent crude oil surging 12% in the last two weeks to nearly $98 a barrel. We believe there is room for further upside if shipping routes are threatened. Call options on oil futures or energy sector ETFs provide direct exposure to this ongoing situation.
As a key risk-proxy currency, the Australian Dollar has weakened considerably, falling below 0.6400 against the US Dollar. We expect this pressure to continue as long as market sentiment remains cautious. Traders could consider put options on the AUD/USD pair or look at shorting it against stronger safe-haven currencies like the Japanese Yen.
While geopolitics is driving the market, we must also watch the upcoming US inflation data. A higher-than-expected inflation print could force the Federal Reserve’s hand, adding another layer of volatility on top of the current global uncertainty. This economic data will be a critical factor in determining market direction in the weeks ahead.
Create your live VT Markets account and start trading now.
Start trading now – Click here to create your real VT Markets account
This dynamic poses a challenge for gold, as higher rates increase the opportunity cost of holding non-yielding assets.
Persistent inflation may keep gold under pressure despite its safe-haven appeal.
Gold Faces Pressure Despite Safe-Haven Demand
Gold typically benefits during periods of geopolitical uncertainty, yet current price action tells a more complex story.
Despite ongoing conflict, gold has fallen more than 15% this month, marking its steepest decline since October 2008.
This drop has been driven largely by a stronger dollar, which has gained over 2% since February 28, when the U.S.-Israeli war on Iran began.
The interplay between safe-haven demand and rising yields continues to create conflicting signals for gold prices.
Technical Analysis
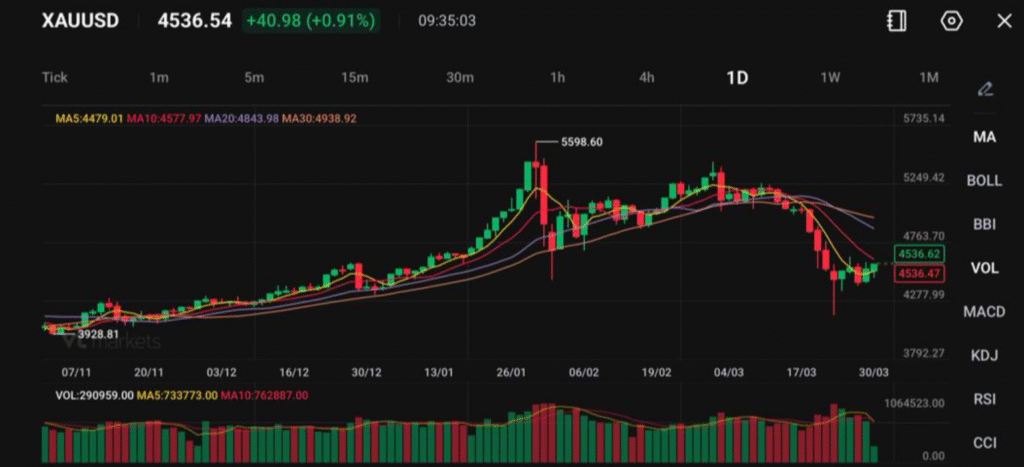
Gold is trading around 4536, attempting a bounce after a sharp corrective move that followed the rejection from the 5598 high. The structure has clearly shifted from a strong uptrend into a medium-term pullback, with price now testing whether a base can form.
Trend Structure and Momentum
The moving averages show a clear deterioration in trend:
MA5: 4479
MA10: 4577
MA20: 4843
MA30: 4938
Price is currently:
Slightly above MA5, but
Still below MA10, MA20, and MA30
This tells you the bounce is early-stage and fragile, not yet a confirmed reversal.
The earlier sell-off was aggressive, with long bearish candles and strong follow-through. The current rebound is much smaller, suggesting short-covering rather than strong fresh buying.
The 4575 (MA10) area is the first key test. If price fails there, sellers remain firmly in control.
Price Behaviour Insight
The move from ~3900 to 5598 was a strong macro-driven rally. What we are seeing now is:
A distribution phase near the highs
Followed by a sharp unwind
Now transitioning into a potential consolidation or corrective range
The recent bounce off the lows shows some demand, but:
No strong impulsive candles yet
Resistance is still pressing down
Structure still shows lower highs
What to Watch Next
Focus on how price behaves around 4575–4650:
Rejection: Likely continuation lower toward 4400
Break and hold above 4650: Opens a move toward 4760
Also watch macro drivers closely:
US dollar direction (USDX)
Treasury yields
Ongoing geopolitical risk, especially energy-driven inflation narratives
Gold tends to react quickly to shifts in rate expectations, so any change in that narrative will drive the next move.
Cautious Outlook
The bias remains corrective to bearish below 4650, with rallies still vulnerable to selling pressure. A sustained move above 4760–4850 is needed to stabilise the structure. Until then, price risks another leg lower or extended consolidation around current levels.
What Traders Should Watch Next
Gold remains highly sensitive to macro and geopolitical developments. Key drivers include:
Direction of the U.S. dollar
Oil price movements and inflation expectations
Federal Reserve policy signals
Developments in Middle East tensions
For now, gold is caught between competing forces, with inflation risks and rate expectations shaping its near-term path.
A unilateral ceasefire announcement on Thursday drove a sharp rise in the S&P 500, but the move soon faded and the announcement level was broken before the European session. Markets then moved lower for most of the period described, with each later verbal intervention producing a smaller and less durable spike.
Technology shares held up better than the S&P 500 for roughly the first two hours of the regular session, then fell more in line with the wider market. Trading rotated intraday between the S&P 500, Nasdaq and gold.
De Escalation Fails To Materialize
The text states there was no de-escalation, with Iran retaliating and Yemen joining over the weekend. It also cites assurances of no ground invasion alongside a build-up involving the 82nd Airborne and more troops.
Equities are described as being in a downtrend, with rallies failing to develop. Selling is portrayed as steady and one-way, without capitulation or unusually high volume, with frequent red hourly candles and weak stabilisation attempts.
Gold and silver are described as showing stabilisation, while oil is said to continue rising. Support levels are presented as the main target, with uncertainty focused on timing rather than direction.
We recall how verbal interventions, like the unilateral ceasefire announcement in 2025, are buying less time and smaller market spikes. That rally was erased almost immediately, establishing a pattern where markets are increasingly skeptical of headlines not backed by action. This trend continues as the S&P 500 just failed to hold its 50-day moving average this past week despite positive inflation whispers.
The current environment shows no meaningful de-escalation, reminding us of the troop build-ups we analyzed last year. The Volatility Index (VIX) has reflected this growing anxiety, climbing from a low of 14 earlier this month to over 22, signaling that traders are actively buying protection. This isn’t panic, but it is a clear recognition of rising risk in the system.
Positioning For Downside Risk
Given this, holding protective put options on broad market indices like the SPY seems prudent. The CBOE equity put/call ratio has been trending higher, recently pushing above 0.85, which shows a significant increase in bearish bets among traders. This suggests we are right to position for further downside or, at a minimum, to hedge long exposure.
The persistent strength in oil, with WTI crude pushing past $95 a barrel on renewed shipping lane tensions, is calling the market’s bluff on a peaceful resolution. This mirrors the dynamic from 2025, where energy strength coincided with equity weakness. Traders could consider call options on energy sector ETFs to play this divergence, while remaining cautious on tech, which is starting to lag again after a brief period of resilience.
The market decline remains orderly, marked by weak rallies that consistently fail, making it difficult to short into strength with a good risk-reward profile. Therefore, buying puts with at least 45 to 60 days until expiration allows a position to weather these brief, unconvincing bounces. This strategy avoids the frustration of trying to time intraday moves in a market that is grinding down rather than capitulating.
Create your live VT Markets account and start trading now.
Start trading now – Click here to create your real VT Markets account
USOil near $100 to $150 keeps inflation risk live and limits room for the Fed.
USDX stays firm as Strait of Hormuz tension blocks cleaner risk recovery.
SP500 remains vulnerable while high oil prices squeeze growth expectations.
BTCUSD still behaves like risk, even as the CLARITY Act starts to reshape crypto.
JOLTS and Non-Farm Payrolls will test whether growth is slowing further.
XAUUSD faces a push and pull between safe haven demand and dollar strength.
The market is not waiting for data first. It is waiting for oil to blink.
The conflict remains the main source of market anxiety. A 15-point peace proposal has been floated through intermediaries in Pakistan, but Tehran says no talks have happened and rejects the plan.
Pakistan says it's preparing to host "meaningful talks" to end the US-Israel war with Iran even as Tehran accuses Washington of secretly planning a land assault while sending messages about possible negotiations https://t.co/lxTTcMOAPHpic.twitter.com/93EKWez9Cc
Iran is demanding full sovereignty over the Strait of Hormuz and a halt to all US-Israeli operations before any dialogue begins. That stand-off is keeping USDX elevated, leaving the S&P 500 under pressure and preventing traders from committing to a clearer risk-on view.
The core macro tension is now easy to spot. Each time peace hopes fade, oil jumps. Once oil holds near $100 to $150, the market stops treating this as just a war story and starts pricing it as a global cost-of-living and stagflation problem.
The Stagflation Trade
The market is no longer treating this as a headline-driven war scare that will fade in a few sessions. It is starting to price the slower damage that comes when conflict keeps energy markets tight for too long.
That is the shift underneath the tape. Each time peace hopes wobble, oil pushes up again. Once crude sits in a $100 to $150 range, the issue gets bigger than geopolitics. It starts to feed into freight, production, food, and household costs. That is when traders stop asking whether there is a war premium in oil and start asking whether the global economy is being pushed into a stagflation problem.
Iran war latest:
– Trump says Iran gave US most of 15 demands to end war – Oil advanced as Houthi militants in Yemen entered conflict – Aluminum stocks soar after two key producers hit – Pakistan is ready to facilitate peace talks – S&P 500 futures, shares in Tokyo and Seoul…
That is also why the mood feels heavy even on quieter days. The market is not waiting for one dramatic escalation. It is watching a more grinding risk build in the background, where growth slows but inflation does not cool in the way central banks would want.
Read more about the movement of oil prices and how it affects the global economy here.
The Fed and Why Risk Cannot Relax
This is where the old market playbook starts to break down. In a normal slowdown, traders would look to central banks for support. In this environment, that support looks less certain because high energy prices can keep inflation alive even as activity softens.
Federal Reserve Bank of Richmond President Tom Barkin said the US-Israel war in Iran threatens to add to already elevated inflationary pressures and clouds the economic outlook at a time when the labor market is fragile https://t.co/z7fIfBrDRW
That leaves policymakers in an awkward position. They may want to lean more supportive if growth weakens, but they cannot do that freely if oil is still feeding price pressure through the system. The result is a market that feels stuck between two problems at once. Growth looks more fragile, but inflation risk has not gone away.
That is why risk sentiment still struggles to settle. Traders are not just nervous about weaker data. They are nervous about weaker data arriving in a world where policy relief may come later and do less when it does arrive.
The CLARITY Act and a Market Still Trading Risk
At the same time, while the old world of stocks, bonds, and commodities is being pulled around by war and inflation fears, the crypto market is being forced into a more formal structure.
On March 20, 2026, Senators Tillis and Alsobrooks reached a compromise on the CLARITY Act around stablecoin yields. The key change is simple. Direct yield earned just by holding a stablecoin, in the style of a bank deposit, would be prohibited for non-bank entities. Yield tied to actual use, such as payments, transfers, or platform loyalty, would still be permitted.
In the short term, that can take some heat out of the market because passive yield had become part of the growth story for parts of crypto. In the longer term, though, it may end up making the space easier for larger institutions to engage with. The compromise draws a clearer line between what looks like a deposit substitute and what looks like usable financial infrastructure.
That is why the reaction is mixed rather than cleanly negative or positive. Some parts of the market may lose momentum first. But the broader framework becomes easier to defend if the rules are firmer and the biggest objections from the traditional banking side start to fade.
Key Symbols to Watch
USDX | USOil | BTCUSD | SP500 | USDJPY
Upcoming Events Table
Date
Currency
Event
Forecast
Previous
Analyst Remarks
30 Mar 2026
USD
Fed Chair Speaks
–
–
Tone matters more than guidance while oil drives pricing
31 Mar 2026
USD
JOLTS Jobs Openings
6.90M
6.95M
Softer labour demand could dent USDX after a strong run
03 Apr 2026
USD
Non Farm Employment Change
56K
-92K
A weak rebound would deepen the growth scare
03 Apr 2026
USD
Unemployment Rate
4.40%
4.40%
Any rise would add pressure to equities and risk FX
For a full view of upcoming economic events, check out VT Markets’ Economic Calendar.
Key Movements Of The Week
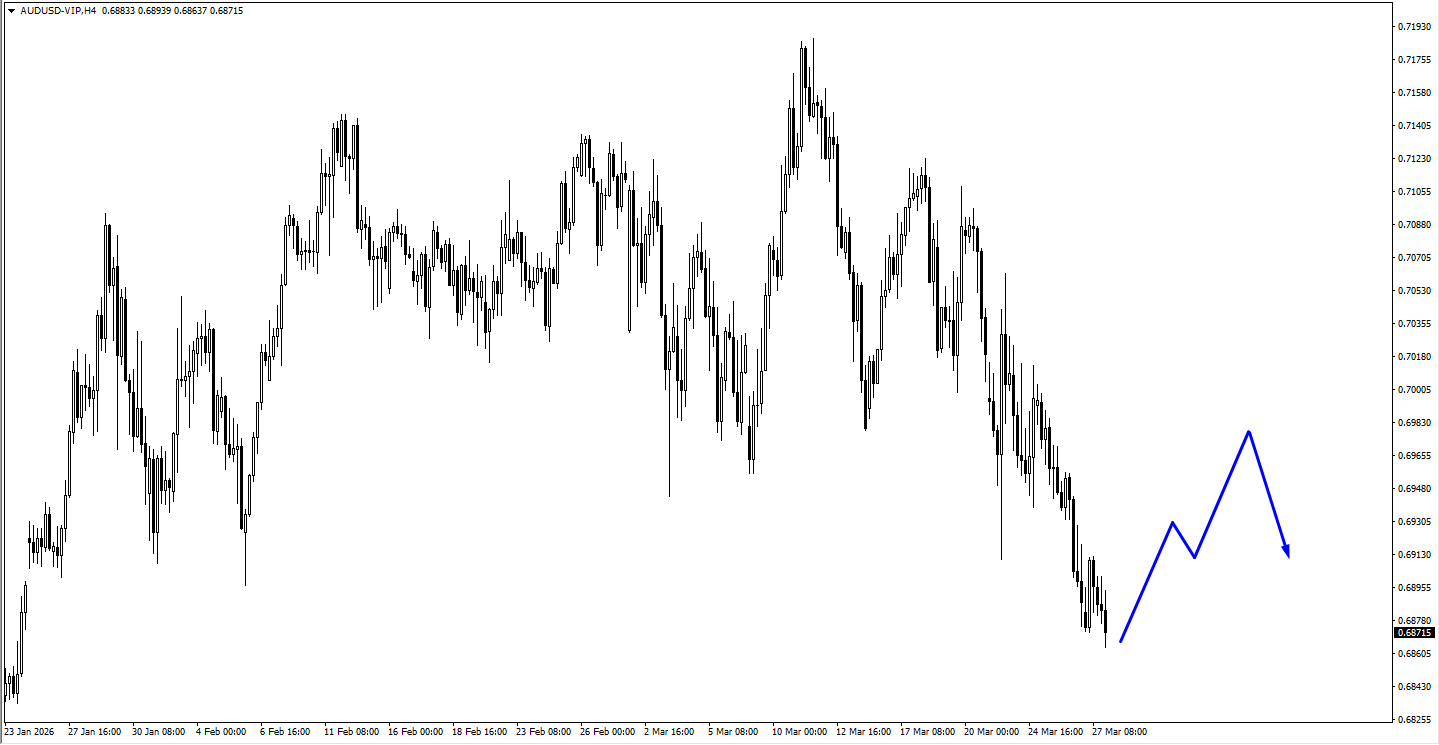
AUDUSD
AUDUSD has already broken 0.68965, which keeps the near-term structure tilted lower.
AUDUSD now needs to consolidate before another move down can develop cleanly.
AUDUSD remains exposed while USDX stays firm and the market leans defensive.
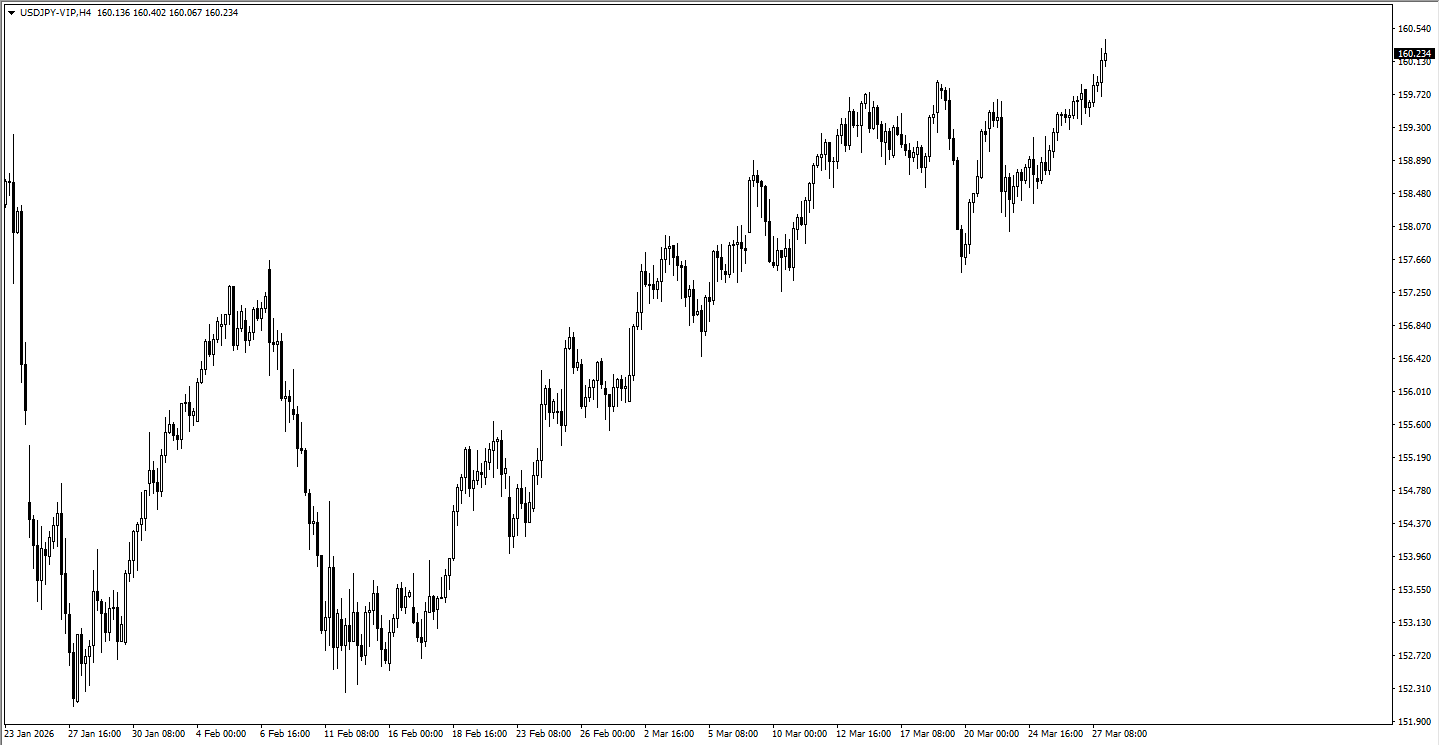
USDJPY
USDJPY broke above 159.89 and then cleared the 160.00 handle.
USDJPY is now trading in a follow-through zone, with 161.943 as the most recent high.
USDJPY can stay supported while the dollar holds up, though the pair is entering a more sensitive area.
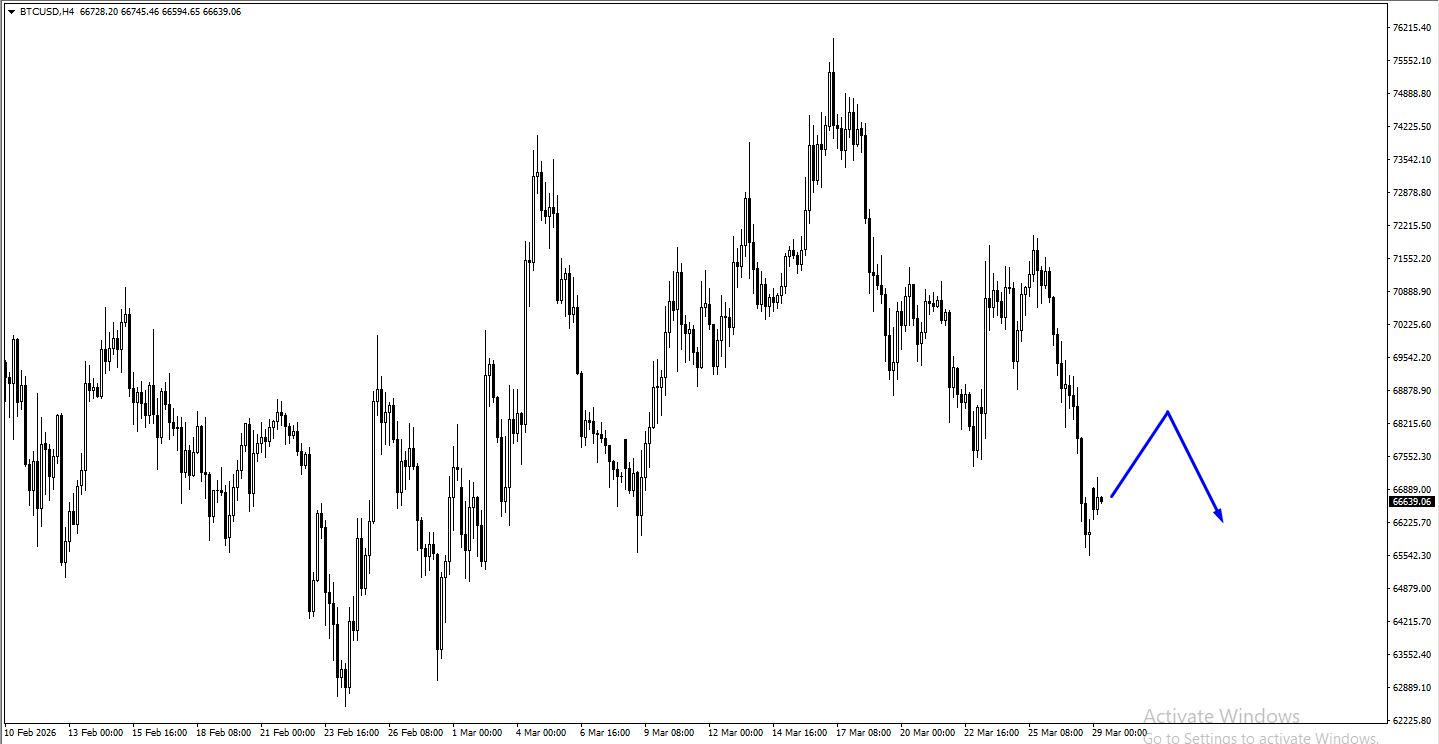
BTCUSD
BTCUSD is sitting at a crucial area with 2 possibilities now in play.
BTCUSD could move higher first, but the rally needs to be impulsive and buying should be dialled down above 74,000.
BTCUSD risks another leg lower if it turns into consolidation, with 60,502 the deeper downside level.
BTCUSD still carries an overall downward bias unless price breaks higher with force.
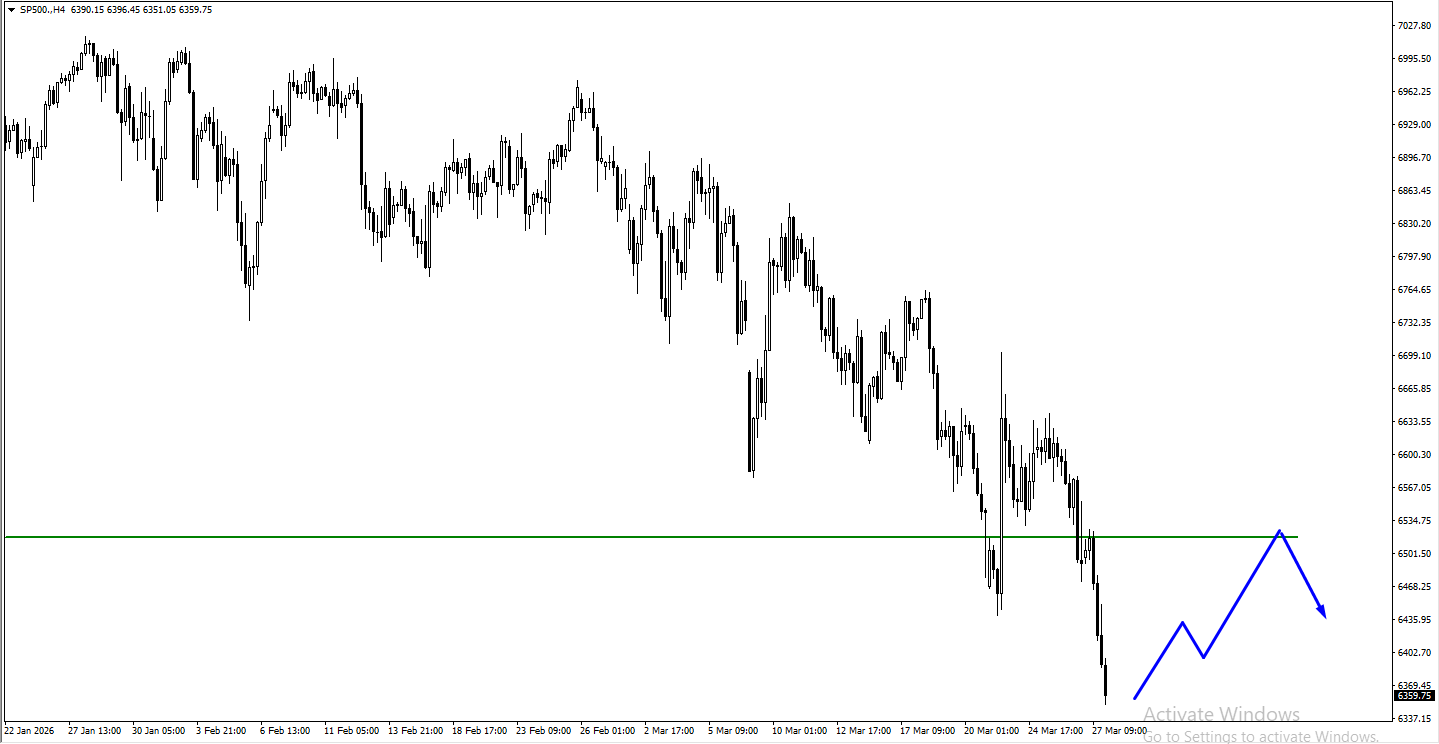
SP500
SP500 has already turned lower as sellers regained control.
SP500 still looks vulnerable if the next move is another consolidation phase.
SP500 remains tied to oil, growth fears and whether the Fed stays trapped by inflation.
Will April Bring A Turning Point?
The next date hanging over the market is April 6. That marks the end of the current 10-day tactical pause on strikes against Iranian energy plants. The working assumption in the market is that April could bring a more decisive turning point, even if that still falls short of full peace.
There is also a harder military and economic logic behind that view. One-third of Iran’s missile stockpile is said to be destroyed, another third buried or damaged.
The presence of the 31st MEU, with 3,500 Marines aboard the USS Tripoli, adds to the sense that pressure could ramp up quickly if talks fail. At the same time, there is a very clear economic incentive in the background, which is the push to get Brent crude back below $80 a barrel.
That leaves the market in a familiar place for now. Traders can see the outline of a possible endgame, but they still do not know whether it brings de-escalation, a harder strike phase, or a slower proxy conflict that drags through the rest of 2026.
Thailand’s financial markets have faced pressure linked to exposure to commodity price shocks tied to conflict in the Middle East. The report focuses on the Thai baht (THB) and equities, and links recent moves to inflation risks stemming from the Iran war.
Month-to-date, the Thai baht is down 5.3%, making it the worst-performing currency in the ASEAN-6 group. Over the same period, the benchmark Thai equity index is down 5.8%.
Inflation Risks And Policy Constraints
The report says higher inflation risks from the Iran war may limit further easing by the Bank of Thailand (BoT). Markets are pricing an unchanged policy rate for at least the next six months.
The BoT cut its policy rate to 1.00% in February, and the report expects it to monitor how long the supply shock lasts. It also points to attention on whether price pressures spread beyond energy and fertiliser, affecting inflation expectations and follow-on price effects.
If commodity prices stay elevated due to a prolonged Iran war, the report says market expectations could shift towards a potential BoT rate rise. The article notes it was produced using an AI tool and reviewed by an editor.
We are seeing the stagflationary pressures discussed in 2025 continue to impact Thai markets. The Thai Baht remains weak against the dollar, currently trading near 38.5, as persistent geopolitical risk in the Middle East keeps commodity prices high. This situation suggests traders should consider strategies that benefit from or hedge against further Baht depreciation.
This pressure has closed the door on monetary easing that many had hoped for back in 2025. With Brent crude consistently above $95 a barrel, Thailand’s headline inflation for February 2026 hit 3.1%, staying above the central bank’s target. Therefore, options strategies should be positioned for policy inertia or a potential hawkish surprise from the Bank of Thailand.
Trading Implications For Baht Rates And Equities
Fixed income markets are now pricing in a 45% chance of a rate hike by the third quarter, a significant shift from the neutral stance seen last year. This uncertainty creates an environment where long volatility trades on the Thai Baht, using instruments like options straddles, could be advantageous. These positions would profit from a large move in the currency, regardless of the direction.
The equity market is also reflecting this strain, with the SET index struggling to gain traction amid persistent foreign outflows. We’ve seen foreign investors pull over $800 million from Thai stocks this quarter alone. Traders could use index futures to hedge existing long positions or establish short positions to capitalize on further market weakness.
Create your live VT Markets account and start trading now.
Start trading now – Click here to create your real VT Markets account
Bangko Sentral ng Pilipinas (BSP) kept the reverse repurchase (RRP) rate at 4.25% in an off-cycle meeting, amid supply-driven inflation and rising risks linked to the Middle East.
UOB’s Global Economics & Markets Research expects no further RRP rate changes for now, citing uncertainty over the duration and severity of the conflict. Decisions are expected to focus on core inflation and possible second-round effects.
Policy Pause And Inflation Risks
Weak domestic demand and higher living costs add to the case for a longer policy pause. Fiscal measures are expected to take a larger role in cushioning the economy.
BSP is expected to keep a meeting-by-meeting approach while tracking external developments. The BSP Governor said further off-cycle meetings are possible if risks increase.
He also said the BSP is ready to inject liquidity if needed. The BSP could also cut the reserve requirement ratio (RRR), potentially to about 2.00%.
The central bank is holding its key interest rate at 4.25%, creating a tense waiting game for the market. With the latest inflation data from February 2026 coming in at 4.1%, the bank is trapped between fighting persistent price pressures and supporting an economy that showed weaker growth. We saw this same struggle throughout 2025, where slowing GDP figures highlighted the cost of previous rate hikes.
Market Trading Implications
For traders of interest rate swaps, this prolonged pause suggests the front end of the yield curve will stay anchored, making strategies that profit from a stable range seem attractive. However, the readiness to hold off-cycle meetings creates a major risk of a sudden policy change if Middle East tensions escalate. This means any positions betting on low volatility should be paired with a hedge against an unexpected shock.
This cautious stance will likely weigh on the Philippine Peso, which has already drifted weaker to around 59.50 against the US dollar since the start of the year. The mention of potential liquidity injections or reserve requirement cuts is a distinctly dovish signal that adds further downward pressure on the currency. We should therefore consider strategies that can profit from, or at least hedge against, continued Peso depreciation.
Given the conflicting messages of a steady policy versus a fluid external situation, trading USD/PHP options on volatility is a key area of focus. While the official stance implies selling options could be profitable, the underlying geopolitical risks make buying protection, like puts on the Peso, a sensible defensive play. We remember how quickly markets repriced risk during similar events in late 2025, causing sharp, unexpected swings in the currency.
Create your live VT Markets account and start trading now.
Start trading now – Click here to create your real VT Markets account