EUR/USD traded higher near 1.1620 in early Asian hours on Wednesday. The Euro rebounded from a four-month low of 1.1507 as demand for the US Dollar as a safe haven eased.
US President Donald Trump said the conflict was “very complete, pretty much” and the military operation was “very far” ahead of its initial four- to five-week timeframe, according to Bloomberg. This reduced worries about a longer war in the Middle East and supported market mood.
Market Sentiment And Geopolitical Risk
Uncertainty persisted because no clear timeline was given for stopping attacks that have unsettled the Middle East and global markets. Israel’s military reported a new wave of strikes on Iran and more missiles launched at Lebanon, with targets linked to Hezbollah infrastructure in southern Beirut.
Renewed signs of tension could lift demand for the US Dollar and limit EUR/USD gains. Later on Wednesday, markets await Germany’s final Harmonised Index of Consumer Prices (HICP) reading and the US Consumer Price Index (CPI) data.
ECB President Christine Lagarde said uncertainty and volatility were unexpectedly high, making conditions hard to manage. She said the central bank would take the necessary measures to control inflation.
The Euro is used by 20 EU countries and in 2022 accounted for 31% of global foreign exchange transactions, with average daily turnover above $2.2 trillion. EUR/USD makes up about 30% of all FX trades, followed by EUR/JPY (4%), EUR/GBP (3%) and EUR/AUD (2%).
Macro Divergence And Trading Implications
Last year, we saw the EUR/USD pair trade above 1.1600 as the market reacted to easing geopolitical tensions. Today, the situation has shifted, with the pair now struggling to hold the 1.0850 level. The primary driver is no longer day-to-day conflict headlines but the widening gap in economic performance.
The US economy has shown resilience, with fourth-quarter 2025 GDP coming in at a solid 2.1% and the latest February jobs report showing moderate but steady growth. While US inflation has cooled to 2.9%, it gives the Federal Reserve little reason to consider cutting rates soon. This underlying economic strength continues to provide a supportive bid for the US Dollar.
In contrast, the Eurozone is facing a more difficult picture, which explains the Euro’s weakness. The latest Harmonized Index of Consumer Prices (HICP) remains sticky at 2.5%, putting pressure on the European Central Bank to maintain a restrictive policy stance. However, this is happening while the bloc’s economic engine, Germany, shows persistent industrial weakness and manufacturing PMIs remain in contractionary territory below 50.
This divergence between a hawkish ECB and a weak economy creates significant uncertainty for the Euro. We believe this environment is ideal for selling options to collect premium, as the pair may become range-bound between competing forces. For instance, selling strangles on EUR/USD could capitalize on the expected sideways price action.
Given the conflicting signals, traders should prepare for volatility around key data releases. The upcoming US CPI and Eurozone inflation figures will be critical in determining the next directional move. Buying short-term options, like straddles, ahead of these announcements could be a prudent way to trade a potential price breakout in either direction.
While the specific Middle East conflict from 2025 has de-escalated, the region remains a source of background risk. We see this less as a primary driver and more as a tail risk that could trigger a sudden flight to safety. Therefore, holding some cheap, out-of-the-money call options on the US Dollar Index (DXY) could serve as an effective portfolio hedge.
Create your live VT Markets account and start trading now.
Start trading now – Click here to create your real VT Markets account
WTI fell to about $81.70 a barrel in Asian trading on Wednesday, giving back earlier gains. Prices moved lower after a report that the International Energy Agency is considering its biggest-ever oil reserve release.
The proposed release would be larger than the 182 million barrels made available in 2022 after Russia’s invasion of Ukraine. The plan is aimed at easing market pressure.
Regional Conflict And Supply Risk
The Israel Defense Forces said it launched a new wave of strikes on Iran, with explosions reported in Tehran. Israel also fired more missiles towards Lebanon, targeting infrastructure linked to Hezbollah in southern Beirut.
US Central Command said the US military “eliminated” 16 Iranian mine-laying vessels near the Strait of Hormuz on Tuesday. President Donald Trump warned that any mines placed in the Strait must be removed immediately.
US officials said on Tuesday that military operations were intensifying, with limited prospects for diplomatic talks. Trump said late Monday that the conflict could end soon.
Saudi Arabia, the United Arab Emirates, Kuwait, and Iraq have reduced output by more than 6 million barrels per day as the Strait of Hormuz remains effectively closed. The largest oil refinery in the UAE also halted operations after a drone strike.
Market Volatility And Positioning
We are seeing a classic battle between a major supply shock and a significant policy response, creating immense volatility. The market is currently focused on the potential record IEA reserve release, but the physical reality is that over 6 million barrels per day are offline. The closure of the Strait of Hormuz alone affects roughly a fifth of the world’s daily oil consumption, a far more powerful and sustained factor than a temporary reserve draw.
This extreme uncertainty is a direct signal to prepare for wild price swings, pushing options premiums higher. We anticipate the CBOE Crude Oil Volatility Index (OVX) will surge, much like it did during the onset of geopolitical conflicts in previous years, such as in early 2022. Derivative strategies that profit from this volatility, like long straddles or strangles, should be strongly considered to capitalize on sharp moves in either direction.
While the proposed IEA drawdown is larger than the one seen in 2022, we must remember that strategic reserves are not infinite. Looking back, the 2022 release only provided temporary relief before fundamentals took over, and with U.S. strategic reserves already hovering near 40-year lows, the long-term impact of this new release is questionable. The market seems to be underestimating the severity of a prolonged Middle East supply disruption.
Therefore, we believe the current price dip is an opportunity to position for higher prices in the medium term. Buying longer-dated call options, for contracts expiring in the third and fourth quarters, allows us to look past the immediate noise of the IEA announcement. This positions us to profit from the more dominant supply shortage that will likely dictate prices once the strategic barrels have been absorbed by the market.
Create your live VT Markets account and start trading now.
Start trading now – Click here to create your real VT Markets account
Qatar’s Ministry of Defence said its armed forces intercepted a missile attack that targeted the country, Reuters reported on Wednesday. The update came as Iran continues to target neighbouring countries and US assets in the region.
The Israel Defense Forces said it launched a new wave of strikes on Iran after explosions were heard in Tehran. Israel also fired more missiles at Lebanon, saying it was targeting Hezbollah infrastructure in the south of Beirut.
Regional Conflict Drives Market Uncertainty
The Financial Times reported late Tuesday that Israel rejected Lebanon’s request for a halt in fighting to allow talks. It said Israel demanded negotiations take place “under fire”.
West Texas Intermediate (WTI) was down 1.06% at $83.85 at the time of writing. The price had reached $113.28 earlier this week, the highest level in more than three years.
We are seeing a significant escalation of conflict in the Middle East, with direct strikes between Israel and Iran and the involvement of Qatar. This introduces extreme uncertainty into the market, which is the primary factor traders must now price in. The CBOE Crude Oil Volatility Index (OVX) has consequently surged by over 40% this week, reaching levels not seen since the supply chain crisis of 2025.
The price action in West Texas Intermediate crude oil is a clear warning sign of this volatility. After an initial fear-driven spike to over $113 per barrel, the price has sharply retraced nearly 26% to the mid-$80s, suggesting traders are either taking profits or beginning to fear demand destruction from a wider conflict. This creates a difficult environment for directional bets, as the market is torn between supply risks and recessionary fears.
Given that Israel has rejected ceasefire talks, we should expect this tension to persist for weeks, keeping volatility elevated across asset classes. The VIX, a measure of equity market fear, has already jumped to 35, well above its long-term average, as traders hedge against spillover effects. We believe positioning for continued price swings, rather than a specific direction, is the most prudent approach.
Strategies For Volatile Markets
Derivative traders should consider using options to define risk, as the situation could pivot rapidly on a single headline. Buying long-dated strangles on oil ETFs like USO allows a position to profit from a large move in either direction, whether it’s a supply-shock spike or a demand-shock collapse. Implied volatility is high, making these strategies expensive, but the risk of being caught on the wrong side of a directional futures bet is higher.
We are also looking at sector-specific plays that have a clearer path. Call options on defense contractors are becoming more attractive as their order books are likely to expand; stocks like Northrop Grumman are already up 8% this week. Conversely, put options on airline and transportation ETFs offer a hedge, as their margins will be crushed by sustained high fuel costs and potential disruptions to global trade routes.
Create your live VT Markets account and start trading now.
Start trading now – Click here to create your real VT Markets account
Japan’s Producer Price Index (month-on-month) for February came in at -0.1%. The forecast had been 0.1%.
The update was released on 03/10/2026 at 23:50:04 GMT. The item was published by the FXStreet Team.
Implications For Bank Of Japan Policy
This morning’s report showing a surprise fall in producer prices suggests that inflationary pressures in Japan are fading. This makes it highly unlikely that the Bank of Japan will consider raising interest rates in the near future. For us, this reinforces the view that Japanese monetary policy will remain loose for the foreseeable future.
The gap between Japanese and U.S. interest rates is therefore set to remain wide, as the Federal Reserve is holding its key rate steady around 5.3%. This environment strongly favors a weaker yen against the dollar. We should consider buying call options on USD/JPY, positioning for the exchange rate to climb higher in the coming weeks.
A weaker yen is also a significant tailwind for Japan’s export-heavy stock market, boosting the value of overseas earnings. The Nikkei 225 index has already climbed over 15% this year, and this news could fuel further gains. Buying Nikkei 225 futures or call options appears to be a logical strategy to capitalize on this trend.
Looking back at 2025, we saw the Bank of Japan try to prepare markets for a gradual move away from its ultra-easy policy. That sentiment now seems premature given this new data. We remember how any sign of policy hesitation throughout 2025 led to significant yen weakness.
What To Watch Next
This producer price report follows the core consumer inflation data from late January, which at 1.8% also undershot expectations. All eyes will now be on the next Bank of Japan meeting and upcoming inflation figures to see if this disinflationary trend is solidifying. A continuation would validate holding these derivative positions.
Create your live VT Markets account and start trading now.
Start trading now – Click here to create your real VT Markets account
Japan’s Producer Price Index rose 2% year on year in February. The market expectation was 2.1%.
The update was published at 23:50:04 GMT on 03/10/2026. It reports the actual figure alongside the forecast.
Risk Disclosure Summary
The article includes a risk notice about forward-looking statements and possible errors. It also states the content is for information only and is not advice to buy or sell assets.
It says trading can involve large losses, including loss of all capital. It adds that responsibility for risks, losses, and costs sits with the reader.
The piece notes that views in the article are those of the authors, not FXStreet or advertisers. It also says the author had no stated positions, business relationships, or extra payment beyond FXStreet.
It states FXStreet and the author do not provide personalised recommendations. It adds they are not registered investment advisers and accept no liability for losses linked to use of the information.
Yesterday’s producer price index data for February showed a reading of 2.0%, missing expectations slightly. This figure suggests that inflationary pressures at the wholesale level are not accelerating as some had anticipated. For us, this eases the immediate pressure on the Bank of Japan to consider a more aggressive policy shift in the coming weeks.
Market Implications And Positioning
This data reinforces the view that the interest rate difference between Japan and other major economies will remain wide for now. For instance, the US Federal Reserve held rates steady at its last meeting, maintaining a significant yield advantage over Japan. Consequently, we should consider strategies that benefit from a weaker yen, such as buying call options on the USD/JPY pair.
Looking back, we saw how sensitive the yen was to these rate differentials throughout 2025, where a dovish Bank of Japan consistently weakened the currency against the dollar. Historical data from 2023 and 2024 showed similar patterns, with USD/JPY rising significantly as the policy gap widened. This latest PPI number suggests that this well-established trend is not yet over.
For equity traders, a central bank that is not in a hurry to raise rates is generally positive for the stock market. Lower borrowing costs support corporate earnings and investment, making Japanese equities more attractive. We should therefore explore bullish positions on the Nikkei 225 index through futures or call options.
This producer price data also implies that yields on Japanese Government Bonds are likely to stay low. The Bank of Japan has been managing the yield curve for years, and this inflation reading gives them little reason to abandon that policy abruptly. Traders might look at futures contracts to position for continued stability or a slight decline in JGB yields.
However, all eyes will soon turn to the upcoming “Shunto” spring wage negotiation results. National CPI data released in late February showed core inflation cooling to 2.4%, and a weak wage settlement would cement the case for the Bank of Japan to stay put. A surprisingly high wage increase, on the other hand, could quickly reverse these current trends.
Create your live VT Markets account and start trading now.
Start trading now – Click here to create your real VT Markets account
ECB President Christine Lagarde said the level of uncertainty and volatility is very surprising. She said the ECB will take the necessary measures to control inflation.
Lagarde said the current situation is very different from 2022 and that the ECB has a better capacity to absorb shocks. She said the degree of volatility makes the situation hard to manage.
Uncertainty And Policy Signals
She said she cannot say precisely what will be decided on interest rates. She said Europe will not be allowed to face the same inflation as in 2022/2023, and she said the euro area is not in stagflation.
At the time of writing, EUR/USD was down 0.22% at 1.1610. The ECB is the Eurozone’s reserve bank, based in Frankfurt, and aims to keep inflation at around 2% mainly by raising or lowering interest rates.
The Governing Council meets eight times a year to set policy. Quantitative easing involves creating euros to buy assets and is usually linked with a weaker euro, while quantitative tightening involves ending purchases and reinvestments and is usually linked with a stronger euro.
Given the surprising degree of uncertainty and volatility, we should anticipate sharp movements in European markets. The European Central Bank’s firm stance against inflation suggests it will delay any planned interest rate cuts or even consider tightening if necessary. This creates a difficult environment for managing risk over the next few weeks.
Inflation Data And Market Repricing
This hawkish tone is likely a reaction to recent data, as we saw Eurozone inflation for February 2026 unexpectedly tick up to 2.4%, interrupting the steady decline we observed throughout 2025. While this is a far cry from the peaks of 2022, it’s enough to make the central bank cautious. This goes against the market’s previous conviction that rate cuts were coming soon.
As a result, bets on a June 2026 rate cut are quickly being repriced, with market odds dropping significantly in the last few days. We are now seeing traders push their expectations for the first cut further into the third quarter. This shift in expectations will be a primary driver of bond and currency derivatives.
The explicit mention of high volatility is a clear signal for traders to protect their portfolios. The VSTOXX index, which measures Euro Stoxx 50 volatility, has already jumped over 15% in the last week, moving from its calm state in February. We should prepare for this heightened volatility to persist through March and into April.
In this environment, strategies that profit from price movement itself, rather than direction, are becoming more attractive. We should consider buying options, such as straddles or strangles, on instruments like the Euro Stoxx 50 index or the EUR/USD pair. This allows us to benefit from the large swings that the ECB’s uncertainty is likely to cause.
Looking back, the market’s path seemed much clearer in the final quarter of 2025 when a steady disinflationary trend was firmly in place. This sudden return of uncertainty is a stark reminder of how quickly conditions can change. It contrasts with the calmer period we experienced last year when the main question was not *if* the ECB would cut rates, but *when*.
The Euro itself is now caught in a tug-of-war. A central bank ready to fight inflation is typically supportive of its currency, but the overarching volatility and growth concerns are a headwind. This makes straightforward long or short positions on the EUR/USD risky, reinforcing the view that volatility-based plays are the more prudent approach for now.
Create your live VT Markets account and start trading now.
Start trading now – Click here to create your real VT Markets account
Jensen Huang says AI is “essential infrastructure, like electricity and the internet” and the buildout is only “a few hundred billion dollars” in, with “trillions of dollars” still to build.
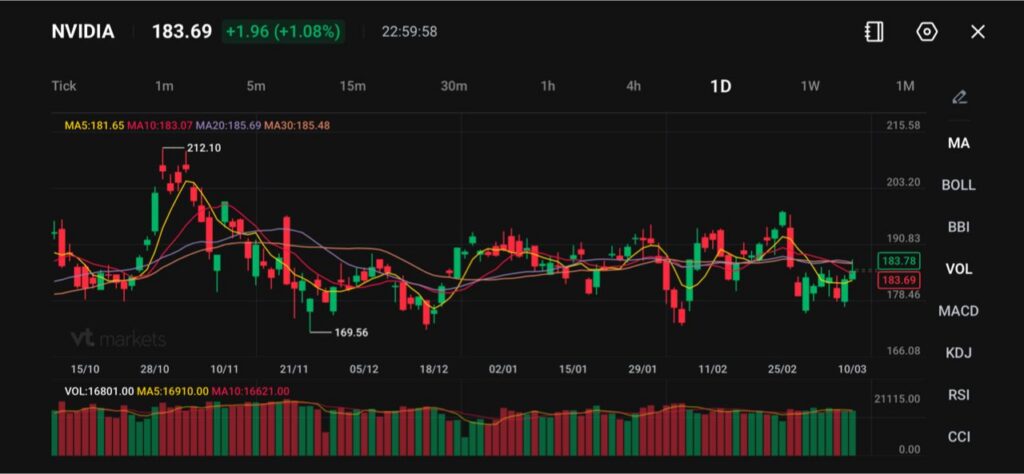
NVIDIA stock sits at 183.69, up +1.96 (+1.08%), with MA5 181.65, MA10 183.07, MA20 185.69, MA30 185.48.
Layoff messaging keeps colliding with AI optimism: Block cut 40% of staff, Pinterest cut up to 15%, and Goldman sees US unemployment edging from 4.4% to 4.5% by year-end.
The Market Takeaway From Huang’s “Buildout” Message
Jensen Huang is trying to reframe the AI cycle as an industrial capex supercycle, not a software fad. In his March 10 blog post, he calls AI “essential infrastructure, like electricity and the internet”, and says the industry has only put “a few hundred billion dollars” into the buildout so far, with “trillions of dollars” still to go.
For markets, that framing matters because it shifts the debate from short-term AI revenue to long-term demand for power, data centres, networking, cooling, and skilled labour. Huang also argues AI is a “five-layer cake” spanning energy, AI chips, infrastructure, AI models, and applications.
If traders buy the “infrastructure cycle” story, semis and data-centre supply chains can keep attracting capital even in a choppy macro tape. If oil stays volatile and bond yields stay sticky, markets may still fade rallies in high-multiple tech, even if the long-run thesis remains intact.
Jobs Narrative Splits Into Two Tracks
Huang’s key claim is that AI will not become the large-scale job taker many fear, because building and maintaining “trillions of dollars” of infrastructure needs a large workforce. He lists trades such as electricians, plumbers, steelworkers, network technicians and operators, and calls them “skilled, well-paid jobs” that are “in short supply”.
At the same time, the market has fresh evidence that firms are already using “AI efficiency” as a justification for headcount cuts. Block cut 40% of staff, with CEO Jack Dorsey pointing to AI-enabled efficiency. Pinterest cut up to 15% of jobs as it redirected resources toward AI.
Goldman Sachs analysts have described AI job losses as “visible but moderate”, while flagging that AI-driven displacement could lift the US unemployment rate from 4.4% to 4.5% by year-end.
That split matters for risk assets. Markets can price both at once: near-term layoffs that lift margins, plus a longer-term capex wave that lifts demand for equipment and power.
Chip stocks including Nvidia are holding up despite market volatility, according to the charts https://t.co/ucmOMIRphK
If more companies follow Block-style cuts, equities may like the margin story in the short run, but consumer-facing sectors could feel pressure if job insecurity rises. If capex ramps as Huang expects, industrials and infrastructure-linked names may gain relative strength, but the path will depend on rates and energy costs.
Technical Analysis
NVIDIA (NVIDIA) is trading near $183.69, up around 1.08%, as the stock attempts to stabilise following a period of sideways consolidation that has dominated trading since late November. The daily chart shows the market holding within a broad range after the sharp rally that pushed prices to a peak near $212.10 before momentum faded.
From a technical standpoint, price is currently sitting close to its short-term moving averages. The 5-day moving average (181.65) is slightly below the current price, while the 10-day (183.07) is almost aligned with the market.
Meanwhile, the 20-day (185.69) and 30-day (185.48) averages sit marginally above the current level, suggesting the stock remains trapped within a narrow consolidation band with no clear directional breakout yet.
Immediate resistance appears near $190–$192, where previous rallies have struggled to sustain momentum. A move above this area could open the path toward $200, followed by the $212 region that marked the prior high. On the downside, initial support lies around $178–$180, with stronger structural support closer to $170, which previously acted as a major swing low.
Overall, NVIDIA appears to be range-bound in the near term, with the market digesting earlier gains. A decisive break above $192 would strengthen the bullish outlook, while a move below $178 could trigger renewed downside pressure.
Macro Link That Traders Should Not Ignore
The buildout pitch lands at a tricky time. AI data centres consume power, materials, and financing. When energy prices rise and yields climb, the market can become less patient with long-duration growth stories. That does not kill the AI thesis, but it can change the timing and leadership within tech.
The job angle also matters for central banks. If unemployment drifts from 4.4% to 4.5% as Goldman outlines, policymakers may face a slower-growth backdrop at the same time that energy and infrastructure spending keep parts of inflation sticky.
If data shows cooling employment without a sharp inflation drop, markets may keep trading a narrow path where quality growth and cash-rich leaders hold up, while rate-sensitive risk stays jumpy.
What to Watch Next
Follow-through on “trillions” of buildout claims via real orders, capex guidance, and data-centre power build plans.
Whether “AI efficiency” layoff headlines broaden beyond tech, after Block’s 40% cut and Pinterest’s up to 15% reduction.
NVIDIA behaviour around 185.48–185.69 overhead and 181.65 support, with 183.69 as the current pivot.
Create a live VT Markets account today to access our platform features, including market insights and educational content.
Frequently Asked Questions
How Big is the AI Buildout According to Huang? Huang said the buildout is only “a few hundred billion dollars” in so far, and that “trillions of dollars” of infrastructure still need to be built.
Why Does a “Trillions” Buildout Matter for Markets? Large infrastructure cycles usually spread demand across multiple industries. Traders may look beyond software into power, data centres, networking, cooling, construction, and industrial labour as second-order beneficiaries.
What Is Huang’s “Five-Layer Cake” Model For AI? He described AI infrastructure as a “five-layer cake” consisting of energy, AI chips, infrastructure, AI models, and applications. It outlines the chain from power supply through to end-user products.
Why Does Huang Say AI Will Not Be A Large-Scale Job Taker? He says the buildout needs workers to build and maintain the infrastructure. He listed roles such as electricians, plumbers, steelworkers, network technicians, and operators, and called them “skilled, well-paid jobs” that are “in short supply”.
How Do Layoffs Fit With This Pro-Jobs View? Companies can cut some roles while still increasing demand for other roles. The article cites examples of firms linking cuts to AI efficiency: Block cut 40% of its staff, and Pinterest and Dow cited AI as the reason to cut a total of more than 5,000 employees between them.
What Does Goldman Sachs Expect For US Unemployment? Goldman Sachs analysts said AI-driven job losses have been “visible but moderate”, and that AI could lift the US unemployment rate from 4.4% to 4.5% by year-end.
Start trading now – Click here to create your real VT Markets account
US Central Command said US forces eliminated several Iranian naval vessels, including 16 minelayers operating near the Strait of Hormuz, Reuters reported on Wednesday. The statement came after Donald Trump said 10 “inactive” minelayers had been “completely destroyed”.
Trump said on Tuesday that if mines are placed and not removed, Iran will face consequences “at a level never before seen”. No further detail was provided in the text.
Market Reaction And Oil Prices
At the time of writing, West Texas Intermediate (WTI) was down 1.33% at $83.73. It had earlier reached over three-year highs of $113.28 this week.
The text defines “risk-on” and “risk-off” as terms for how much risk market participants accept. In risk-on conditions, stocks, most commodities except gold, commodity-linked currencies and cryptocurrencies tend to rise, while in risk-off periods, bonds, gold and safe-haven currencies tend to do better.
It says risk-on tends to support the Australian Dollar (AUD), Canadian Dollar (CAD), New Zealand Dollar (NZD), and also the Ruble (RUB) and South African Rand (ZAR). It says risk-off tends to support the US Dollar (USD), Japanese Yen (JPY) and Swiss Franc (CHF).
Last year, we saw how quickly the market reacted when US forces engaged with Iranian vessels near the Strait of Hormuz. WTI crude futures shot up to over $113 a barrel, a three-year high at the time, before pulling back, showing just how sensitive energy prices are to conflict in that specific waterway. That event created a clear playbook for how markets respond to military escalation in the Gulf.
Today, we see a similar, though less acute, pattern of tension which traders must watch closely. Although direct conflict has been avoided, recent satellite imagery shows a heightened naval presence, and war risk insurance premiums for tankers passing through the strait have ticked up by 0.15% in the last quarter. This underlying friction keeps energy markets on edge, with WTI currently hovering around $91 a barrel, well above the levels seen before last year’s incident.
Derivatives Hedging And Safe Haven Flows
For derivative traders, this environment suggests that buying near-term call options on crude oil futures is a prudent strategy to position for any potential flare-up. Implied volatility in oil options has risen to its highest level in six months, indicating that the market is already pricing in a higher probability of a sharp move. This makes options a more capital-efficient way to gain upside exposure compared to holding long futures contracts directly.
This situation points toward a broader risk-off sentiment if things escalate. We’re already seeing early signs of this as the CBOE Volatility Index, or VIX, has climbed from a low of 17 to over 21 in the past three weeks, reflecting growing nervousness in the equity markets. Therefore, purchasing put options on major stock indices could serve as an effective hedge against a wider market downturn triggered by geopolitical shocks.
In the currency markets, we should expect safe-haven currencies to outperform. The Japanese Yen and Swiss Franc will likely benefit from capital flight, just as they have during previous periods of global uncertainty. Consequently, traders could consider call options on the JPY or CHF, particularly against commodity-exporting currencies like the Australian Dollar, which would suffer from a risk-off move.
Create your live VT Markets account and start trading now.
Start trading now – Click here to create your real VT Markets account
Nasdaq 100 has moved sideways for about 3 months and retested the range low this week. The drop into the low was overlapping, while the rise from Monday looks more like an impulse move.
The view presented is that the wider trend fits a wave ii rally bias. A further 3–5% rise later this week is described as possible, with pressure on all-time highs.
Wave Structure And Key Levels
The rally from the November 2025 low is described as a diagonal (rising wedge). The fall from the January high is described as corrective due to overlapping price action.
The move up from the Monday 9 March low is labelled as wave i of a larger impulse. A pullback in wave ii is mapped to 24,629–24,842, tied to the 38% and 61% Fibonacci retracement levels.
After wave ii, wave iii is projected to push towards a retest of highs near 25,200, with 26,200 also given as a potential level. A drop to or below 23,854 is set as a point that would trigger a review of the wave count.
For the past three months, we have watched the Nasdaq trade in a frustrating sideways range, with the CBOE Volatility Index (VIX) hovering in a tight band between 18 and 22. The strong, impulsive rally since Monday, March 9th, suggests this corrective period that began in January 2026 might be concluding. This could be the start of a new upward leg.
Risk Management And Positioning
We are now looking for a temporary pullback into the key support zone between 24,629 and 24,842. This area represents a classic 38% to 61% Fibonacci retracement of the initial thrust up from the March 9th low. For traders, this could be an ideal area to start building long positions through bull call spreads or by selling cash-secured puts.
If support holds, we anticipate a powerful wave ‘iii’ to develop, targeting the 26,200 level and new all-time highs. This view is supported by last week’s Producer Price Index (PPI) data, which showed cooling inflation, giving the Fed room to stay accommodative. A similar pattern was observed back in the fourth quarter of 2024, when a brief correction was followed by a sharp 12% rally into year-end.
Risk management remains paramount, with the 23,854 level acting as our line in the sand. A decisive break below this horizontal support would invalidate the immediate bullish setup and signal a potentially deeper correction is underway. Any long derivative positions should have stops placed just below this critical zone to protect capital.
Create your live VT Markets account and start trading now.
Start trading now – Click here to create your real VT Markets account
Gold traded near $5,190 in early Asian dealings on Wednesday, steady after recent swings. The move came ahead of the US February CPI inflation release.
US President Donald Trump said US military operations in Iran would be ending soon, with no clear timetable. His comments coincided with lower oil prices and reduced inflation concerns.
Middle East Risk And Oil Flow Threats
Markets continued to track developments in the Middle East. Iran’s Islamic Revolutionary Guard Corps said Iran could block regional oil exports if US and Israeli attacks continue, while Trump warned the US would respond if oil flows through the Strait of Hormuz are disrupted.
US CPI data is due later on Wednesday, with headline inflation forecast at 2.4% year on year in February and core CPI at 2.5%. A higher reading could strengthen the US Dollar and pressure the dollar-priced gold market.
Central banks are the largest holders of gold. They added 1,136 tonnes worth about $70 billion in 2022, the highest annual total on record, according to the World Gold Council.
Gold often moves opposite to the US Dollar and US Treasuries. It is also influenced by interest rates and geopolitical risk.
Looking Back At 2025 Price Volatility
Looking back to this time in 2025, we recall gold trading near an impressive $5,200 level, driven by significant Middle East tensions and anticipation of key inflation data. That period of volatility was a reminder of how geopolitical headlines can quickly impact the price of safe-haven assets. The focus on a potential de-escalation showed how sensitive the market was to any news from the conflict.
The upcoming US Consumer Price Index (CPI) report was a major focal point then, just as it is for us now. The market last year was bracing for a 2.4% headline figure, and any deviation caused sharp moves. Today, with the February 2026 CPI data showing inflation stubbornly above 3%, the Federal Reserve’s path on interest rates is even more uncertain, creating a challenging headwind for gold.
While the specific US-Iran flare-up of early 2025 has subsided, the broader geopolitical landscape remains tense, providing an underlying bid for gold. We see that consistent safe-haven demand is a key support, even as the dollar has strengthened. This dynamic suggests that any new escalations could trigger a rapid move upwards, similar to what we saw last year.
For derivative traders, this environment suggests looking at options strategies that can benefit from potential price swings. With the market uncertain about the Fed’s next move, implied volatility on gold options has been elevated, recently hovering around 18%, which is higher than its 52-week average. This indicates that option sellers can collect higher premiums, but buyers are pricing in the possibility of significant price action.
We must also consider the persistent buying from central banks, which has continued since the record-breaking purchases we saw in the years leading up to 2025. According to the most recent data from 2025, global central banks added another 950 tonnes to their reserves, underscoring their long-term strategy to diversify away from the dollar. This structural demand provides a solid floor under the gold price, limiting the potential downside.
Ultimately, the inverse relationship with the US Dollar remains the most critical factor for short-term price movements. As long as inflation remains a concern and keeps the Federal Reserve from cutting rates, the strong dollar will likely cap gold’s upside potential. We are watching for any shift in Fed language, as that would be the primary catalyst for a sustained break in either direction.
Create your live VT Markets account and start trading now.
Start trading now – Click here to create your real VT Markets account