At a European Parliament committee hearing on 18 March 2026, Claudia Buch, Chair of the ECB Supervisory Board, said there was no decline in bank asset quality and non-performing loan (NPL) ratios remained stable. NPL ratios are used as an indirect measure of the financial health of borrowing firms in the EU, especially in manufacturing.
Across most EU countries, manufacturing NPL ratios are at historically low levels. Countries with the highest ratios at the start of the period generally saw the sharpest falls.
Manufacturing Npl Trends Across The Eu
In most cases, manufacturing NPL ratios fell by more than half between Q2 2019 and Q4 2025. Where ratios rose over that time, the increases were generally modest.
The overall fall in manufacturing NPL ratios points to improved financial health in many EU countries. This suggests the sector may be better placed to absorb the 2026 energy shock linked to the war in Iran than it was at the start of the 2022 war in Ukraine.
Policy support is expected to be more limited due to budget constraints. Orders linked to defence, public infrastructure and AI may help reduce the impact on business bankruptcies and unemployment.
We are seeing European manufacturing corporations face this new energy shock from Iran from a position of relative strength. Following Claudia Buch’s comments on March 18, we know bank asset quality is stable, with non-performing loan (NPL) ratios for manufacturers having fallen by more than half by the end of 2025. However, with Brent crude futures now surging past $115 a barrel, this underlying health will be severely tested in the coming weeks.
Volatility And Hedging Trade Setups
This situation points towards a spike in market uncertainty, making long volatility positions attractive. The VSTOXX index, Europe’s main fear gauge, has already climbed to 28, and we should consider buying call options or futures on it, anticipating a move towards the levels over 40 seen during the 2022 shock. At the same time, this implies downside pressure on broad indices, making put options on the Euro Stoxx 50 a reasonable hedge against long equity portfolios.
The impact will not be uniform across sectors, creating opportunities for pair trades. We should look at buying put options on energy-intensive industrial ETFs, as the latest flash PMI data from March 24th already showed a dip to 45.2, citing energy costs. These short positions can be paired with call options on defence contractors like Rheinmetall, which continue to benefit from strong order books established through 2025.
Beyond equities, the credit markets may be underpricing the coming risk due to the historically low NPLs. We could consider buying protection through credit default swaps (CDS) on indices tracking lower-rated European corporate debt. A sustained energy price shock will inevitably strain balance sheets, regardless of their starting point.
Finally, this is a clear negative for the Euro, as the region is a net energy importer. The European Central Bank’s focus on inflation, as reiterated last week, limits its ability to soften the blow, reinforcing the case for a weaker currency. We should view any strength in the EUR/USD as an opportunity to initiate short positions.
Create your live VT Markets account and start trading now.
Start trading now – Click here to create your real VT Markets account
Australia’s headline CPI was flat month on month in February, and annual inflation eased to 3.7% versus a 3.8% consensus forecast. January and February results suggest trimmed mean inflation is running slightly below the RBA’s February 2026 Statement of Monetary Policy track.
Housing and electricity were key sources of price pressure. Annual housing inflation rose from 6.8% year on year in January, linked to higher costs for electricity, new dwellings and rents.
Electricity Rebates And Underlying Inflation
Electricity prices and inflation measures have been affected by Commonwealth and State Government rebates and by the timing of their expiry. Excluding the effect of these rebates over the past year, electricity prices increased 4.9% in the 12 months to February.
The monthly CPI series is still relatively new and needs more time before it can be used as the main benchmark. Inflation in February stayed elevated before the US/Israel-Iran war disrupted Middle Eastern energy supplies and pushed petrol prices higher.
The February inflation number coming in at 3.7% might seem like good news, but we see underlying strength that the market is overlooking. Housing and electricity costs are not easing, which means the Reserve Bank of Australia (RBA) has little room to soften its stance. This suggests that market pricing for interest rate cuts later this year may be too optimistic.
Given these stubborn price pressures, we are looking at derivatives that bet on the RBA holding the cash rate at its current 4.35% for longer than anticipated. Back in late 2025, the market was far more aggressive in pricing rate cuts for mid-2026. We are now considering selling 90-day bank bill futures contracts, which would profit if short-term interest rates do not fall as expected.
Positioning For Rates And Volatility
The temporary government electricity rebates have been masking the true extent of inflation, and their expiration will create an upward shock in the coming months. Furthermore, the recent escalation in the Middle East has pushed Brent crude oil prices above $95 a barrel, a factor not even captured in the latest data. This adds another layer of upside risk to inflation that derivatives markets may not have fully priced in.
A hawkish RBA, holding rates steady while other central banks might be looking to ease, creates a favorable environment for the Australian dollar. We are exploring call options on the AUD/USD pair, anticipating that a widening interest rate differential will support the currency. This is a similar pattern to what we observed in parts of 2025 when rate divergence drove currency movements.
The conflicting signals—a soft headline number against strong core drivers and new geopolitical risks—point towards increased market uncertainty. Volatility is likely to rise from its currently subdued levels, with the S&P/ASX 200 VIX Index trading near 12. Buying options, such as straddles on interest rate futures, could be a prudent strategy to profit from a significant market move in either direction.
Create your live VT Markets account and start trading now.
Start trading now – Click here to create your real VT Markets account
The United States 5-year note auction yield rose to 3.98% from 3.615% at the previous auction.
This change shows an increase of 0.365 percentage points compared with the prior result.
Implications For Fed Policy
This sharp increase in the 5-year note yield is a significant hawkish signal, suggesting the market is now pricing in a more aggressive Federal Reserve posture for longer than we anticipated. We must adjust our positions to reflect the growing possibility that rate cuts are further off than the consensus believed just last month. This indicates a clear shift in bond market sentiment, forcing a re-evaluation of our interest rate forecasts for the remainder of 2026.
The move aligns with the latest inflation data from February 2026, which showed core CPI stubbornly holding at 3.3%, well above the Fed’s comfort zone. Looking back at the aggressive rate-hike cycle of 2022 and 2023, the market is now pricing in less than a 40% chance of a rate cut before the September 2026 meeting, down from over 70% a month ago. Consequently, we should consider adding to short positions in Treasury futures, specifically the 5-year (/ZF) and 10-year (/ZN) contracts, to capitalize on this trend.
For equities, this development spells trouble for growth-oriented sectors sensitive to higher borrowing costs. We saw in 2022 how quickly valuations can compress when discount rates rise, and this auction result is a fresh reminder of that vulnerability. Therefore, buying protective put options on the Nasdaq 100 tracking ETF (QQQ) or establishing bearish call spreads on the S&P 500 are prudent moves to hedge our portfolios.
This divergence in yield expectations should also provide a strong tailwind for the U.S. dollar. With the European Central Bank and Bank of Japan still maintaining a more dovish tone, the interest rate differential is widening in the dollar’s favor, which has already pushed the U.S. Dollar Index (DXY) up 2% this month to over 106. We should look to establish or increase long positions in USD futures (/DX) against a basket of other major currencies.
Finally, the implied volatility in the bond market is now on the rise, with the MOVE index climbing back above 110 for the first time since last quarter. This jump in uncertainty suggests that outright directional bets could face significant whipsaws in the coming weeks. It would be wise to use options strategies like straddles on bond ETFs such as TLT to profit from this increased volatility, regardless of the ultimate direction of rates.
The Pound Sterling fell against the US Dollar on Wednesday as the Dollar edged higher. Risk aversion increased after reports said Iran’s Bushehr nuclear power plant was hit.
UK inflation data also weighed on GBP/USD during the session. The pair was down 0.30% and traded near 1.3370 at the time of writing.
Geopolitical Risk And Uk Inflation
We remember seeing a similar pattern back in 2025, when geopolitical risk and stubborn UK inflation pushed GBP/USD down towards 1.3370. That combination of a strong safe-haven Dollar and domestic UK economic concerns created significant downside pressure. This dynamic appears to be re-emerging, but with a new set of figures relevant to us today.
The key driver now is the policy divergence between the Bank of England and the US Federal Reserve. With the latest UK CPI data for February 2026 coming in at 2.1%, just above the BoE’s target, the pressure to hold rates high is easing. In contrast, recent US core PCE data remains stickier at 2.8%, suggesting the Fed will be more patient, which is keeping the Dollar bid and has pushed the GBP/USD pair to its current level around 1.2550.
This environment suggests that implied volatility may increase in the coming weeks. We’ve seen the Cboe Sterling VIX (BPVIX) already tick up to 9.5, its highest level this quarter, indicating traders are pricing in larger price swings. For those anticipating further downside, buying GBP/USD put options with expirations in late April or May could provide a cost-effective way to position for a break below the 1.2500 support level.
Alternatively, for traders looking for a more capital-efficient strategy, establishing bearish put spreads could be a prudent move. This would involve buying a put at a higher strike price and selling one at a lower strike price to finance the position. This approach allows us to target a specific downward range for the pair while managing premium costs in a market where volatility is expected to rise.
Silver (XAG/USD) slowed its rise on Wednesday and traded below the day’s high as early optimism over US-Iran ceasefire efforts faded. XAG/USD was near $72.74, up about 2%, after dropping earlier this week to around $61, its lowest since December 2025.
Silver jumped after reports the US sent Iran a 15-point plan to end the conflict, which reduced geopolitical risk priced into Oil. Lower immediate inflation worries eased pressure on central banks to raise rates, supporting a non-yielding asset like Silver.
Ceasefire Hopes Fade
The move weakened after Iran rejected the proposal, with Press TV reporting Tehran would end the conflict only on its own terms. Iran’s conditions include stopping attacks and assassinations, guarantees the war will not restart, compensation for damages, an end to fighting across regional fronts, and recognition of control over the Strait of Hormuz.
Uncertainty supported the US Dollar, while high Oil prices kept inflation risks in place, limiting follow-through buying in Silver. Technical signals were neutral to mildly bearish, with price below the 50-day SMA at $85.51 and the 100-day SMA at $74.33.
RSI was 40 and ADX was in the low 20s, pointing to weak momentum. Resistance sits at the 100-day SMA, with $80 next, while support is near $66.01, then $61.01, and the 200-day SMA at $57.99.
The rejection of the US ceasefire plan by Iran signals that geopolitical tensions will remain the primary driver for silver in the coming weeks. We are seeing this reflected in options pricing, with the Silver Volatility Index (SVIX) recently spiking to 42, a high not seen since the conflict began late in 2025. This environment suggests that outright directional bets are risky, and strategies profiting from price swings should be considered.
Options Strategy Outlook
Iran’s firm stance, particularly its demand for control over the Strait of Hormuz, is keeping WTI crude oil prices elevated above $115 a barrel, sustaining inflation fears. This provides a fundamental reason for the US Dollar’s continued strength, which acts as a headwind for silver prices. Last week’s Commitment of Traders report showed managed money funds trimmed their net-long silver futures positions by 12%, highlighting growing institutional caution.
Given the technical weakness below the 100-day moving average near $74.33, traders could consider buying put options to speculate on a retest of the $61 low from earlier this week. Conversely, call options with strike prices above $75 offer a defined-risk way to play a potential breakout driven by any unexpected de-escalation. The wide and uncertain price range makes long straddle positions, which benefit from a large move in either direction, an attractive strategy.
We can look back at the market’s reaction during the initial months of the Ukraine conflict in 2022 for a potential roadmap. Precious metals saw sharp, headline-driven swings in both directions before a clearer trend emerged. This historical precedent reinforces the idea that for now, nimble strategies are likely to be more effective than holding long-term directional positions.
Create your live VT Markets account and start trading now.
Start trading now – Click here to create your real VT Markets account
AUD/USD fell towards the 0.6960 area as traders weighed mixed Australian inflation data and changes in global risk sentiment. The pair was near 0.6962, after an earlier dip still kept near-term moves cautious.
Australia’s February headline CPI eased to about 3.7% year on year. The RBA Trimmed Mean CPI rose 0.2% month on month and 3.3% year on year, leaving underlying inflation above the RBA’s target.
Key Macro Drivers
Oil price swings linked to the Iran war added uncertainty for the inflation outlook. This supported expectations that the RBA may keep policy tight, while the US Dollar stayed firm amid the Fed’s cautious stance and ongoing inflation concerns.
On the 4-hour chart, the pair remained below the 20- and 100-period SMAs, with both trending lower. The RSI hovered near 40, pointing to a mild bearish tilt rather than strong selling momentum.
Resistance sat at 0.6964 and 0.6972. Support was at 0.6959 and 0.6944, with a break below 0.6944 seen as a trigger for further downside.
We are seeing the AUD/USD struggle in a tight range as conflicting forces weigh on the pair. The Reserve Bank of Australia is under pressure to remain hawkish, especially with Brent crude trading consistently above $105 a barrel, which is expected to reignite inflation. The RBA has held its cash rate at 4.60% for the last four meetings, signaling it has little room to ease policy soon.
Strategy And Volatility Setup
Australia’s February CPI print of 3.7% offered a brief dip, but this is viewed as temporary against the backdrop of rising energy costs. This underlying inflationary pressure supports the Australian Dollar and prevents a significant sell-off. For now, the market is pricing in zero chance of an RBA rate cut before the third quarter.
On the other side, the US Dollar is finding support from a cautious Federal Reserve. The latest US core PCE reading came in at 3.1%, stubbornly above the Fed’s 2% target, while February non-farm payrolls added a strong 250,000 jobs. This data reinforces the view that the Fed will not rush to cut rates, keeping the Greenback firm.
This fundamental clash suggests volatility is likely to increase in the coming weeks. We believe derivative traders should consider strategies that benefit from a potential breakout, as the pair is coiled tightly below the 0.6972 resistance. Buying put options with a strike price below the 0.6944 support level could be a prudent way to position for a downside move driven by sustained US Dollar strength.
When we look back at 2025, we remember the pair trading in a wide band, swinging between roughly 0.6500 and 0.7100 on shifting central bank expectations. That period showed us how quickly sentiment can turn, making long volatility plays attractive right now. The current tight consolidation is unlikely to last, especially with major economic data releases scheduled for early April.
Create your live VT Markets account and start trading now.
Start trading now – Click here to create your real VT Markets account
GBP/USD fell 0.30% to about 1.3370 as the US Dollar rose and risk appetite weakened after reports that Iran’s Bushehr nuclear power plant was hit. Israel and Iran continued exchanging attacks, while the US pursued diplomacy and looked towards possible talks in Islamabad, Pakistan.
Iran rejected a US proposal and listed five conditions to end the war. These included stopping aggression, creating mechanisms to prevent the war being reimposed on Iran, guaranteed payment of damages and reparations, ending the war across all fronts, and Iran asserting sovereignty over the Strait of Hormuz.
Uk Inflation Stays Elevated
UK inflation held at 3% year-on-year in February, unchanged from January and in line with forecasts. Core CPI rose to 3.2% year-on-year, and both measures remained above the Bank of England’s 2% target.
The Bank of England had projected CPI would reach 2% by April, but last week lifted its forecast to 3.5% by mid-2026. A Citi survey showed inflation expectations rising from 3.3% to 5.4%, the largest jump in more than 20 years.
Bond yields rose over two days as markets reduced expectations for rate cuts in 2026. Money markets priced 46 basis points of BoE increases, while the Fed was priced for 4 basis points of tightening and no cuts.
Technically, GBP/USD stayed below moving averages near 1.3500, with resistance from 1.3869 still in place. Support sat just under 1.3350, with downside levels at 1.3300 and 1.3220.
Volatility And Strategy Implications
The escalating conflict in the Middle East is fueling risk aversion, which typically benefits the US Dollar as a safe-haven asset. This geopolitical tension is likely to increase volatility, and we have seen the VIX index, a measure of market fear, climb over 15% in the last week. Traders should anticipate sharp, headline-driven moves and consider strategies that profit from increased price swings.
Persistent UK inflation at 3% is complicating the Bank of England’s path, but it is not strengthening the Pound. With UK inflation expectations surging to 5.4%, the highest in over two decades, the focus is on economic instability rather than rate hikes supporting the currency. Meanwhile, the US 2-year Treasury yield remains firm at 5.1%, making the dollar more attractive than pound-denominated assets.
From a technical standpoint, the GBP/USD pair is facing significant pressure below the 1.3500 resistance level. The immediate focus is the rising trendline support just below 1.3350, a level that has held since early this year. A convincing break below this support, similar to the one we saw in the risk-off environment of late 2025, could trigger an accelerated move lower toward the 1.3220 area.
Given this environment, bearish option strategies on the GBP/USD seem prudent. Buying put options with strike prices below 1.3350 could offer a way to profit from a breakdown in the coming weeks. At the same time, the strong resistance around 1.3500 makes selling call spreads with strikes above that level a viable strategy to capitalize on the pair’s limited upside potential.
Create your live VT Markets account and start trading now.
Start trading now – Click here to create your real VT Markets account
Russia’s industrial output fell by 0.9% in February. This was below the expected rise of 1.1%.
The data shows production declined instead of increasing. The figure indicates weaker factory activity for the month.
The February industrial output figure, coming in at -0.9% against an expected 1.1% growth, signals a significant crack in Russia’s economic stability. This surprise contraction suggests that underlying issues are worse than the market has priced in. We should anticipate immediate bearish sentiment toward Russian-linked assets in the coming weeks.
This data puts direct pressure on the ruble, and we are watching for a sustained break above 98 in the USD/RUB pair. The Central Bank of Russia has struggled to defend the 95 level, and with foreign currency reserves reportedly dipping 2% in the last quarter, its ability to intervene is weakening. We see this as an opportunity to build short positions in the ruble through futures or by buying call options on USD/RUB.
For equities, this negative report makes put options on the MOEX Russia Index an attractive play. We saw a similar situation in mid-2025 when a series of weak manufacturing reports preceded a 7% correction in the index over the following six weeks. This third consecutive month of disappointing industrial data builds a narrative of a sustained downturn that equity markets have yet to fully acknowledge.
On the commodities front, the weakness could mean lower domestic demand for energy, forcing producers to push more Urals crude onto the export market at a discount. The spread between Urals and Brent crude has already widened to $19 a barrel this month, its largest gap since late 2025. This trend could accelerate, creating opportunities to short energy companies heavily reliant on domestic sales.
Overall, the gap between economic reality and market expectations is widening, which points to a rise in volatility. Implied volatility on options for major Russian stocks has already climbed by over 10% in March 2026. This environment is favorable for strategies like straddles, which profit from large price swings in either direction as the market digests this new information.
Start trading now – Click here to create your real VT Markets account
Denmark’s parliamentary election resulted in a fragmented Folketing, with 12 parties winning seats. Neither the red bloc nor the blue bloc secured a majority.
The Moderates, led by Lars Løkke Rasmussen, hold the balance of power. Coalition talks may be complex and could delay the formation of a new government.
Government Formation Timeline
Government formation in Denmark is normally completed within two to three weeks. After the 2022 election, it took a record 42 days to form a cross-centre government.
Until a new government is agreed, the existing administration will remain in office as a caretaker ministry. In this period, it handles only necessary, non-political decisions.
The article was produced using an Artificial Intelligence tool and reviewed by an editor.
The fragmented result of the Danish parliamentary election late last year means we are now facing a period of political uncertainty. For derivative traders, this prolonged instability creates opportunities in volatility. We should anticipate that forming a new government could take well over a month, similar to the record 42 days it took back in 2022.
Volatility And Trading Implications
This situation suggests a likely increase in implied volatility on Danish assets. Options on the OMXC25 index, Denmark’s main stock market benchmark, could be valuable as the market has been flat, down just 0.8% since the start of March 2026, awaiting a clear political direction. Buying straddles could be a prudent strategy to profit from a significant price move in either direction once a government is finally announced.
In the currency market, while the Danish krone is pegged to the euro, the political tension can affect the cost of derivatives used to hedge the currency. The one-month forward points on the EUR/DKK pair have already ticked up slightly, reflecting a small but growing demand to hedge against any unforeseen stress. This is a subtle signal that the market is pricing in a small amount of risk related to the difficult government negotiations.
We can also look at the Danish government bond market for signals. The spread between 10-year Danish government bonds and their German counterparts has widened by a few basis points in the past two weeks, a classic reaction to domestic political uncertainty. Traders can use futures to speculate on this spread widening further if negotiations drag on into late April, as any delay in forming a government postpones clarity on future fiscal policy.
Create your live VT Markets account and start trading now.
Start trading now – Click here to create your real VT Markets account
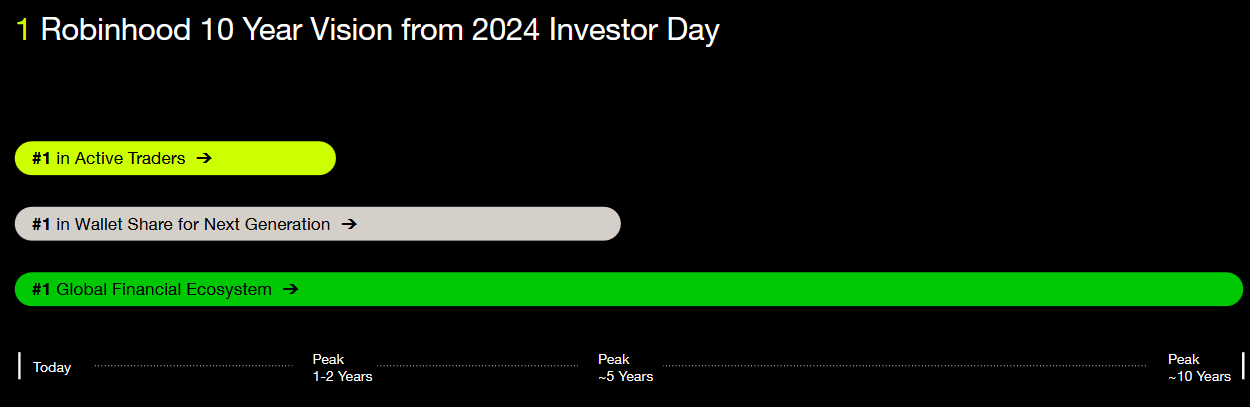
Robinhood is back in focus, but not for the reasons that first made it famous.
At a glance
– Robinhood is trying to expand from a retail trading app into a broader consumer-finance platform.
– Its product range now includes cards, cash tools, retirement products, managed investing, and private-market access.
– Users, assets, and deposits are growing, but revenue still depends heavily on trading activity, crypto cycles, and market sentiment.
– The investment case now rests on whether product expansion can lead to more stable and diversified earnings.
Robinhood is a US fintech platform best known for retail stock, options, and crypto trading.
But the announcement signals a larger purpose. Robinhood is no longer trying to be seen only as a trading app built for bursts of market activity. It is trying to establish itself as a broader financial platform that can hold more of a user’s money, attention, and financial behaviour over time.
Previously, Robinhood was seen as a symbol of meme-era retail trading. Now, the focus is shifting to whether it can retain users as they become more experienced, better funded, and less reliant on short-term speculation.
Find HOOD stock as a CFD Share on our platform today.
How Robinhood is changing beyond trading
Robinhood’s original appeal was straightforward. It lowered the barrier to market access and matched well with users who were comfortable taking risks, acting quickly, and participating in fast-moving themes.
That trading-led base still matters. Robinhood remains centred on self-directed retail activity across equities, options, and crypto. These are products that naturally attract active users and benefit from volatility, engagement, and risk appetite.
What has changed is the company’s effort to build around that base rather than rely on it alone.
That progression is important because it shows how management sees the business evolving.
Instead of focusing only on trading frequency, Robinhood is trying to capture a larger share of each user’s overall financial life.
Its expanding product set now includes:
cash management and spending tools
credit products, including premium cards
retirement accounts and longer-term investing features
managed portfolios
private-market exposure through retail-facing fund structures
This is not a move away from trading. It is a move to keep users inside the platform as their financial behaviour becomes more deliberate and more diversified.
How Robinhood fits Trader Behaviour
For a risk-aware audience, this shift is easier to understand when viewed through trader behaviour rather than product labels.
Many active traders do not stay in one financial mode forever. They often begin with shorter-term opportunities, build confidence through market participation, then gradually develop broader goals around cash management, capital preservation, diversification, and long-term allocation.
Robinhood’s strategy increasingly reflects that progression.
This is where Robinhood looks more credible than it did a few years ago. The company is no longer built only for the first phase of the customer journey. It is trying to remain useful as that same customer becomes more financially capable and more selective.
That also helps explain the move upmarket.
Reuters reported that Robinhood’s premium card strategy is aimed at higher-income users, reflecting an effort to move beyond its earlier speculative image as its customer base ages. The February filing for a planned $1 billion private investment fund IPO fits the same pattern. It is not really an institutional pivot. It is a retail-facing wrapper that allows ordinary investors to buy exposure to private-company stakes through a listed fund structure.
In other words, Robinhood is broadening its menu for the same broad retail audience, from newer traders to wealthier and more experienced users.
Why eyes are on HOOD stock
There are solid reasons why investors are taking this transition more seriously.
As of March 2026, Robinhood reported:
27M funded customers
$322B in platform assets
$68B in net deposits
These figures suggest more than app engagement. They show that Robinhood continues to gather assets and retain financial relevance even as the business broadens beyond trading alone.
The product mix is also becoming more coherent.
Trading may be the entry point, but newer services are designed to increase retention and make the platform useful across different financial needs. A customer who once used Robinhood for options or crypto can now also hold cash, use credit, contribute to retirement products, and explore managed or alternative exposure without leaving the ecosystem.
One of the more interesting additions is Robinhood Ventures Fund I (RVI). Unlike a debit card or cash feature, RVI, which debuted at $658.4 million, is a publicly traded closed-end fund designed to give retail investors access to a concentrated basket of private companies. Structurally, that makes it less of a payment feature than an access product. But it still says something important about where Robinhood is positioning itself in the financial sector.
By offering indirect exposure to private companies such as Stripe, Revolut, Ramp, and Databricks, Robinhood is expanding what retail users can do on the platform. Instead of waiting for high-profile fintech and infrastructure businesses to reach the public market, users can gain earlier exposure through a listed fund wrapper, placing the platform closer to where financial innovation is being built.
The larger significance is that Robinhood is not just serving users who want to trade what is already public. It is gradually widening access across different layers of the financial ecosystem, from liquid markets to private-company exposure. That makes the platform more relevant to users whose strategies, capital base, and time horizon are becoming more developed.
Robinhood’s past identity is still intact
Even with a broader product set, Robinhood’s earnings profile remains closely linked to market conditions.
A significant portion of revenue still depends on:
This matters because it shows that platform expansion has not yet fully changed the business model’s sensitivity to market activity.
Robinhood may be adding more stable-looking products around the edges, but the core earnings engine still responds strongly to cycles in participation, volatility, and speculative interest.
That is the restraint investors keep returning to. The company is broadening structurally, but the income statement still appears cyclical.
Why Traders are alert
For traders, Robinhood is not interesting only because of its products. It is interesting because the company itself reflects a style of market participation.
Robinhood grew by appealing to users who value access, speed, flexibility, and the ability to act on conviction quickly, aligning up with active CFD trading behaviour.
What is different now is that the business is trying to hold that user for longer. Instead of benefiting only from short-term activity, Robinhood wants to benefit as that same user matures, builds capital, and starts allocating across more financial needs.
That makes Robinhood more inviting for serious assessment than it was when it was mainly discussed through the lens of meme stocks and speculative bursts.
For a market-aware reader, the company now raises a broader question about platform quality:can a business that was built around active risk-taking grow into one that also supports longer-term financial habits without losing the energy that made it relevant in the first place?
Bull vs Bear: reading Robinhood today
Bull case
Bear case
Robinhood is expanding into a broader financial ecosystem beyond trading.
Revenue is still meaningfully tied to trading activity and crypto cycles.
Funded customers, platform assets, and net deposits continue to grow.
Recent results still showed sensitivity to expectations and activity fluctuations.
New products may increase wallet share, improve retention, and support a more mature customer base over time.
Newer products still need to prove they can scale and monetise consistently.
RVI shows Robinhood broadening retail access beyond public markets into private-company exposure.
Access products can widen the menu, but they do not automatically change earnings quality in the near term.
The $1.5 billion buyback signals confidence and capital maturity.
Valuation may remain volatile if growth slows or activity weakens.
A successful transition could support a re-rating toward a diversified fintech profile.
The market may continue to treat Robinhood as a cyclical trading platform until revenue becomes less market-dependent.
In simple terms, the bull case rests on platform maturity, accessibility, and retention.
If Robinhood can deepen wallet share and retain users across more stages of their financial lives, these layers begin to reinforce one another. Robinhood may look less like a trading app reacting to market bursts and more like a consumer-finance platform with a wider role in capital allocation.
The bear case is that this broader menu still sits on top of an earnings base that remains highly sensitive to trading volumes, crypto activity, and retail sentiment. Until the newer layers contribute more meaningfully and more consistently, the market may remain reluctant to reward the company with a steadier valuation framework.
From here, investors are likely to watch three things closely:
whether asset growth leads to more stable revenue streams
whether newer products gain enough scale to reduce earnings dependence on trading
whether Robinhood can retain users as they become more sophisticated, rather than losing them to more traditional platforms
Robinhood’s Coming-of-Age
Robinhood looks more credible today than it did in its meme-stock era. Its product range is broader, its customer base is larger, and management is clearly trying to grow wallet share rather than rely only on trading activity.
But the transition is not complete. The business is still exposed to trading volumes, crypto cycles, market sentiment, and retail participation, which means the re-rating case still needs firmer proof. The challenge is no longer product expansion by itself. It is whether those newer products can gradually reduce Robinhood’s dependence on trading-driven revenue.
Robinhood’s next phase will be judged less by headlines and more by whether it can turn platform expansion into steadier earnings, deeper customer relationships, and a more durable role in how users manage money.
We equip traders with the tools, insights, and execution capabilities to navigate these transformative shifts, helping you position ahead of major market developments. Join today.
Click here for Refresher!
What is Robinhood trying to become? Robinhood is trying to evolve from a retail trading app into a broader consumer-finance platform with products across trading, cash management, credit, retirement, managed investing, and private-market access.
Why is Robinhood still considered cyclical? Robinhood is still considered cyclical because a significant part of its revenue depends on trading activity, crypto sentiment, retail risk appetite, and overall market conditions.
Why does Robinhood’s buyback matter? The $1.5 billion buyback signals management confidence in the company’s capital position and long-term value, although it does not remove concerns about earnings volatility.
What is the bull case for Robinhood stock? The bull case is that Robinhood can grow wallet share, deepen product usage, and eventually be valued more like a diversified fintech platform rather than a trading-led business.
What is the bear case for Robinhood stock? The bear case is that Robinhood’s earnings remain heavily exposed to trading cycles, crypto activity, and market sentiment, which could keep the stock volatile if growth slows or activity declines.
Start trading now – Click here to create your real VT Markets account