The UK core consumer price index rose by 3.2% year on year in February. This was above the forecast of 3.1%.
The data point suggests core inflation remained elevated compared with expectations. The release compares February’s outcome with market forecasts for the same period.
Implications For Bank Of England Policy
The February core inflation figure coming in at 3.2% is a surprise we must react to. This stickier-than-expected inflation challenges the view that the Bank of England could start cutting rates by summer. As a result, market expectations are now shifting towards a “higher for longer” interest rate environment.
We should consider positioning for sustained higher rates through interest rate derivatives. The UK 2-year gilt yield, which is highly sensitive to monetary policy, has already surged 15 basis points to 4.75% this morning on the back of this data. Shorting Sterling Overnight Index Average (SONIA) futures for the late summer contracts could be a direct way to play this delay in expected rate cuts.
This hawkish shift makes the pound more attractive, and we are already seeing Sterling strengthen to $1.2850 against the dollar. Looking back from 2025, we saw similar currency jolts in 2024 whenever inflation data missed forecasts, suggesting this trend could have legs. Traders should look at options strategies that benefit from a stronger pound, such as buying GBP/USD call options.
For equities, sustained high borrowing costs are a headwind, and the FTSE 100 is already reflecting this pressure in early trading. We should anticipate further downside or at least a cap on gains for UK stocks in the coming weeks. Buying put options on the FTSE 250, which is more sensitive to the domestic economy, offers a way to hedge or speculate on this outlook.
The UK Consumer Price Index (CPI) rose by 0.4% month on month in February. This matched the forecast of 0.4%.
The figure describes the change in consumer prices from January to February. It provides a monthly measure of inflation in the UK.
Market Reaction And Pricing In
The February consumer price inflation data came in at 0.4%, which was exactly what the market was anticipating. This lack of a surprise means we should not expect any immediate, sharp moves in the market based on this news alone. The predictability suggests that current asset prices, from gilts to FTSE futures, have already factored in this level of inflation.
This data reinforces the view that the Bank of England will remain on hold, as the annual inflation rate is still tracking at 3.8%, almost double the official 2% target. We remember how markets in 2025 repeatedly tried to price in early rate cuts, only to be disappointed by the Bank’s firm stance against persistent inflation. This current data gives rate-setters no reason to change their hawkish tone in the coming weeks.
With the Bank’s path looking steady, implied volatility on UK assets will likely remain suppressed. This environment could favour strategies like selling short-dated options on the FTSE 100 to collect premium, as sudden price swings are less probable. However, we must be mindful that the UK’s services inflation component remains stubbornly high, recently reported at over 5.5%, which poses a key upside risk.
For interest rate traders, the SONIA futures curve is pricing in a first rate cut by late Q3 2026. Given the sticky nature of the inflation we’re seeing, this timeline may still be too optimistic. We see an opportunity in positioning for a “higher for longer” scenario, where rate cuts are pushed back into the fourth quarter.
This interest rate outlook should continue to support the pound sterling against currencies with a more dovish central bank policy. The GBP/USD exchange rate has been stable, holding a range between 1.2600 and 1.2850 for most of this year so far. Selling out-of-the-money GBP puts could be a viable strategy to capitalize on this stability and the favourable interest rate differential.
The UK Retail Price Index (month-on-month) was 0.4% in February. This was below the forecast of 0.5%.
The result was 0.1 percentage points lower than expected. It indicates a slower monthly rise in the RPI measure for that month.
Implications For Inflation And Rates
The February RPI figure coming in slightly below expectations at 0.4% signals a potential cooling of inflationary pressures. This data point reinforces the view that the Bank of England may have more room to maneuver on interest rates. We should now price in a slightly higher probability of a rate cut before the end of the third quarter.
This soft RPI number follows last month’s CPI data which held at 2.8%, still above the target but showing a clear disinflationary trend. With recent GDP growth figures for the last quarter of 2025 coming in at a sluggish 0.2%, the case for the Bank of England to pivot towards supporting the economy is growing stronger. The Bank is likely weighing this against persistent wage growth, which is still running near 4%.
In response, we are seeing the short end of the yield curve adjust, with traders now looking to position for lower short-term rates. This could involve receiving fixed on interest rate swaps maturing in the next one to two years. Gilt futures, particularly for short-dated bonds, are likely to see increased buying interest.
The prospect of earlier rate cuts puts downward pressure on the pound, as we saw during the policy pivot back in late 2024 when similar data emerged. Consequently, holding short positions on GBP against the dollar or euro is becoming an attractive strategy. We might consider buying puts on GBP/USD to speculate on a further decline towards the 1.22 level seen last autumn.
Positioning Ahead Of The May Meeting
All eyes will now be on the next Monetary Policy Committee meeting in May for any change in tone from the Governor. We anticipate implied volatility on short-term SONIA options will likely rise heading into that announcement. Traders should be prepared for this shift and consider strategies that benefit from it.
Create your live VT Markets account and start trading now.
Start trading now – Click here to create your real VT Markets account
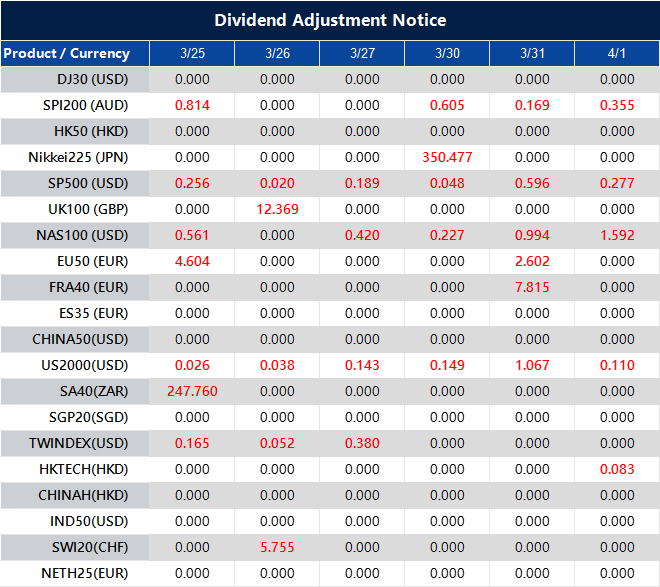
Please note that the dividends of the following products will be adjusted accordingly. Index dividends will be executed separately through a balance statement directly to your trading account, and the comment will be in the following format “Div & Product Name & Net Volume”.
Please refer to the table below for more details:
The above data is for reference only, please refer to the MT4/MT5 software for specific data.
If you’d like more information, please don’t hesitate to contact [email protected].
ING economists Peter Virovacz and Zoltán Homolya report that the National Bank of Hungary kept its base rate at 6.25% on 24 March 2026. They say the bank moved to a more hawkish stance after the war in the Middle East and related market turmoil.
They state that headline inflation reached a ten-year low in February, leaving Hungary in a favourable starting position for an external price shock. Under their base case for energy prices, they expect a brief rise in inflation before it settles at about 4% in the second half of the year.
National Bank Of Hungary Holds Rate
They put a 40% chance on their base case and say inflation would stay within the NBH tolerance band if energy effects fade. They also expect flows through the Strait of Hormuz to return to normal by the summer under this scenario.
On that path, they forecast room for a rate cut late in the third quarter, with the base rate at 6.00% by year-end. Under a “long war” scenario, which they assign a 30% chance, they expect the forint to need extra support and the NBH to match the ECB with two rate rises over the next couple of quarters.
The article was produced using an AI tool and checked by an editor.
The National Bank of Hungary’s decision to hold its base rate at 6.25% signals a shift to a more cautious stance due to the war in the Middle East. While this was expected, it puts a pause on the rate-cutting cycle we saw through 2025. This introduces significant uncertainty into the market for the coming weeks.
Market Focus Shifts To Risk
We are in a favourable position as February’s headline inflation print of 3.5% was a ten-year low, providing a cushion against the external price shock. However, the recent spike in Brent crude to over $110 a barrel explains the central bank’s new hawkish tone. The market is now weighing the impact of this energy shock against the backdrop of slowing domestic price pressures.
The forint has shown signs of stress, weakening past 405 against the euro last week, which brings back memories of the volatility seen in 2022. This currency weakness is likely the main reason for the central bank’s firm stance. We remember the lessons from that period, when energy shocks sent inflation soaring into double digits and forced aggressive policy tightening.
This divergence between a potential rate cut later this year and the risk of hikes creates a prime environment for volatility. Traders should consider buying options strategies, such as straddles on the EUR/HUF exchange rate, that would profit from a large price move in either direction. Implied volatility in forint options has already risen by 15% in the last two weeks, reflecting this uncertainty.
The forward rate agreement market is now pricing in roughly a 40% chance of a 25 basis point rate cut by the end of the third quarter, down from 70% just a month ago. This shows how traders are quickly reassessing the path of monetary policy. The key will be to watch energy markets and any news related to shipping through the Strait of Hormuz.
If we believe that tensions will ease by summer, positioning for a rate cut in late 2026 through interest rate swaps could be profitable. Conversely, if the conflict appears prolonged, the market may begin to price in rate hikes to support the forint. This would suggest paying fixed on short-term swaps to hedge against a more hawkish central bank.
Create your live VT Markets account and start trading now.
Start trading now – Click here to create your real VT Markets account
Gold (XAU/USD) gave back part of its rise to about $4,600, the week’s high, but stayed supported below $4,550 ahead of the European session. Price moves remain sensitive to Middle East news after a rebound from the 200-day SMA near $4,100, a four-month low.
Diplomatic efforts have been reported to set up a one-month ceasefire mechanism for US–Iran talks. US President Donald Trump delayed planned strikes on Iran’s energy infrastructure by five days and mentioned an Iranian “present” linked to energy flows through the Strait of Hormuz, which weighed on crude oil and eased inflation worries.
Geopolitical Risk And Market Reaction
Fighting continues, with Israel striking Iran and the US sending more forces, including thousands from the 82nd Airborne Division. Iran launched a new missile barrage at Israel, while Gulf states reported repeated drone and missile interceptions, alongside clashes in Lebanon and Iraq.
Markets have nearly fully ruled out further US Federal Reserve rate cuts and have increased pricing for a hike by year-end, supporting the US dollar. This could limit further gains in gold.
Technically, a move above the 100-hour SMA is watched, though price stalled near the 38.2% retracement from the March peak. MACD stays positive and RSI sits in the high 60s; above $4,600 opens $4,637 then the mid-$4,750 area, while support sits at $4,470 and $4,401, then $4,250–$4,300.
We remember the intense volatility in 2025 when gold prices swung between $4,100 and $4,600 due to the US-Iran conflict. Those geopolitical tensions created significant uncertainty, which we now see reflected in current market positioning. The situation has calmed since then, but the underlying risk remains a key factor in our analysis.
Inflation Fed Policy And Volatility
Given today’s date of March 25, 2026, the market is less focused on immediate conflict and more on inflation’s stubbornness. The latest February 2026 CPI report showed core inflation holding at 2.9%, keeping the Federal Reserve in a cautious stance. This economic reality means we should watch implied volatility on gold options, which has compressed significantly from last year’s highs but could expand rapidly on any new hawkish Fed commentary.
This environment suggests that selling options premium could be a viable strategy in the coming weeks. For instance, an iron condor with sold strikes around the old support of $4,400 and the prior resistance near $4,750 could capitalize on range-bound price action. This allows us to profit from time decay as long as gold doesn’t make a sharp, unexpected move.
However, we must also be prepared for a breakout, recalling how quickly the situation escalated in 2025. The Commitment of Traders (COT) report shows large speculators are still net long, though they have slightly reduced their positions since January 2026. A simple protective strategy would be to purchase long-dated, out-of-the-money call options as a hedge against a sudden flare-up in geopolitical risk or an unexpectedly high inflation print.
Looking back, the bounce from the 200-day moving average last year was a powerful signal that dip-buyers were active. That key level, now sitting closer to $4,350, remains a critical area of support to monitor. Any approach towards this level could be an opportunity to purchase call spreads, defining our risk while positioning for a potential rebound similar to the one we witnessed in 2025.
Create your live VT Markets account and start trading now.
Start trading now – Click here to create your real VT Markets account
USD/JPY edged up to about 159.00 in early European trading on Wednesday. The yen weakened against the US dollar as energy prices rose amid tensions in the Middle East.
Markets monitored developments linked to US-Iran talks. Donald Trump said on Tuesday that the US was making progress towards ending the war with Iran, and Reuters reported a 15-point US settlement proposal.
Talks And Escalation
The outlook for talks stayed uncertain after Iran’s Revolutionary Guards said on Wednesday that they fired missiles at Israel. They also said they hit military bases hosting US forces in Kuwait, Jordan and Bahrain.
Federal Reserve Governor Michael Barr said on Tuesday that rates may need to stay steady “for some time” before further cuts. He cited inflation remaining above the Fed’s 2% target and risks linked to the Middle East conflict.
Bank of Japan January minutes had a hawkish tone that could support the yen. Policymakers backed continued rate rises, with some calling for timely action due to inflation pressures and the weak yen’s effect on prices.
Looking back to early 2025, we saw the Japanese Yen weaken to 159 against the dollar despite the Bank of Japan’s hawkish stance. This was driven by geopolitical tensions in the Middle East and a Federal Reserve committed to holding rates steady. This created a classic tug-of-war between a safe-haven dollar and a central bank trying to strengthen its own currency.
Market Implications And Positioning
That dynamic has pushed USD/JPY even higher over the past year, with the pair now trading near 162.50 as of March 2026. The BoJ did follow through on its promises, raising rates twice in late 2025 as Japan’s core inflation briefly touched 2.8%, but the ongoing conflict and elevated energy prices have kept the dollar in demand. This sustained divergence means the market is stretched and sensitive to any change in narrative.
Given this tension, implied volatility in USD/JPY options is likely to remain elevated in the coming weeks. Traders should consider buying straddles or strangles to profit from a significant move in either direction, as a breakthrough in peace talks or a surprisingly aggressive BoJ statement could cause a sharp swing. Selling volatility in this environment carries significant risk of large, unexpected losses.
For those anticipating a reversal, buying JPY call options (or USD/JPY put options) offers a defined-risk way to position for yen strength. With the pair so high, a sudden de-escalation in the Middle East could quickly shift focus back to Japan’s interest rate path, making out-of-the-money puts with strike prices around 158 an attractive hedge. This strategy allows for participation in a potential yen rally while capping the maximum loss at the premium paid.
The interest rate differential that favored being long USD/JPY throughout 2025 is now narrowing due to the BoJ’s hikes. While holding long USD/JPY futures positions still earns a positive carry, the risk of a sharp correction has grown substantially. We believe traders should reduce exposure to this carry trade, as its profitability is now outweighed by the potential for a sudden and sharp unwind.
Create your live VT Markets account and start trading now.
Start trading now – Click here to create your real VT Markets account
USD/CHF rose 0.15% to about 0.7895 in Asian trading on Wednesday, as the US Dollar held firm amid Middle East conflict involving the US, Israel, and Iran. Support for the Dollar also came as Iran denied any direct talks with the US on ending the war.
The US Dollar Index was up 0.12% near 99.30, reflecting gains against six major currencies. Market mood improved after comments from US President Donald Trump that Tehran is keen to end the war, even as Iran rejected claims of direct discussions.
Market Risk Sentiment
S&P 500 futures climbed 0.6% in Asia after a small fall on Tuesday, pointing to a risk-on tone. Asian share markets were also higher at the time of writing.
In US data, the flash S&P Global PMI for March showed slower services activity, which pulled down the Composite PMI. This indicated softer momentum in parts of the US economy.
The Swiss Franc weakened against most major peers, with exceptions versus antipodean currencies. SNB Chairman Martin Schlegel said on Tuesday the SNB has increased readiness to intervene in foreign exchange markets to limit CHF strength, according to Reuters.
We recall that back in 2025, Middle East conflicts created a flight to safety that strongly benefited the US Dollar, pushing USD/CHF toward the 0.7900 level. During that time, the Swiss National Bank also signaled its readiness to weaken the franc, creating a clear upward pressure on the pair. This dynamic of geopolitical risk and central bank divergence is a key lesson from that period.
Central Bank Policy Divergence
Today, the situation has evolved but the core themes remain relevant for our strategy. The USD/CHF is trading much higher, currently around 0.9250, driven by a persistent interest rate differential that we have been watching. While the conflicts of 2025 have subsided, new tensions in the South China Sea are keeping the US Dollar supported as a primary safe haven.
The fundamental driver is the starkly different paths of the central banks. US inflation data from February 2026 came in at a sticky 2.8%, keeping the Federal Reserve from cutting rates, while Swiss inflation is just 1.2%, well below target. This policy divergence, with the Fed funds rate at 4.50% and the SNB’s at 1.25%, makes holding US Dollars far more attractive than Swiss Francs.
Given this outlook, buying USD/CHF call options appears to be a prudent strategy for the coming weeks. We should look at strikes around the 0.9400 level with expirations in late May or June to capture expected upward movement. This offers a defined-risk way to profit from the pair’s continued strength.
Implied volatility has ticked up slightly due to the geopolitical climate, making options a bit more expensive. An alternative for those willing to take on more direct risk would be selling out-of-the-money puts below the 0.9100 level. This strategy allows us to collect premium based on the view that the strong interest rate differential will prevent any significant downside.
For longer-term positions, using futures contracts to go long USD/CHF remains a viable approach. The significant positive carry, earned from the interest rate gap between the US and Switzerland, provides an additional return on top of any spot price appreciation. This makes holding a long position structurally profitable as long as the policy divergence continues.
Create your live VT Markets account and start trading now.
Start trading now – Click here to create your real VT Markets account
NZD/USD fell to about 0.5830 in Asian trading on Wednesday. The pair eased as demand rose for the US Dollar as a safe-haven asset during the Middle East conflict.
US President Donald Trump is seeking a deal with Iran to end hostilities. Iran said it would prefer talks with US Vice President JD Vance rather than Steve Witkoff or Jared Kushner, during ceasefire discussions.
Middle East Conflict Drives Safe Haven Demand
An Israeli official said it was unlikely Iran would accept US demands in new talks. Negotiations reportedly broke down on 28 February, alongside the start of US-Israeli military action against Iran.
The Reserve Bank of New Zealand’s Chief Economist, Paul Conway, said there is still slack in the economy. He said this will affect how strongly policy responds to inflation pressures linked to higher oil prices.
Fitch Ratings on Friday changed the outlook on New Zealand’s Long-Term Foreign-Currency Issuer Default Rating to negative from stable. It also affirmed the rating at ‘AA+’, citing risks from the Iran war and New Zealand’s reliance on energy imports.
We are seeing significant downward pressure on the NZD/USD, and traders should position for further weakness. The ongoing Middle East conflict is creating a classic flight-to-safety dynamic that benefits the US Dollar. Buying NZD/USD put options seems to be the most direct strategy to capitalize on this trend.
Strategy Outlook For NZD USD Puts
This market environment is very similar to what we saw in the first half of 2022 after the conflict in Ukraine began, which pushed the Dollar Index (DXY) from 96 to over 105 in just a few months. With market volatility gauges like the VIX now pushing above 25, a level not consistently seen since 2023, fear is clearly driving capital into the greenback. The diplomatic efforts involving Vice President JD Vance are a key variable, but any breakdown in those talks will likely accelerate USD buying.
On the other side of the pair, the New Zealand Dollar is struggling with its own domestic issues. The RBNZ’s statement about “lingering slack” suggests they will be much slower to react to oil-driven inflation than other central banks might be, weakening the Kiwi’s interest rate appeal. This dovish stance is amplified by the Fitch Ratings outlook cut last week, which may discourage foreign investment.
The war that started on February 28, 2026, has pushed Brent crude oil prices to over $110 a barrel, placing enormous strain on energy-importing nations like New Zealand. We saw last year, in 2025, how New Zealand’s current account deficit widened to 7.8% of GDP, a historically high level, making its currency particularly vulnerable during global shocks. This fundamental weakness reinforces the bearish case for the NZD.
Given these factors, we should consider buying puts with expiration dates in late April and May 2026. This allows time for the geopolitical situation to play out while capturing the current downward momentum. A reasonable initial target for the pair would be the lows seen in late 2022, around the 0.5600 handle.
In the immediate weeks ahead, we must closely monitor any headlines related to the US-Iran negotiations, as a surprise ceasefire agreement is the primary risk to this bearish position. We will also watch for weekly oil inventory data and any scheduled speeches from RBNZ officials. Any sign of a diplomatic breakthrough would be a signal to reduce short exposure.
Create your live VT Markets account and start trading now.
Start trading now – Click here to create your real VT Markets account
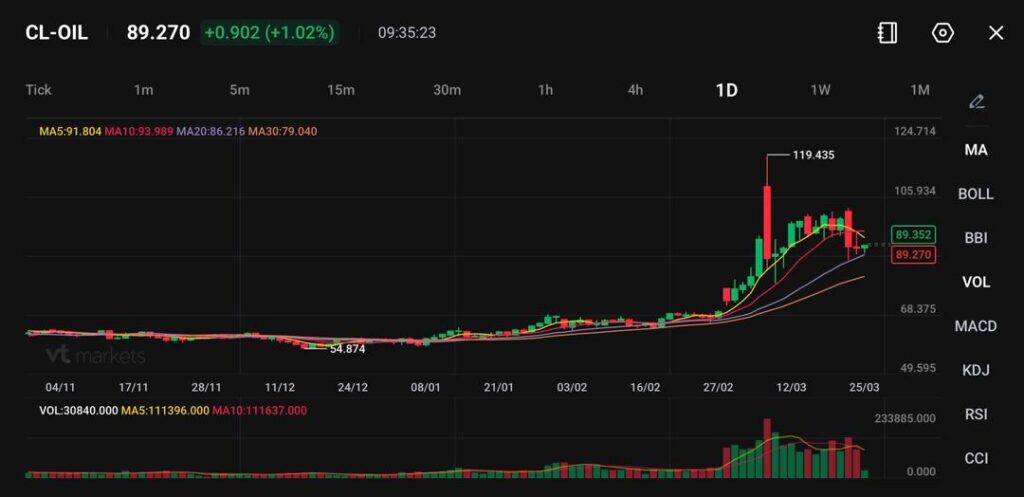
WTI trades near 89.27, up +0.902 (+1.02%), holding elevated levels after recent volatility.
Prolonged high oil prices may push central banks toward tighter policy, despite slowing growth risks.
Markets face a growing trade-off between inflation control and financial stability.
Oil prices are holding firm near elevated levels, with WTI crude trading around 89.27, up +1.02%, as markets continue to absorb the impact of persistent supply disruptions.
The recent price action suggests that oil is entering a consolidation phase after its sharp rally, but the broader structure remains supported by ongoing geopolitical risks and constrained supply.
The average cost for a gallon of diesel in California rose to the highest level ever as the state deals with limited oil-refining capacity and as the war in Iran disrupts global energy shipments https://t.co/tIIUsRHABL
Crucially, it is not just the level of oil prices that matters, but how long they remain elevated.
Sustained prices near current levels could keep upward pressure on inflation expectations and limit downside in oil.
High Oil Prices Complicate Central Bank Policy
The persistence of high energy prices is creating a complex environment for central banks.
According to market strategists, the longer oil remains elevated, the more policymakers may feel compelled to maintain a hawkish stance, even if economic growth begins to slow.
New Zealand’s central bank sees lingering slack in the economy that will shape how aggressively it responds to the inflationary aftershocks of higher oil prices https://t.co/DsqKr9y304
This dynamic is driven by the inflationary impact of energy costs. Higher oil prices feed directly into consumer prices, making it harder for central banks to justify easing policy.
However, tightening policy in response to supply-driven inflation carries risks.
Unlike demand-driven inflation, where tighter policy can effectively cool activity, supply shocks can lead to higher prices alongside weaker growth, creating a difficult policy trade-off.
Central banks may remain cautious, but a prolonged energy shock could delay rate cuts and tighten financial conditions further.
Growing Tension Between Price Stability and Growth
Markets are increasingly focused on the trade-off between controlling inflation and preserving financial stability.
Efforts to combat inflation through tighter monetary policy can increase borrowing costs, reduce liquidity, and amplify stress across financial markets.
This creates a feedback loop where geopolitical tensions drive oil prices higher, which in turn forces central banks into a more restrictive stance, adding pressure to the broader financial system.
Thailand has abandoned its price cap on diesel less than a month since the Middle East conflict broke out https://t.co/2kQomefQ2U
The result is a more fragile market environment, where both inflation and growth risks are elevated.
Financial Stress Risks Begin to Surface
Historical patterns suggest that policy tightening in response to supply shocks can lead to greater financial stress than tightening driven by strong demand.
This raises the risk of volatility across asset classes, including equities, bonds, and currencies, as markets adjust to a less supportive policy backdrop.
If oil prices remain elevated, financial conditions could tighten further, increasing the risk of broader market stress.
Technical Analysis
Crude Oil (CL-OIL) is trading near $89.27, up around 1.02%, showing a modest bounce after drifting lower from the recent spike toward $119.43. The move suggests buyers are attempting to defend the lower end of the current consolidation range, though momentum remains fragile.
Technically, oil is now sitting between key moving averages, signalling a transition phase. The 5-day MA (91.80) and 10-day MA (93.99) are positioned above price and trending lower, acting as near-term resistance. Meanwhile, the 20-day MA (86.21) and 30-day MA (79.04) remain upward sloping below price, indicating that the broader uptrend structure is still intact despite the pullback.
Key levels to watch:
Support:88–89 → 85 → 79
Resistance:91.80 → 94 → 100+
The $88–89 zone is proving to be an important support area. Holding this level keeps the market within a consolidation range rather than signalling a deeper reversal. A break below it could accelerate downside toward $85, where the 20-day average offers stronger structural support.
On the upside, price needs to reclaim $91.80–94 to regain short-term bullish momentum. A move back above this region would likely shift sentiment toward a retest of $100, though the $105–119 zone remains a major resistance band after the previous spike.
Overall, oil appears to be cooling after a sharp rally, with price action evolving into a range-bound consolidation. The broader trend remains constructive above $85, but short-term direction will hinge on whether buyers can push back above $92–94 or lose the $88 support floor.
What Traders Should Watch Next
Markets are now navigating a delicate balance between inflation and growth risks. Key factors to monitor include:
Duration of elevated oil prices
Central bank communication and policy outlook
Signs of financial stress across asset classes
Developments in global energy supply
For now, oil remains a central driver of macro conditions, with its sustained strength likely to shape both monetary policy and market behaviour in the near term.
Learn more about trading Energies on VT Markets here.
Refresher Questions
Why Are Oil Prices Still Elevated? Oil remains high due to ongoing supply disruptions and geopolitical tensions, particularly around key routes like the Strait of Hormuz.
Where is Oil Trading Right Now? WTI crude is trading near 89.27, up +1.02%, holding elevated levels after recent volatility.
Why Do High Oil Prices Matter for Central Banks? Higher oil prices increase inflation, which can force central banks to keep interest rates elevated or delay rate cuts.
What is the Link Between Oil and Inflation? Oil directly affects energy and transport costs, which feed into broader consumer prices, making it a key driver of inflation.
Why is Supply-Driven Inflation More Difficult to Manage? Supply-driven inflation is caused by shortages rather than demand, so raising interest rates does not fix the root issue and can slow growth.
What is the Risk of Central Banks Staying Hawkish? Prolonged tight policy can increase borrowing costs, reduce liquidity, and create stress in financial markets, especially if growth weakens.
Start trading now – Click here to create your real VT Markets account