Back

Silver trades near $82.20, supported by Iran tensions, while investors await February US employment data for direction

Silver traded near $82.20 in early Asian dealings on Friday. Support came from the ongoing US-Israeli campaign against Iran, which raised demand for safe-haven assets. Iran launched missile and drone strikes across the Gulf on Thursday, with attacks reported in the United Arab Emirates, Bahrain, Qatar, and Kuwait. US President Donald Trump said Iranian officials had contacted him about ending the war, while he said it was too late and that the US was seeking to destroy Iran. Iranian Foreign Minister Abbas Araghchi said Iran had not requested a ceasefire and did not plan to negotiate. The conflict has kept focus on assets such as Silver. Markets are also watching the US February employment report due later on Friday. Nonfarm Payrolls are forecast to rise by 59,000, while the Unemployment Rate is expected to stay at 4.3%. Stronger US labour figures could support the US Dollar and weigh on dollar-priced Silver. Silver prices can also be influenced by interest rates, the US Dollar, supply from mining and recycling, and demand from industry such as electronics and solar energy. Looking back a year to early March 2025, we see silver prices were elevated around $82, largely driven by the US-Iran war premium. Today, with the conflict having de-escalated following the November ceasefire agreement, that safe-haven bid has significantly unwound. The current price of around $46.50 reflects this more stable geopolitical environment. Our focus now is less on conflict and more on the US Federal Reserve’s path, which is guided by economic data. While we were anticipating a weak 59,000 job gain in February 2025, the latest report for February 2026 showed a much healthier addition of 155,000 jobs, keeping unemployment low at 4.1%. This labor market strength supports a firm US Dollar, which continues to act as a headwind for silver prices. Despite the pressure from a strong dollar, we must consider the industrial demand component. Reports from the International Energy Agency showed global solar panel installations grew by 15% in the last quarter of 2025, a trend expected to continue through 2026. This robust industrial consumption provides a solid floor of support for the price, preventing a more severe downturn. We are also closely watching the gold-to-silver ratio, which has widened significantly over the past year. Historically, a ratio above 85 has often signaled that silver is undervalued relative to gold, and today it sits near 90. For derivative traders, this suggests potential opportunities in relative value strategies, such as going long silver against a short position in gold.

Start trading now – Click here to create your real VT Markets account

Fuel Prices Explained: What Drives Petrol Costs Around the World

Key Takeaways

  • Global fuel prices are largely driven by crude oil markets, with benchmarks such as Brent and WTI setting the tone for petrol costs worldwide.
  • Geopolitical events, including supply disruptions and conflicts affecting key shipping routes, can trigger sudden price spikes.
  • Taxes, refining capacity, and currency strength can significantly influence what consumers ultimately pay at the pump.

Fuel Prices Explained: What Drives Petrol Costs Around the World

Fuel prices are among the most visible indicators of economic conditions. When petrol prices rise or fall, the effects ripple through transportation costs, consumer spending, and inflation.

Although drivers experience fuel prices locally at the pump, the forces behind them are global. Oil supply and demand, geopolitical tensions, refining capacity, government policy, and currency movements all combine to determine what consumers pay.

Understanding these dynamics helps explain why fuel prices can change rapidly and why they remain one of the most closely watched indicators in the global economy.

The Oil Market: The Foundation of Fuel Prices

At the centre of fuel pricing is crude oil, the raw commodity refined into petrol, diesel, and aviation fuel.

Global oil prices are typically measured against benchmark contracts such as Brent crude and West Texas Intermediate (WTI). These benchmarks act as reference points for oil traded across international markets.

When crude oil prices rise, fuel prices usually follow.

Oil prices move based on several core factors.

  • Supply decisions by major producers
    Groups such as the Organisation of the Petroleum Exporting Countries (OPEC) regularly adjust output levels to manage global supply.
  • Global energy demand
    Economic growth increases demand for transportation, shipping, and industrial activity.
  • Supply disruptions
    Extreme weather, infrastructure failures, or geopolitical conflicts can interrupt production or transport routes.

Strategic shipping routes also play a critical role. For example, the Strait of Hormuz handles roughly one fifth of the world’s oil shipments, making it one of the most important energy corridors in global trade.

Interested in trading Energies? Download the VT Markets app and monitor real-time CFD price action on Crude Oil (CL-OIL) and other energy-related charts.

The Fuel Price Formula

Fuel prices are not determined by crude oil alone. Several cost layers are added before petrol reaches the pump.

A simplified version of the fuel price structure looks like this:

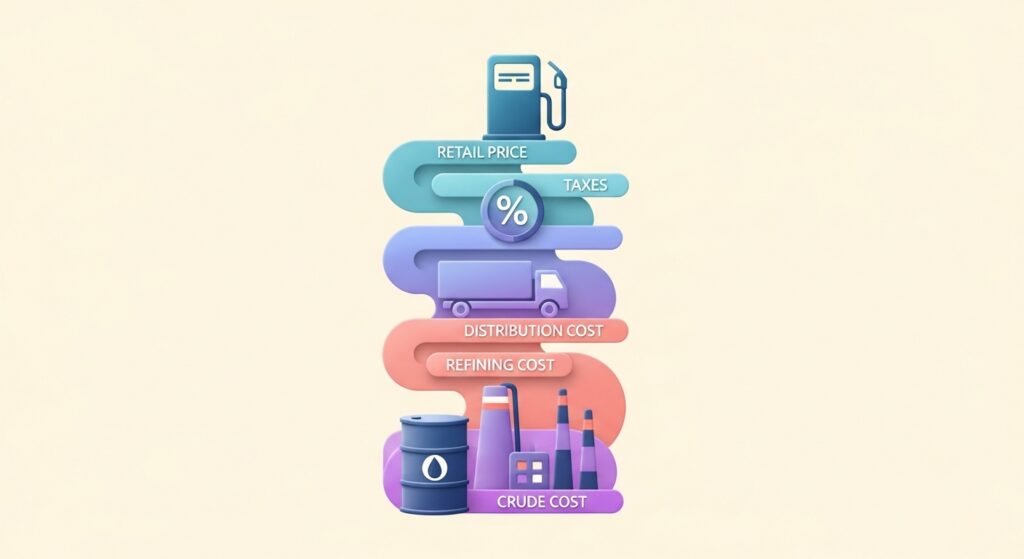
Fuel price = crude oil cost + refining cost + distribution + taxes + retail margin

Each component contributes to the final price drivers see.

  • Crude oil typically represents the largest share of the cost
  • Refining converts crude oil into petrol and diesel
  • Distribution and transport move fuel through pipelines, ships, and trucks
  • Taxes and duties can account for a significant portion of retail fuel prices in many countries
  • Retail margins cover operating costs for fuel stations

Because these components vary by country, petrol prices can differ significantly between regions even when crude oil prices are similar.

Geopolitics and Fuel Price Volatility

Energy markets are highly sensitive to geopolitical events.

Conflicts involving oil-producing nations, sanctions on exporters, or instability along shipping routes can restrict supply and push oil prices higher. Even the threat of disruption can trigger market volatility as traders anticipate shortages.

Recent years have demonstrated how quickly geopolitical tensions can affect fuel prices, particularly when major energy producers or transportation routes are involved.

For example, supply disruptions in the Middle East or production cuts by major exporters have historically led to sharp price movements in global oil markets.

Refining Capacity and Supply Chains

Once crude oil is extracted, it must be refined into usable fuels.

Refineries convert crude into products such as petrol, diesel, and jet fuel. When refining capacity becomes constrained, whether due to maintenance shutdowns, regulatory limits, or operational issues, the supply of refined fuels may tighten even if crude oil production remains stable.

Transport logistics also influence fuel prices. Shipping, pipelines, and trucking networks are required to move refined fuel from refineries to storage terminals and retail stations.

Any disruption within these supply chains can push prices higher.

For more market commentary, explore the latest Analysts’ report on oil markets on VT Markets.

The Role of Currency in Fuel Prices

Oil is traded globally in US dollars, meaning exchange rates can significantly influence fuel prices.

When the US dollar strengthens, countries importing oil must pay more in local currency terms. This can push fuel prices higher domestically even if global oil prices remain stable.

Conversely, when the dollar weakens, imported oil becomes cheaper for many countries, easing pressure on fuel prices.

Currency movements, therefore, play an important role in how global energy costs translate into local pump prices.

Fuel Prices and the Global Economy

Fuel prices influence far more than transportation costs.

Energy is a fundamental input for industries such as logistics, manufacturing, agriculture, and aviation. Rising fuel prices can increase operating costs for businesses, which may ultimately pass those costs on to consumers.

As a result, energy prices often feed directly into inflation data. This is why central banks and policymakers closely monitor oil and fuel markets.

For investors and traders, movements in oil and fuel prices can signal broader shifts in economic growth, supply chains, and geopolitical risk.

Fuel Prices in Today’s Market

In recent years, oil markets have experienced significant volatility due to shifting geopolitical conditions, production adjustments, and changes in global demand.

Brent crude, the international benchmark, has frequently traded between the range of $70 and $90 per barrel, while WTI crude has typically followed a similar trend at slightly lower levels.

Events such as production cuts by major exporters, supply disruptions, or geopolitical tensions can quickly push prices toward the higher end of this range.

Because crude oil remains the largest component of fuel costs, these market movements often translate directly into fluctuations at the pump.

Fuel prices reflect the intersection of global oil markets, geopolitical developments, refining capacity, taxation, and currency movements. While consumers experience these costs locally, the forces shaping them are overwhelmingly international.

As global energy demand evolves and geopolitical risks continue to influence supply chains, fuel prices will remain one of the most important indicators of economic conditions worldwide.

Create a live VT Markets account today to access our platform features, including market insights and educational content.

Fuel Prices Refresher

  1. Why do fuel prices change so often? Fuel prices fluctuate because oil markets react quickly to supply and demand changes. Geopolitical tensions, production decisions by major oil exporters, and shifts in global demand can all move prices rapidly.
  2. What is the biggest factor influencing fuel prices? The price of crude oil is typically the largest driver of fuel costs. When global oil prices rise, petrol prices generally increase as well.
  3. Why are fuel prices different in each country? Taxes, government policies, transportation costs, and currency exchange rates all influence fuel prices. These factors vary significantly between countries, leading to different petrol prices even when oil costs are similar.
  4. Why does a strong US dollar raise fuel prices? Oil is traded globally in US dollars. When the dollar strengthens, importing countries must spend more of their local currency to purchase the same amount of oil, which can increase domestic fuel prices.

Start trading now – Click here to create your real VT Markets account

Dividend Adjustment Notice – Mar 06 ,2026

Dear Client,

Please note that the dividends of the following products will be adjusted accordingly. Index dividends will be executed separately through a balance statement directly to your trading account, and the comment will be in the following format “Div & Product Name & Net Volume”.

Please refer to the table below for more details:

Dividend Adjustment Notice

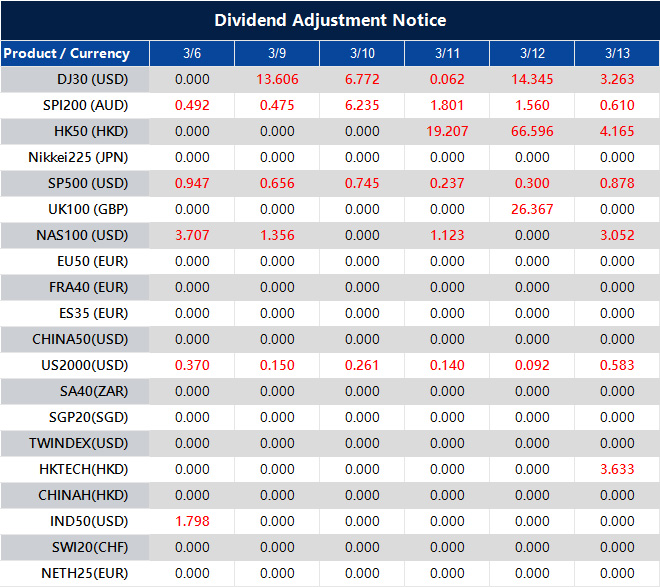
The above data is for reference only, please refer to the MT4/MT5 software for specific data.

If you’d like more information, please don’t hesitate to contact [email protected].

In February, Japan’s foreign reserves fell to $1 billion, compared with $1,394.8 billion previously

Japan’s foreign reserves stood at $1 billion in February. The previous figure was $1,394.8 billion. This shows a change of $1,393.8 billion from the prior level. The February level is far lower than the previous level.

Aggressive Currency Intervention Fallout

We are seeing the consequences of the aggressive currency interventions that defined late 2025 and the start of this year. This data indicates the Bank of Japan has exhausted its firepower in an attempt to defend the Yen. With reserves effectively at zero, the government has lost its primary tool to manage currency stability. The fight to keep USD/JPY from breaking critical resistance seems over, as the pair surged past 190 on the news. Last month’s online trade data showed interventions cost over $500 billion in January 2026 alone, a pace that was clearly unsustainable. Derivative traders should anticipate extreme volatility and prepare for a potential currency freefall, making long positions in USD/JPY calls a high-risk but logical play. This crisis has sent the Nikkei 225 index into a tailspin, dropping below 30,000 for the first time since 2023. A collapsing currency typically helps exporters, but the systemic financial risk is now overwhelming any of those benefits. We believe positioning through puts on the Nikkei index or related ETFs is the most direct way to hedge against further market decline. Confidence in Japanese sovereign debt is evaporating, with the 10-year JGB yield spiking to over 4% this morning, a level unseen in decades. This is reminiscent of the pressure seen during the Asian Financial Crisis of the late 1990s, where loss of faith in a country’s reserves led to soaring borrowing costs. Shorting JGB futures or using interest rate swaps to bet on yields rising further is a strategy gaining significant traction.

Long Volatility As The Core Trade

Overall, the primary trade is to be long volatility on all Japanese assets. The Nikkei Volatility Index is already up 200% year-to-date, reflecting deep uncertainty in the market. Using options strategies like straddles, which profit from large price moves in either direction, is advisable as the government’s next desperate move is completely unknown. Create your live VT Markets account and start trading now.

Start trading now – Click here to create your real VT Markets account

Burgum said Trump’s administration is considering measures to curb oil and petrol prices amid Iran war pressures

US Interior Secretary Doug Burgum said the US President Donald Trump administration is weighing options to address higher oil and petrol prices linked to the war in Iran, Bloomberg reported on Friday. Trump met Burgum and other senior advisers on Tuesday to review possible steps. Trump later announced plans to offer insurance guarantees and naval escorts to help oil tankers and other vessels travel safely through the Strait of Hormuz. The aim is to protect shipping routes used for oil transport.

Emergency Stockpile Release Option

Another option under discussion is releasing crude from the US emergency stockpile, possibly alongside other countries to increase the effect. Administration representatives have not yet taken action to use the Strategic Petroleum Reserve. Market prices rose after the developments. At the time of writing, West Texas Intermediate (WTI) was up 4.95% on the day at $78.30. Looking back at the events of 2025, we saw how quickly geopolitical fears surrounding Iran could push WTI crude to $78.30. That period highlighted the market’s sensitivity to supply disruptions in the Strait of Hormuz. The administration’s discussion of using the Strategic Petroleum Reserve (SPR) and naval escorts showed how government intervention was a key factor traders had to watch. As of today, the market dynamics have shifted, with WTI currently trading near $83.50 per barrel. Ongoing OPEC+ production cuts, which were extended through the second quarter, are keeping supply tight and supporting these higher prices. This contrasts with the sudden supply shock we analyzed from last year, suggesting a more structurally supported price level for now.

Strategic Petroleum Reserve Outlook

The Strategic Petroleum Reserve, which was considered for a release in 2025, is now in a different state. After significant drawdowns in previous years, the government has been slowly refilling the reserve, which now stands at just over 360 million barrels. This focus on refilling, rather than releasing, removes a key tool for taming prices and suggests the bar for intervention is much higher today. For derivative traders, this means elevated implied volatility will likely persist in the coming weeks. The continued attacks on shipping in the Red Sea add a consistent risk premium that wasn’t as prolonged last year. This environment makes strategies like selling out-of-the-money puts attractive to collect premium, assuming prices will find a floor due to the tight supply. The oil futures curve is in steep backwardation, where front-month contracts are priced significantly higher than later-dated ones. This indicates traders are paying a premium for immediate delivery amidst supply concerns. This structure supports plays like bull calendar spreads, where a trader might buy a near-term call option and sell a longer-dated one to profit from this sharp time decay. Furthermore, economic indicators suggest central banks may begin cutting interest rates later this year, which could stimulate economic activity and boost demand for oil. Traders should consider this potential demand increase when structuring positions, as it could provide further support for crude prices heading into the second half of the year. This makes longer-dated call options a potential hedge against a resurgent global economy. Create your live VT Markets account and start trading now.

Start trading now – Click here to create your real VT Markets account

Trump claimed Iranian officials sought negotiations to end the war, but he said America aims destroy Iran

US President Donald Trump said Iranian officials contacted him to seek an agreement to end the war. He said it was “too late” and that the US is pushing to destroy Iran. He said Iran asked, “how do we make a deal?” He said the US wants to fight now more than Iran does.

Gold And Oil Market Snapshot

Gold (XAU/USD) was 0.80% lower on the day at $5,093 at the time of writing. West Texas Intermediate (WTI) was up 4.57% at $78.00. Gold is widely used as a store of value and is often treated as a safe-haven asset during turbulent times. It is also used as a hedge against inflation and currency weakness because it does not rely on a single issuer or government. Central banks are the largest gold holders and may buy gold to diversify reserves. Central banks added 1,136 tonnes of gold worth about $70 billion in 2022, according to the World Gold Council, the highest yearly purchase since records began. Gold often moves inversely to the US Dollar and US Treasuries, and can also move against risk assets such as shares. Its price can react to geopolitical instability, recession fears, interest rates, and changes in the US Dollar.

Energy Supply Shock Risk

The escalation with Iran is making the oil market extremely tense, pushing WTI crude up to $78.00. We need to be positioned for further supply shocks, as any conflict threatens the Strait of Hormuz, through which about 21% of global petroleum liquids consumption passes. This makes long call options on energy stocks and oil futures the most direct play on this geopolitical risk. Despite the conflict, gold is surprisingly down, which points to a massive flight to safety in the US Dollar. When we saw similar events in the past, a surging dollar often puts a ceiling on gold, as the metal is priced in USD. Derivative plays should therefore focus on dollar strength, potentially through options on currency ETFs, as this appears to be the market’s primary safe haven right now. However, we should not ignore the underlying support for gold. We saw central banks buy a record 1,078 tonnes back in 2023, continuing the trend from 2022, and that buying has provided a strong floor. This dip could be a good opportunity to sell out-of-the-money puts on gold miners or XAU/USD itself, anticipating that central bank demand will limit the downside. The most certain outcome of this situation is a spike in market volatility. We saw the VIX, the market’s “fear gauge,” jump over 90% in the weeks surrounding the start of the Ukraine conflict in early 2022. Buying straddles or strangles on major indices is a pure volatility play that will profit from large market swings in either direction as this crisis unfolds. We must now watch inflation expectations very closely. The last major energy shock back in 2022 forced the Federal Reserve into an aggressive hiking cycle which ultimately impacted the market for years. A sustained oil price above $80 will put immense pressure on the Fed, and any hint of a hawkish response will further strengthen the dollar and weigh on assets like gold. Create your live VT Markets account and start trading now.

Start trading now – Click here to create your real VT Markets account

In early Asian trading, gold fell near $5,085 as the stronger US dollar awaited February jobs data

Gold fell to near $5,085 in early Asian trading on Friday. The move came as the US Dollar strengthened ahead of the US February employment report due later on Friday. Oil and gas prices rose amid Middle East conflict, raising inflation concerns. Traders reduced expectations of further Federal Reserve easing, which supported the Dollar and pressured dollar-priced gold.

Dollar Strength And Liquidity Shift

Market moves were also linked to the stronger Dollar and a shift towards liquidity. At the same time, Middle East tensions remained elevated after Iran launched missile and drone strikes across the Gulf on Thursday, with attacks reported in the United Arab Emirates, Bahrain, Qatar, and Kuwait. Iran’s Foreign Minister Abbas Araghchi said Tehran had not asked for a ceasefire and did not plan to negotiate. Iran’s Islamic Revolutionary Guard Corps said retaliatory attacks would intensify in the coming days. Gold is commonly used as a store of value and is often sought during market turbulence, inflation risks, or currency weakness. Central banks are the largest holders, adding 1,136 tonnes worth about $70 billion in 2022, the highest annual total on record. We are seeing gold dip to near $5,085, mainly because a strong US Dollar is putting pressure on it. The market is caught between this dollar strength and rising tensions in the Middle East. For traders, this conflict between opposing forces signals that significant price swings are likely in the coming weeks. Given this uncertainty, focusing on volatility is the most logical play. Options strategies like straddles or strangles, which profit from a large price move in either direction, should be considered. This allows us to benefit from the expected turbulence without betting on a specific outcome.

Fed Policy And Inflation Backdrop

The stronger dollar is a direct result of stubborn inflation, which prevents the Fed from easing policy. After we saw inflation metrics prove sticky through 2025, the latest CPI print for January 2026 came in at 4.5%, well above the Fed’s target. This data point solidifies the case for a stronger-for-longer dollar, capping gold’s upside for now. On the other hand, the geopolitical risk premium is rising and cannot be ignored. The situation with Iran mirrors the uncertainty we saw during the Red Sea shipping disruptions in late 2023 and early 2024, which caused sharp, albeit temporary, spikes in safe-haven assets. A serious escalation could easily overwhelm the strong dollar narrative and send gold soaring. This tension is reflected in broader market fear gauges, with the CBOE Volatility Index (VIX) now elevated at 22. We also know that central bank demand remains a supportive long-term factor, as the aggressive buying trend we tracked in 2022 and 2023 has continued through 2025. This provides a fundamental floor that could limit the depth of any sell-off. For those trading futures contracts, this environment demands careful position sizing and diligent risk management. The high probability of sharp reversals means traders should be prepared for increased margin requirements. Using options to hedge futures positions could be a prudent way to define risk in the coming weeks. Create your live VT Markets account and start trading now.

Start trading now – Click here to create your real VT Markets account

South Korea’s annual CPI growth reached 2%, undershooting the 2.1% forecast, as February figures showed

South Korea’s consumer price index rose 2.0% year on year in February. This was below the forecast of 2.1%. The February reading shows inflation slowed compared with expectations. The difference between the actual figure and the forecast was 0.1 percentage points.

Dovish Shift And Policy Implications

With February’s inflation coming in at 2.0%, below the 2.1% forecast, pressure on the Bank of Korea to maintain its restrictive stance has eased significantly. This surprise dip pushes the narrative firmly towards a dovish pivot, increasing the probability of a rate cut later this year. We must now adjust our positions to reflect a lower interest rate environment for longer. For equity derivatives, this is a clear bullish signal for the KOSPI 200. We should consider increasing long positions through index futures or buying call options, as lower borrowing costs typically boost corporate earnings and equity valuations. Given the index has been consolidating around the 2,850 level, this data could provide the catalyst for a breakout. This development will likely weigh on the Korean Won, as lower potential interest rates make the currency less attractive for yield-seeking investors. We should anticipate the USD/KRW exchange rate, currently near 1,360, to test higher levels. Positioning for this can be done by buying USD/KRW futures or call options. In the rates market, this data reinforces the case for lower bond yields. We should look at buying Korean Treasury Bond (KTB) futures, as their prices will rise if yields fall as expected. Looking back from our 2025 perspective, the aggressive rate hiking cycle we saw post-pandemic appears to be definitively over.

Cross Market Positioning Considerations

Considering the Bank of Korea has held its policy rate steady at 3.50% for over a year, this consistent undershooting of inflation targets gives it the justification to act. Global context matters, as the U.S. Federal Reserve is also expected to begin its easing cycle in the second half of the year. This alignment strengthens the case for a dovish BOK, suggesting these trends may persist in the coming months. Create your live VT Markets account and start trading now.

Start trading now – Click here to create your real VT Markets account

South Korea’s current account surplus fell to 13.26B, down from 18.7B in the prior month

South Korea recorded a current account surplus of 13.26B in January. This compares with a surplus of 18.7B in the previous period. The January current account surplus came in much lower at 13.26 billion compared to the strong 18.7 billion figure we saw in December 2025. This significant drop suggests that the flow of foreign currency into South Korea is slowing down. This is a bearish signal for the Korean Won (KRW). This weaker surplus aligns with recent data showing a slowdown in key export sectors. For instance, preliminary trade figures for February 2026 indicated semiconductor exports fell 4.5% year-over-year, their first decline in over a year. This confirms the cooling trend and suggests the January number was not an anomaly. Given this, we should consider strategies that benefit from a weaker Won in the coming weeks. Buying USD/KRW call options or selling KRW futures could be effective ways to position for further currency depreciation. The market is already reflecting this, with the USD/KRW exchange rate moving from around 1,310 to 1,345 over the past month. Slowing exports will also likely weigh on the KOSPI 200 index, which is heavy with major exporters. We could look at buying put options on KOSPI 200 futures or on ETFs tracking the index. This would provide a hedge against a potential equity market downturn driven by weakening global demand. We remember a similar export slump back in mid-2025, which preceded a nearly 10% correction in the KOSPI over the following two months. During that period, implied volatility rose sharply, making option-based hedges more expensive later on. It is better to position for that increase in volatility now. The Bank of Korea is also in a difficult position, adding to the uncertainty. With inflation still persistent at 2.9% as of February, they have limited ability to cut interest rates to support the economy. This policy deadlock could put further pressure on both the currency and equities.

Start trading now – Click here to create your real VT Markets account

South Korea’s monthly CPI increased 0.3%, missing the 0.4% forecast, as recent data revealed

South Korea’s consumer price index rose by 0.3% month on month in February. This was below the expected 0.4% increase.

Implications For Monetary Policy

The February inflation figure coming in below forecasts at 0.3% is a significant signal for us. This data eases pressure on the Bank of Korea, which has been holding its policy rate firm at 3.50% for well over a year. A softer inflation print increases the probability of an earlier-than-expected interest rate cut in the second half of the year. We should remember the persistent inflation that lingered around 3% for much of 2025, which kept the central bank on edge. This new, lower reading suggests that the disinflationary trend is gaining traction, a sharp contrast to the price pressures we faced previously. The central bank’s focus may now shift more towards supporting economic growth, especially with recent reports showing a slight slowdown in semiconductor exports in the last quarter. Given this outlook, we should anticipate a weaker Korean Won against the U.S. dollar. The potential for lower interest rates makes the Won less attractive to hold. Traders should consider buying call options on the USD/KRW pair, targeting a move from its current level of around 1,335 towards the 1,360-1,370 range seen in late 2025. This environment is bullish for government bonds, as expectations of rate cuts will push yields down and prices up. We should look at increasing long positions in Korea Treasury Bond (KTB) futures. The yield on the 3-year KTB has already dipped below 3.30% on this news, and we could see it test the 3.15% level in the coming weeks.

Equity Market Positioning

For equity markets, a more dovish central bank is a positive catalyst. Lower borrowing costs benefit companies, making equities more attractive. We can express this view by buying KOSPI 200 index call options or selling out-of-the-money put options to collect premium on the expectation of limited downside from here. Create your live VT Markets account and start trading now.

Start trading now – Click here to create your real VT Markets account

Back To Top
server

Hello there 👋

How can I help you?

Chat with our team instantly

Live Chat

Start a live conversation through...

  • Telegram
    hold On hold
  • Coming Soon...

Hello there 👋

How can I help you?

telegram

Scan the QR code with your smartphone to start a chat with us, or click here.

Don’t have the Telegram App or Desktop installed? Use Web Telegram instead.

QR code