E-Mini Dow Jones futures fell for several days ahead of triple witching. A possible short-term support area is 45,780, a pivot low from December 2025.
Pivot lows are points where price previously turned higher after testing support. When revisited, they can act as support again and may lead to a bounce.
Key Support Level At 45780
If 45,780 does not hold, the next support area is around 45,286. This level matches prior pivot highs that later acted as support, and it sits along a trendline marked by earlier pivot lows.
This sets up a resistance-turned-support pattern, where an old ceiling becomes a floor. The 45,286 area combines multiple technical reference points, which can attract buyers or prompt short covering.
Triple witching can increase volatility because options, futures, and index contracts expire at the same time. This can push prices more sharply in either direction around levels such as 45,780 and 45,286.
With the triple witching expiration now past, we see the market testing a critical support zone around 45,780. This level is important as it marks the pivot low from back in December 2025, a point where buyers previously stepped in with force. The recent pressure comes after February’s CPI report showed inflation at 3.4%, slightly above expectations and keeping the Federal Reserve on alert.
Strategy Considerations After Expiration
For derivative traders, this 45,780 level presents an opportunity to sell weekly put options with strikes around 45,500, collecting premium on the expectation of a short-term floor. This strategy benefits from both a price bounce and the elevated volatility, which we’ve seen tick up with the VIX climbing to 18.5 this past week. Alternatively, buying short-dated call options could be a lower-risk way to play for a quick rebound.
If sellers push the market through that first level, we are looking at 45,286 as a more significant area to add long exposure. This zone represents a classic case of prior resistance from late 2025 now acting as a support floor, reinforced by a rising trendline. The recent weak Philly Fed Manufacturing Index adds to the narrative that if the market drops this far, dip-buyers may see it as a better value proposition.
A test of 45,286 would justify a more aggressive stance, such as scaling into E-Mini Dow futures contracts or selling puts with further out expirations, like those for late April 2026. Historically, these confluent support zones have produced multi-week rallies, as we saw after similar sell-offs in the third quarter of 2025. This makes it a high-probability zone for a more sustained market bottom rather than just a temporary bounce.
Create your live VT Markets account and start trading now.
Start trading now – Click here to create your real VT Markets account
GBP/USD fell on Friday and traded near 1.3380 at the time of writing, down 0.39% on the day. The drop followed a strong rally on Thursday after the Bank of England decision.
The move lower came as the US Dollar regained some strength, despite wider markets being shaped by tighter pricing of global monetary policy. This led to a corrective pullback in the pair.
Bank Of England Holds Rate
The Bank of England left its policy rate unchanged at 3.75%, in line with expectations. However, the vote was unanimous at 9-0 to hold, compared with forecasts of a 7-2 split.
The latest decision contrasted with the previous close 5-4 outcome. The Bank said it could act if inflation stays persistent.
We remember that hawkish surprise from the Bank of England back in 2025, when the unanimous 9-0 vote to hold rates signaled a deep commitment to fighting inflation. That move caught many off guard and set a precedent for the bank’s cautious stance. This history reminds us that the BoE is willing to delay policy shifts until it is absolutely certain inflation is contained.
Fast forward to today, March 20, 2026, and we see GBP/USD trading near 1.2850 with a similar dynamic at play. UK inflation, while down from its peaks, remains sticky at 2.8% according to the latest ONS figures, which is still well above the BoE’s 2% target. This persistent inflation explains why the BoE is holding its main rate at 4.5% and is reluctant to signal the start of an easing cycle.
Trading Implications For Sterling
Given the discrepancy between market hopes for rate cuts and the BoE’s stubborn caution, volatility in the pound is likely to increase. Derivative traders should consider buying GBP/USD straddles or strangles with expirations in the next two to three months to profit from sharp price moves around upcoming inflation reports and BoE meetings. Futures markets are currently pricing in at least two rate cuts by the end of the year, a view that seems overly optimistic given the central bank’s commentary.
This contrasts with the situation in the United States, where core inflation has fallen more convincingly to 2.5%, giving the Federal Reserve a clearer path to begin easing policy. This policy divergence should provide a floor for the pound against the dollar, making limited-risk bullish strategies attractive. Therefore, positioning through GBP/USD bull call spreads could be a prudent way to capitalize on potential sterling strength if the BoE continues to hold rates longer than the Fed.
Create your live VT Markets account and start trading now.
Start trading now – Click here to create your real VT Markets account
USD/JPY traded near 158.70 on Friday, up 0.61% on the day, rebounding after a sharp fall on Thursday. The move followed a firmer US Dollar after recent volatility and a reassessment of US policy expectations.
The US Dollar was supported by pricing for a longer Federal Reserve pause. The Fed kept rates in the 3.50%–3.75% range, cited elevated uncertainty tied to geopolitical tensions, and fewer officials now expect rate cuts this year.
Federal Reserve Policy Outlook
CME FedWatch readings show markets largely expect rates to stay unchanged through year-end. The US Dollar Index (DXY) also rebounded towards 99.50.
Energy-market stress and Middle East tensions were linked to higher demand for liquidity, which supported the Dollar. Rising oil prices were also associated with further US Dollar support.
In Japan, the Bank of Japan maintained a hawkish stance, which limited pressure on the Yen. Governor Kazuo Ueda said a rate rise remains possible if any slowdown linked to Middle East tensions is temporary.
The BoJ also pointed to uncertainty around growth due to rising energy costs. Geopolitical tensions involving the US, Israel and Iran continued to drive risk aversion, which can support the Yen, though US policy expectations dominated in the near term.
Rate Differentials And Market Positioning
We are seeing the interest rate difference between the US and Japan dictating the direction of USD/JPY, pushing it toward the 159.00 level. The Federal Reserve’s commitment to holding rates firm is the main driver behind the dollar’s strength. This situation suggests that selling any dips in the pair remains a viable strategy for now.
The case for a strong dollar is supported by solid economic data, which we’ve seen consistently over the last year. For instance, the latest non-farm payrolls report for February 2026 showed a robust addition of 250,000 jobs, while core inflation is proving sticky at 3.1%, well above the Fed’s target. This economic resilience gives the Fed no reason to consider cutting rates, which should keep upward pressure on the pair.
On the other side, we must watch the Bank of Japan, which has been signaling a potential hike, a major shift since it ended negative interest rates back in early 2024. Japan’s own core inflation has been holding around 2.2%, giving the central bank justification to finally tighten its policy. This threat of intervention is what is likely preventing a more explosive move above 160.00, a level that triggered intervention in the past.
Given these opposing forces, options traders should consider strategies that benefit from rising volatility. The geopolitical uncertainty in the Middle East, combined with WTI crude oil prices holding firm around $92 a barrel, is creating an unpredictable environment. Buying straddles or strangles could be an effective way to play potential sharp moves in either direction over the next several weeks.
For those with a more patient outlook, the carry trade remains a primary strategy. Holding a long USD/JPY position allows traders to collect the positive swap, or rollover credit, from the wide interest rate gap between the Fed and the BoJ. This provides a steady income stream while waiting for the uptrend to resume.
Create your live VT Markets account and start trading now.
Start trading now – Click here to create your real VT Markets account
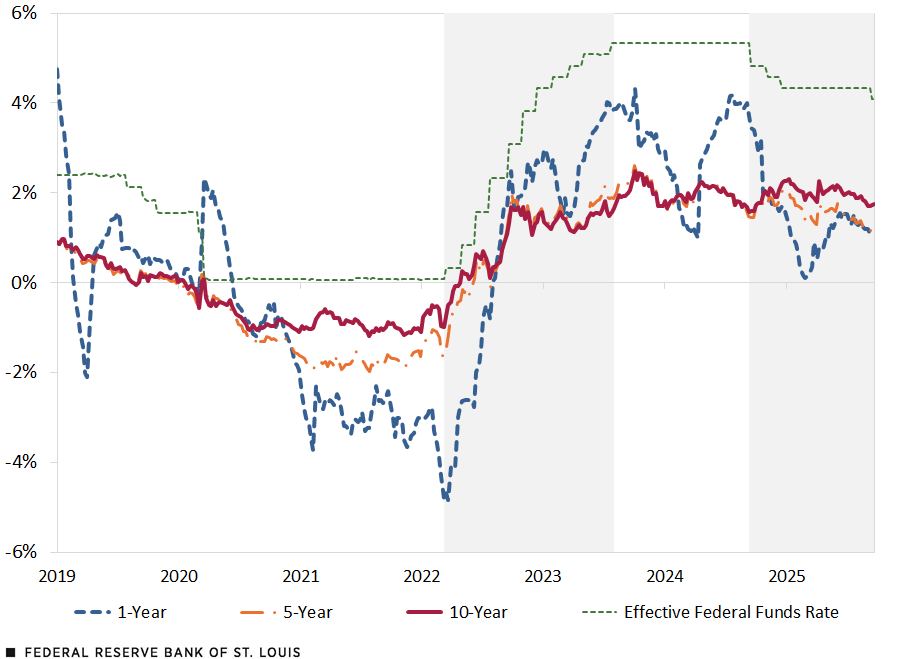
Mortgage rates are primarily driven by US Treasury yields, with the 10-year acting as the key benchmark rather than the Fed’s policy rate.
The Fed’s cautious stance on rate cuts in 2026, amid persistent inflation and energy-driven risks, is keeping long-term yields—and mortgage rates—elevated.
Mortgage rates serve as a leading indicator for financial conditions, influencing housing demand, consumer spending, and broader market sentiment.
The Fed does not set Mortgage Rates
Mortgage rates are often misunderstood as being directly controlled by the Federal Reserve. In practice, the relationship is indirect and mediated through financial markets.
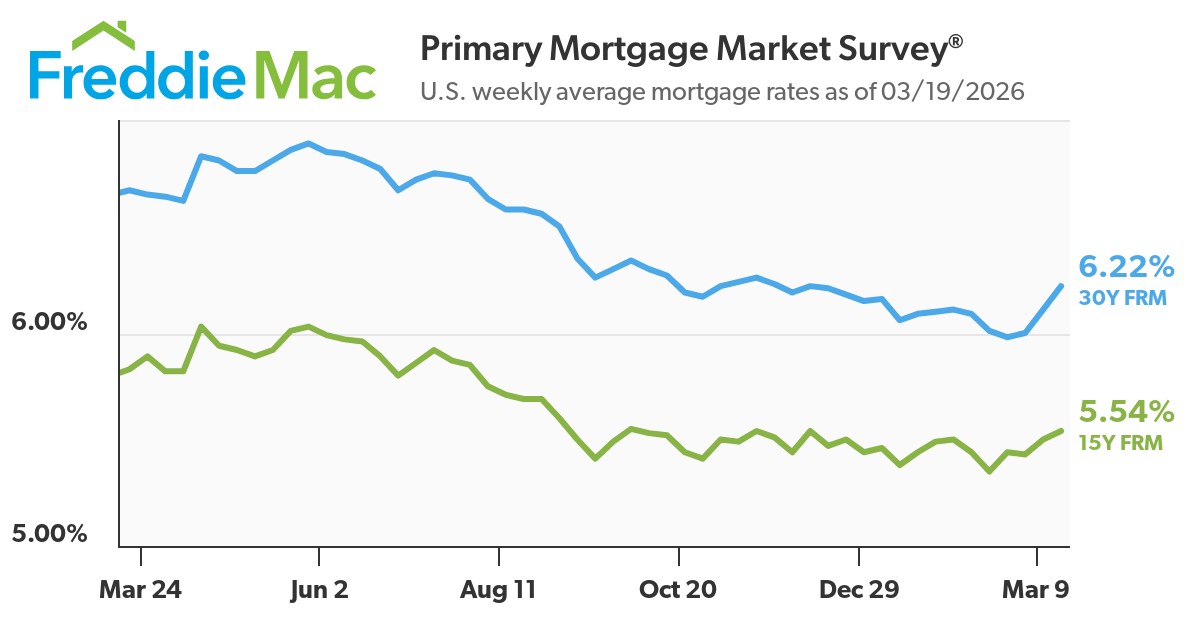
As of early 2026, the average US 30-year fixed mortgage rate has been hovering just above the 6% mark—rising to around 6.1% in mid-March after briefly dipping below 6% in February. This movement did not come from a change in the Fed’s policy rate, which remained on hold, but from shifts in bond yields and market expectations.
Mortgage rates rose for a third week, reaching a three-month high as wartime inflation fears drove up yields for the government bonds that guide home loans https://t.co/p7pXZwdBsL
For traders, this distinction matters. Mortgage rates are not a policy tool, they are a market-derived price of long-term capital, reflecting inflation expectations, growth outlook, and risk premia.
Term premium Investors demand compensation for holding long-duration bonds in uncertain environments.
Market volatility In unstable conditions, lenders widen spreads, increasing mortgage rates beyond what yields alone would suggest.
For traders, this makes the bond market the primary signal to watch. Read about how liquidity affects the movement of bond markets and geopolitical structure here.
Why the Fed Still Matters
The Federal Reserve might not set mortgage rates, but they definitely shape them.
The Fed anchors expectations around inflation, growth, and future policy. Those expectations feed directly into bond markets, particularly the US 10-year Treasury yield, which is the primary benchmark for mortgage pricing.
In 2026, the Fed’s stance has shifted markets away from aggressive easing and toward a more cautious outlook. That shift alone has been enough to keep borrowing costs elevated.
What the Fed is Signalling in 2026
Data-dependent rate cuts The Fed has made it clear that easing will depend on sustained progress in inflation, not forecasts alone.
Persistent inflation concerns Core inflation—especially in services—remains sticky, limiting the scope for rapid rate cuts.
Sensitivity to energy prices Rising oil prices and geopolitical risks are feeding into inflation expectations, keeping pressure on yields.
How This Feeds Into Mortgage Rates
Delayed rate-cut expectations Markets have repriced from multiple cuts to a slower path. This has kept the 10-year yield elevated around ~4.1%–4.3%.
Higher-for-longer narrative Even without hikes, the absence of cuts keeps financial conditions tight and borrowing costs elevated.
Quantitative tightening (QT) The Fed continues to shrink its balance sheet, reducing demand for Treasuries and mortgage-backed securities—pushing yields higher.
What the Data Shows
The US 10-year Treasury yield has remained above 4% in recent weeks
The 30-year fixed mortgage rate has rebounded to around ~6.1% in March, after dipping below 6% in February
The spread between yields and mortgage rates remains elevated, reflecting risk and market volatility
Why This Matters for Markets
Fed tone moves yields—even without action A hawkish shift in communication can push yields higher immediately.
Mortgage rates follow expectations, not decisions Markets price future policy, not current rates.
Housing becomes a transmission channel Higher mortgage rates tighten financial conditions, impacting consumption and growth.
Mortgage Rates as a Macro Signal
Mortgage rates act as a real-time indicator of financial conditions.
When rates rise:
Housing affordability deteriorates Monthly repayments increase significantly. A 1% rise in mortgage rates can increase monthly payments by hundreds of dollars on a standard loan.
Transaction volumes slow Existing home sales and mortgage applications tend to decline.
The “rate lock-in effect” intensifies Homeowners with sub-3% mortgages from prior years are reluctant to sell, tightening supply further.
When rates fall:
Refinancing activity picks up
Homebuyer demand improves
Housing-related sectors stabilise
For instance, earlier in 2026, when rates briefly dipped below 6%, pending home sales saw a modest rebound, highlighting how sensitive housing demand is to even small rate moves.
Sales of newly built homes in January dropped 17.6% month over month to a seasonally adjusted, annualized pace of 587,000 units, according to the U.S. Census Bureau. That is the slowest pace since 2022.
For traders, this links mortgage rates directly to:
consumer confidence
retail spending
cyclical equity sectors
What is Driving Mortgage Rates in 2026
Several macro forces are currently shaping mortgage rate dynamics:
Sticky core inflation Services inflation remains persistent, limiting the Fed’s ability to ease policy aggressively.
Energy market volatility Geopolitical tensions, particularly in the Middle East, have supported oil prices, feeding into inflation expectations and bond yields.
Repricing of Fed expectations Markets have shifted from expecting multiple cuts to a more gradual easing cycle, supporting higher yields.
Structural housing demand Despite higher borrowing costs, demographic demand and limited housing supply are preventing a sharp collapse in the market.
Elevated term premium Investors are demanding higher compensation for holding long-term debt amid fiscal uncertainty and large government issuance.
Together, these forces explain why mortgage rates have remained relatively elevated despite no new rate hikes.
What Traders Should Watch
To anticipate mortgage rate movements, traders should monitor a combination of macro and market indicators:
US 10-year Treasury yield (primary driver) Sustained moves above key levels (e.g., 4.2%–4.5%) typically lead to higher mortgage rates.
Inflation data (CPI, PCE) Upside surprises tend to push yields higher and delay rate cuts.
Federal Reserve communication Shifts in tone, particularly around inflation or labour markets, can quickly reprice expectations.
Housing data releases Mortgage applications, building permits, and home sales provide real-time demand signals.
Oil and energy prices Rising energy costs can feed into inflation expectations, indirectly lifting yields.
Bottom Line
Mortgage rates are best understood as a reflection of the bond market rather than a direct outcome of Federal Reserve policy.
In 2026, the combination of persistent inflation, cautious central bank messaging, and elevated term premiums keeps borrowing costs relatively high. For traders, mortgage rates offer a valuable lens into financial conditions: bridging policy expectations, consumer behaviour, and market sentiment.
Understanding this relationship is key to navigating both housing trends and broader macro-driven market moves.
Create a live VT Markets account today to access our platform features, including market insights and educational content.
Trader’s Takeaway
Do mortgage rates follow the Federal Reserve rate?
Not directly. Mortgage rates are more closely tied to long-term Treasury yields, though Fed policy influences those yields through expectations.
Why did mortgage rates rise even when the Fed paused?
Because bond yields increased due to inflation concerns and shifting expectations around future rate cuts.
What spread exists between Treasury yields and mortgage rates?
Typically between 150 and 300 basis points, depending on market conditions and risk factors.
Will mortgage rates fall if the Fed cuts rates?
Not necessarily. Mortgage rates will only decline meaningfully if long-term yields fall, which depends on inflation and growth expectations.
Start trading now – Click here to create your real VT Markets account
Canada’s New Housing Price Index fell by 2.1% year on year in February.
This compared with a 2.3% year-on-year fall in the previous reading.
Housing Market Finding A Floor
The February new housing price data shows the year-over-year decline slowing to -2.1%, an improvement from the previous reading. This is the clearest signal yet that the housing market correction we experienced through 2025 is finding a bottom. We should now position for a shift in Bank of Canada sentiment, as the pressure for further deep interest rate cuts will likely decrease.
This housing stabilization suggests that interest rate volatility may decline, with the central bank potentially holding its policy rate steady through the next quarter. We have seen futures markets already pull back on the odds of a May rate cut, a trend this data will reinforce. Therefore, we should consider strategies that benefit from a stable or slightly rising short-term yield environment.
For foreign exchange traders, a less dovish Bank of Canada strengthens the Canadian dollar, particularly against the US dollar. We can expect the CAD/USD pair to find renewed support, especially since it has been holding steady despite recent oil price weakness. Buying call options on the CAD for the second quarter appears to be a favorable risk-reward trade.
This data is a clear positive for Canadian financial and real estate equities, which have been under pressure. We should look at buying call options on the major Canadian banks and select residential REITs, as a stable housing market directly improves their earnings outlook. Implied volatility on these names has been relatively compressed, offering attractive entry points for bullish positions.
The fundamental support for a housing floor has been building, with Q4 2025 immigration figures from Statistics Canada showing population growth continuing to significantly outpace housing supply. We saw a similar pattern in the 2023 market, where slowing price declines were a leading indicator for a rally in housing-sensitive assets. This historical precedent suggests the current market is following a familiar recovery script.
Canada’s New Housing Price Index rose by 0.3% month on month in February. The forecast was a fall of 0.3%.
This is a 0.6 percentage point difference from expectations. The data point is reported as month-on-month.
This surprisingly strong housing number fundamentally challenges the view that the Bank of Canada will cut rates soon. We are seeing an immediate repricing in derivatives that track interest rate expectations, like the Canadian Overnight Repo Rate Average futures. Traders should anticipate that bets on a rate cut before the summer of 2026 will quickly be unwound.
This data should provide a strong tailwind for the Canadian dollar, especially against the US dollar. Looking back at 2025, we saw the CAD weaken as our economy showed signs of slowing faster than the U.S. Now, with swaps markets likely pricing out at least one full rate cut for this year, we should consider buying CAD call options or selling USD/CAD futures to position for a stronger loonie.
For the S&P/TSX 60 index, the path is less clear and warrants a more cautious options strategy. While a resilient economy is good for our banks and resource companies, the prospect of higher-for-longer interest rates will be a headwind for growth and real estate sectors. This is especially true given that Canadian household debt-to-income levels were already elevated above 175% at the end of 2025, making the economy very sensitive to borrowing costs.
Start trading now – Click here to create your real VT Markets account
Canada’s month-on-month retail sales rose by 1.1% in January. The forecast was 1.5%.
The result was 0.4 percentage points below expectations. It indicates retail sales growth was weaker than predicted for the month.
The January retail sales figure of 1.1% is a significant miss, showing that the Canadian consumer is tightening their spending more than we anticipated. This follows the weaker-than-expected housing start numbers we saw last month, painting a picture of a cooling economy. We should therefore adjust our strategies to account for a more sluggish economic environment in the coming months.
This data directly pressures the Canadian dollar, and we’ve already seen the loonie slip below 0.7200 against the US dollar this morning. A slowing domestic economy reduces the likelihood of any hawkish stance from the Bank of Canada. We should consider buying USD/CAD call options or CAD put options to position for further currency weakness.
The Bank of Canada’s path is now clearer, with the market pricing in a 50% chance of a rate cut by September, up from just 25% a month ago. This makes long positions in Canadian bond futures, such as the three-month BAX contracts, more appealing. We are essentially betting that the central bank will have to act to stimulate the economy sooner rather than later.
On the equity side, this consumer weakness is a direct threat to retailers and related sectors on the S&P/TSX Composite Index. The S&P/TSX Capped Consumer Discretionary Index is already lagging the broader market by 3% this quarter. Purchasing put options on this index or specific retail-focused ETFs provides a good hedge against potential earnings misses.
We saw a similar slowdown develop in the second half of 2025, where weakening consumer data preceded a period of increased market volatility. That experience suggests that even if the market doesn’t fall immediately, we can expect wider price swings. This makes it a good time to review our positions on implied volatility, perhaps by buying straddles on key indices.
Start trading now – Click here to create your real VT Markets account
Canada’s retail sales excluding motor vehicles rose by 0.8% month on month in January. The forecast was 1.2%.
The outcome was 0.4 percentage points below expectations. The report refers to the month-on-month change for January.
We see that the January retail sales miss was an early signal of a cooling consumer. This trend appears to be continuing, as February’s inflation data released last week also came in softer than expected at 2.6%. The most recent jobs report also showed the unemployment rate ticking up slightly to 6.2%, reinforcing this view of a slowing economy.
This data stream shifts our focus toward the Bank of Canada’s next move. The probability of an interest rate cut before the summer is now increasing, a change from the sentiment we held at the start of the year. Traders are looking at derivatives tied to the Bank of Canada’s overnight rate to position for a more dovish policy stance in the coming months.
Consequently, the Canadian dollar is facing headwinds. The prospect of lower interest rates relative to the U.S. has helped push the USD/CAD exchange rate above the 1.3700 level. We are considering buying call options on USD/CAD as a way to capitalize on potential further weakness in our currency.
This consumer slowdown is also a concern for Canadian stocks. We are cautious on the S&P/TSX 60, especially in consumer discretionary sectors. Buying protective put options on broad market index ETFs could be a prudent way to hedge against a potential downturn.
Looking back, we saw a similar pattern in the fall of 2025 when early signs of slowing growth emerged. Back then, implied volatility on currency options remained low before reacting sharply to central bank comments. This suggests that positioning for higher volatility in the Canadian dollar may be a worthwhile strategy now.
Start trading now – Click here to create your real VT Markets account
Canada’s Industrial Product Price Index rose 0.4% month on month in February. The forecast was for a 1.1% increase.
The outcome was 0.7 percentage points lower than expected. The figures compare the February reading with the previous month.
Implications For Inflation And Policy
This weaker-than-expected producer price number suggests inflationary pressures are cooling faster than anticipated. For us, this increases the probability that the Bank of Canada will cut interest rates sooner rather than later. This follows the latest Statistics Canada report showing annual Consumer Price Index (CPI) inflation eased to 2.8% last month, moving closer to the central bank’s target.
We should consider positioning for lower interest rates through derivatives like Bankers’ Acceptance futures (BAX). The market is currently pricing in a 50% chance of a rate cut by the June meeting, but this data could shift expectations toward the April meeting. Looking back at the slowdown in late 2025, we saw bond futures rally significantly as the market began to price in the end of the hiking cycle that began years earlier.
This outlook also implies weakness for the Canadian dollar, as lower interest rate expectations make the currency less attractive. We can express this view by buying put options on the CAD or call options on the USD/CAD pair. The US economy has shown more resilience, with its latest jobs report showing 190,000 new jobs, giving the Federal Reserve less reason to cut rates as aggressively as the Bank of Canada might.
For equity markets, the prospect of earlier rate cuts is a positive signal, potentially boosting indices like the S&P/TSX 60. Buying call options on the index or related ETFs could be a capital-efficient way to gain exposure to a potential rally. This scenario mirrors the market recovery we saw after the 2023-2024 tightening cycle, where sectors sensitive to interest rates led the rebound once a pivot was confirmed.
Given this single data point, we should also anticipate increased volatility around upcoming economic releases, particularly the next CPI report and the Bank of Canada’s meeting announcement. Using option spreads can be a prudent way to define our risk while speculating on these expected market moves. This is especially important as the last GDP report for the fourth quarter of 2025 showed growth of only 0.2%, indicating the economy is fragile.
Canada’s Raw Material Price Index rose by 0.6% in February.
This was below the forecast of 2.4%.
This morning’s Raw Material Price Index data was a significant miss, coming in far below what we and the market expected. This figure suggests that inflationary pressures at the start of the supply chain are cooling much faster than anticipated. We should view this as a leading indicator that the Bank of Canada’s tight monetary policy is having a strong effect.
This weak input price data follows January’s headline inflation rate, which was still stubbornly high at 2.8%. The new RMPI number is the first clear signal that a downturn in the Consumer Price Index could be coming in the months ahead. This fundamentally alters the outlook for the Bank of Canada’s next interest rate decision.
We believe the market will now begin pricing in a higher probability of a rate cut by mid-year, shifting expectations forward. Looking back at how markets behaved in 2025, we saw Canadian bond yields fall significantly in the weeks leading up to the Bank’s first policy pivot. Traders should consider positioning for lower yields through instruments like BAX futures or options on bond ETFs.
The implications for the Canadian dollar are directly negative, as interest rate differentials with the United States are set to widen. The U.S. Federal Reserve is dealing with more robust growth, with their latest jobs report showing over 215,000 positions added. This policy divergence should put downward pressure on the CAD, making bearish positions on the currency, perhaps through USD/CAD call options, an attractive strategy.
This economic signal is compounded by Canada’s slowing growth, with the last quarter of 2025 showing GDP grew at only a 0.9% annualized rate. A combination of weak growth and falling inflation gives the Bank of Canada a clear runway to begin easing its policy. Historically, the RMPI has led the CPI by two to three quarters, so this soft February number points toward a much cooler second half of the year.
Start trading now – Click here to create your real VT Markets account