South Korea’s gross domestic product (GDP) grew 1.6% year on year in the fourth quarter. This was below the forecast of 1.7%.
The outcome was 0.1 percentage points under expectations. The figures compare the fourth quarter with the same period a year earlier.
Implications For Markets
With the fourth quarter 2025 growth coming in softer than we anticipated, we should expect negative pressure on South Korean assets. This miss, even if small, signals a potential loss of economic momentum heading into the new year. Traders should therefore position for increased volatility and a generally bearish sentiment in the weeks ahead.
For the equity markets, we might consider buying put options on the KOSPI 200 index. This move protects against a potential downturn, similar to what we observed in early 2025 when a weak manufacturing report led to a 4% dip in the index over the following month. Current data shows foreign investors have already turned into net sellers, offloading over ₩2 trillion in Korean equities in the last week of February 2026, which could accelerate this trend.
In the currency market, this weak data suggests a weaker Korean Won. We should look at buying call options on the USD/KRW currency pair, betting on it moving higher from its current level around 1,360. Adding to this view, South Korea’s trade surplus recently narrowed by 15% in February 2026 compared to the previous month, indicating that export strength may be fading and providing less support for the won.
The Bank of Korea is now less likely to consider any interest rate hikes, a stance it held through all of 2025. This GDP report increases the odds that their next move could be a rate cut to stimulate the economy. This outlook makes receiving fixed rates on Korean interest rate swaps an attractive position, as we anticipate yields may fall.
Targeted Sector Strategies
We should also look at specific sectors that drive the Korean economy, particularly semiconductors and technology. Recent reports from February 2026 already show a 3% decline in global semiconductor prices, which could weigh on the earnings of major Korean exporters. Therefore, buying puts on individual large-cap tech stocks could be a more targeted way to express a bearish view on the economy.
Create your live VT Markets account and start trading now.
Start trading now – Click here to create your real VT Markets account
China’s February data suggest price falls may be easing. Consumer prices rose 1.3% year-on-year, with higher services and food prices supporting the increase.
Producer prices also moved up by 0.4% month-on-month. This points to producer prices potentially returning to year-on-year growth in the coming months.
Inflation Outlook And Policy Expectations
With inflation improving, expectations of major interest rate cuts by the People’s Bank of China have reduced. The outlook presented is for a slight CNY rise against the US dollar this year.
The piece states it was produced using an AI tool and reviewed by an editor. It is attributed to the FXStreet Insights Team, which compiles market observations and analyst commentary.
We are seeing growing signs that China is finally moving out of deflation. The latest data for February 2026 shows consumer prices rose 1.3% from a year ago, supported by higher costs for services and food. This trend gives us hope that positive inflation will be sustained in the coming months.
Further positive signals are coming from the factory gate, where producer prices also increased month-on-month. This builds on recent manufacturing surveys for February, which showed continued expansion above the 50-point mark for the second straight month. It appears the industrial sector is finding its footing after a prolonged period of weakness.
Trading Implications For The Yuan
This shift in inflation makes it much less likely that the People’s Bank of China will cut interest rates this year. Stable monetary policy in China contrasts with potential adjustments elsewhere, creating a supportive environment for the currency. We therefore continue to expect a slight appreciation of the CNY against the US dollar this year.
Looking back, we recall how much of 2025 was clouded by persistent deflationary pressures and weak domestic demand. The current price recovery marks a significant change from the economic narrative we were navigating last year. This new data suggests the stimulus measures from late 2025 may finally be taking hold.
For derivative traders, this outlook favors strategies that benefit from low volatility and a stable-to-stronger yuan. We should consider selling out-of-the-money put options on the USD/CNY pair. This position profits from time decay and the view that a major depreciation of the yuan is now off the table.
We must remain watchful, as this recovery is still in its early stages. Any unexpected weakness in upcoming economic data could quickly shift sentiment against the yuan. Therefore, we should keep our positions sized appropriately and use defined-risk option spreads to protect against any sharp reversals.
Create your live VT Markets account and start trading now.
Start trading now – Click here to create your real VT Markets account
US shares ended higher on Monday after trading lower earlier in the day, then turning up following comments from President Donald Trump. He told CBS News reporter Weijia Jiang that the war he launched with Israel against Iran is “very complete”.
The remarks spread online, and at about 3:20pm EST stocks rose sharply. After falling as much as 1.46%, the Nasdaq Composite closed up 1.38%, while the Dow Jones Industrial Average gained 0.5% and the S&P 500 rose 0.83%.
Markets Reverse After Trump Comments
Oil prices also moved quickly during the session. WTI crude fell 7.7% to below $84 a barrel after reaching a four-year high above $119 late Sunday night.
No official statement was cited indicating that Iran is ready to enter talks. The report also referred to earlier comments attributed to Iranian officials rejecting a ceasefire that would allow the US and Israel to regroup, and it claimed Iran has spent the past ten days disrupting radar systems used by Israel, the US, and Arab allies.
Looking back to late 2025, the sharp drop in implied volatility was the most immediate signal for traders. We remember the CBOE Volatility Index (VIX) falling from over 40 to the low 20s in a matter of days on those peace whispers. This suggests that in the coming weeks, selling expensive options premium, particularly far out-of-the-money puts on the S&P 500, could be a viable strategy if this calm holds.
The collapse in WTI crude from over $119 to below $84 was a clear reaction to de-escalation hopes. With oil now hovering in the low $80s and recent EIA data showing a surprise inventory build, bearish positions using put options or put spreads on crude futures seem prudent. However, any renewed conflict headline from the Strait of Hormuz could cause a violent reversal, making tight stop-losses essential.
Strategies For A Fragile Calm
That relief rally in the NASDAQ and S&P 500 was significant, but it was built on a single optimistic comment. Given that a formal ceasefire never fully materialized in the months that followed, we should consider this a fragile peace. Therefore, traders should look to protect long equity positions by buying protective puts or structuring collars on major indices like the SPX.
We must remember the market’s surge was based on a hint, not a confirmed treaty with Iran. This lingering uncertainty has been reflected in defense sector stocks, which have underperformed the broader market by about 5% since the start of 2026. This suggests that call options on consumer-focused ETFs could outperform puts on defense contractor ETFs if the geopolitical situation remains quiet.
Create your live VT Markets account and start trading now.
Start trading now – Click here to create your real VT Markets account
Gold slipped to around $5,130 per ounce on Tuesday as President Trump suggested the Middle East conflict could end soon.
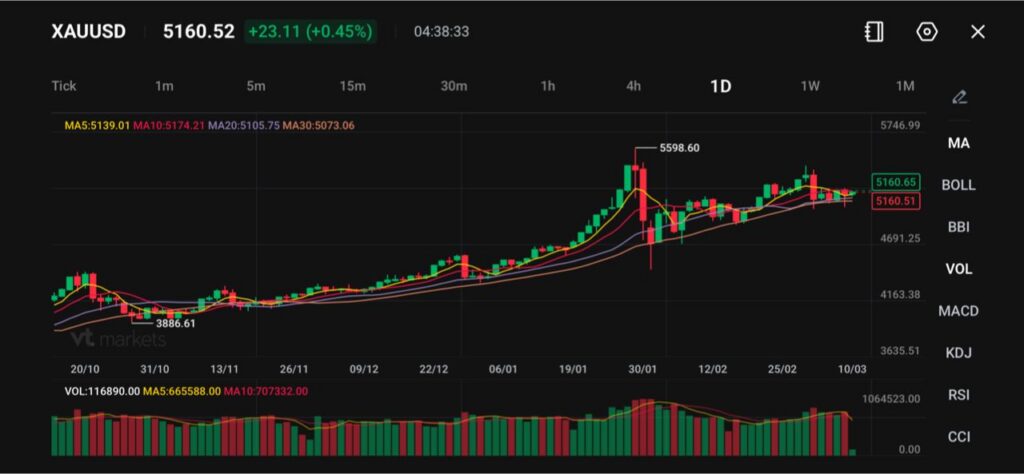
XAUUSD trades at 5160.52, up +23.11 (+0.45%), with MA5 5139.01, MA10 5174.21, MA20 5105.75, MA30 5073.06.
Markets now fixate on US inflation data with CPI on Wednesday and PCE on Friday, which can reshape Fed rate-cut pricing.
Gold slipped to around $5,130 per ounce on Tuesday, extending losses from the previous session, after President Trump signalled the Middle East conflict could end soon. Recent comments from the US President helped temper fear in broader commodity markets, which reduced the urgency to hold bullion purely for protection.
US President Trump described the war in the Middle East to Republican lawmakers as a ‘short-term excursion’ and said it would continue until Iran is defeated https://t.co/PObmuFthXBpic.twitter.com/XE6Z51duDP
Gold often rises hardest when markets fear a long disruption. When leaders hint at a shorter timeline, traders tend to take profit fast, especially if the US dollar stays firm and yields do not fall.
If headlines keep leaning toward de-escalation, gold may struggle to regain momentum and could keep rotating around the $5,130 area. If markets lose confidence in the “ending soon” narrative, bullion can regain support quickly because positioning has already lightened.
Higher Inflation Risk Still Limits Rate-Cut Hopes
Even as war-end talk cools, safe-haven demand, the inflation channel remains active. Traders have scaled back expectations for Federal Reserve rate cuts this year because higher energy prices can feed into inflation and keep policy tighter for longer. Our research desk has linked recent gold weakness to a stronger dollar and reduced optimism on near-term easing.
Federal Reserve Vice Chair for Supervision Michelle Bowman signaled the weaker-than-expected February employment report has tilted her back to supporting additional interest-rate cuts https://t.co/IGHnXlMYKU
This matters for gold because higher real yields raise the opportunity cost of holding a non-yielding asset. In this tape, gold can lose its “pure haven” role and start trading like a rates product.
If inflation expectations rise faster than growth worries, yields can stay sticky and gold may remain capped even during risk-off sessions. If growth fears rise and yields roll over, gold can recover even if geopolitics calms.
US CPI and PCE Can Reset the Fed Narrative
Traders now wait for US inflation data for fresh direction. The Bureau of Labor Statistics schedule shows February 2026 CPI releases on Mar. 11, 2026 at 08:30 AM, which lines up with the market focus on “Wednesday CPI”.
For PCE, the BEA lists the next release as March 13, 2026, matching the “Friday PCE” focus.
If CPI and PCE come in hot, markets can push back expected easing further. If they cool, traders may bring rate cuts forward again, which can weaken the dollar and help gold stabilise.
A stronger CPI or PCE print can pressure gold even if the Middle East risk fades, because rates can take over as the main driver. A softer set of prints can lift gold, but the move may stay choppy if oil remains volatile.
Technical Analysis
Gold (XAUUSD) is trading near 5,160, up roughly 0.45%, as the metal attempts to stabilise following the pullback from the recent high at 5,598.60.
The broader trend remains upward, but price action over the past few sessions suggests the market is entering a consolidation phase after the sharp rally earlier in the year.
Technically, gold continues to trade above its key moving averages. The 5-day moving average (5,139) and 10-day (5,174) are closely clustered around the current price, indicating a short-term balance between buyers and sellers.
Meanwhile, the 20-day moving average (5,105) and 30-day (5,073) remain below the market and continue to trend upward, reinforcing the longer-term bullish structure.
Immediate resistance is seen around 5,250–5,300, which has capped recent attempts to push higher. A break above this zone could bring the market back toward 5,400, followed by the previous peak near 5,600.
On the downside, initial support lies near 5,100, where the 20-day moving average is positioned, with stronger structural support closer to 5,000.
Overall, gold appears to be consolidating within an upward trend, with the market digesting earlier gains. As long as prices remain above the 5,100 support area, the broader bullish outlook remains intact, while a sustained move above 5,300 could signal a renewed push toward recent highs.
What to Watch Next in One Glance
Trump’s follow-up messaging after calling the operation a “little excursion” and “short-term”, because that steers the risk premium.
The US inflation run with CPI on Wednesday and PCE on Friday, because that can swing yields and the dollar.
Whether XAUUSD holds above MA20 5105.75 and MA30 5073.06, because that defines whether the current dip stays a consolidation or turns into a trend break
Why Did Gold Slip to Around $5,130 Per Ounce? Gold slipped to around $5,130 per ounce as traders reduced geopolitical hedges after President Trump suggested the Middle East conflict could end soon. When markets believe war risk may shorten, they often unwind “insurance” positions in gold.
How Can Gold Fall Even When Inflation Risk Still Exists? Gold can weaken when yields and the US dollar rise. Fears that a prolonged conflict could lift inflation have pushed traders to scale back expectations for Federal Reserve rate cuts. That can keep interest rates higher for longer, which increases the opportunity cost of holding gold.
What Did Trump Say That Moved Market Sentiment? Trump described the operation as a “little excursion” and a “short-term” endeavour, which eased some geopolitical concerns. That shift in tone can reduce safe-haven demand quickly, even before any real de-escalation occurs.
Is Gold Trading Geopolitics or US Interest Rates Right Now? Both matter, but the balance can shift day to day. When headlines point to a shorter conflict, gold tends to track rates and the dollar more closely. When escalation headlines return, gold often trades as a direct hedge again.
Why Do CPI and PCE Matter for Gold Prices? CPI and PCE influence expectations for Federal Reserve policy. If inflation data comes in hot, markets may expect fewer rate cuts, which can push yields up and pressure gold. If inflation data cools, markets can revive rate-cut bets, which can help gold recover.
What Should Traders Watch in CPI and PCE Specifically? Traders watch the surprise versus expectations and whether inflation pressures look broad-based. A strong print can reinforce the idea that the Fed will keep rates restrictive. A weaker print can support the case for easing and reduce support for the US dollar.
Start trading now – Click here to create your real VT Markets account
US President Donald Trump told NBC News on Monday that he did not want to discuss whether the United States should seize Iranian oil. He said it was too soon to talk about it, but added that “certainly people have talked about it”.
Asked whether Congress would approve a bill, Trump said: “I don’t know.” He also referred to a bill to tighten voting requirements, saying: “Nobody is doing much on it,” and “until they do, I’m not doing anything”.
Market Risk Premium Stays Elevated
In a separate phone interview with CBS, Trump said the Iran war could be over soon. He said: “I think the war is very complete, pretty much,” and added claims that Iran has “no navy, no communications” and “no Air Force”.
On Iran’s new Supreme leader Mojtaba Khamenei, Trump told CBS News: “I have no message for him.” Trump also told Al Arabiya that controlling Iran’s oil could strain US relations with China.
Looking back at the statements from 2025, the idea of seizing Iranian oil, even if just talk, established a new level of geopolitical risk for the market. That underlying threat has helped keep a floor under crude prices over the last year. As of this week in March 2026, with Brent crude hovering around $95 a barrel, that risk premium is still very much a factor in our daily trading.
The most direct impact for us is the elevated implied volatility in the oil markets. The CBOE Crude Oil Volatility Index (OVX) has been stubbornly high, trading near 45 for weeks, which is significantly above its five-year average of 35. This makes buying options for protection or speculation expensive, but it presents opportunities for those willing to sell volatility if they believe the situation will remain stable in the short term.
China Supply Shock Watch
We must also pay close attention to the mention of China, which has become even more relevant today. In early 2026, China is importing record amounts of sanctioned crude, and any US action that disrupts this flow would have an immediate and dramatic impact on global supply. Recent satellite data showing a 5% increase in China’s strategic petroleum reserves over the past quarter indicates they are actively hedging against this very possibility.
The assessment in 2025 that the war was “complete” has not translated into secure energy transit. We are still seeing commercial tanker traffic through the Strait of Hormuz down nearly 15% from pre-conflict levels, according to the latest maritime data. This lingering disruption suggests that any unexpected escalation could quickly send prices past the $100 mark, rewarding those with long positions in crude futures.
The comments about it being “too soon” and Congress not acting on any bills now appear to be part of a strategy of deliberate ambiguity. This lack of a clear policy direction is what continues to fuel uncertainty and prevents oil prices from falling significantly. For the coming weeks, we should treat any statements from Washington regarding Iran not as noise, but as the primary catalyst for the market’s next major move.
Create your live VT Markets account and start trading now.
Start trading now – Click here to create your real VT Markets account
Silver rose over 2% on Monday as the US Dollar gave back earlier gains. XAG/USD traded at $86.35 after rebounding from an intraday low of $79.65.
Price action remains within an $80.00 to $96.50 range. The Relative Strength Index (RSI) points upward, but momentum is described as fragile.
Resistance is at $90.00. A move above $90.00 would open $96.39, then $97.00, followed by $100.00 and the January 30 high at 118.47.
Support is at the 50-day Simple Moving Average (SMA) of $85.51. Below that, levels to watch include $79.66 and the March 3 low of $77.98.
Silver prices can shift with geopolitical risk, recession concerns, interest rates, and the US Dollar because silver is priced in dollars. Other drivers include demand, mining supply, and recycling flows.
Industrial use in electronics and solar energy can affect prices, supported by silver’s high electrical conductivity, above copper and gold. Economic conditions in the US, China, and India, plus jewellery demand in India, can also move prices.
Silver often tracks gold, and the gold/silver ratio is used to compare relative value. The ratio is the number of ounces of silver needed to match the value of one ounce of gold.
Silver is currently trading at $86.35 after a strong bounce, but we see it consolidating in a wide $80.00 to $96.50 range. While momentum appears bullish, it remains fragile, suggesting that any positions should be carefully managed. The market is hesitating, and we need to be ready for a move in either direction.
For those leaning bullish, a break above the $90.00 resistance level is the key trigger to watch. Call options with strike prices at $95 or even the psychological $100 level could offer significant leverage if this happens. We see this upside potential fueled by record industrial demand, which is on track to surpass 700 million ounces this year due to the accelerated build-out of solar and EV infrastructure we saw in 2025.
Conversely, if silver fails to hold its ground, the first critical support is the 50-day moving average at $85.51. A break below this could see a rapid move toward $80.00, making protective puts with an $84 strike price a prudent hedge for existing long positions. This weakness could be triggered by any surprise rebound in the U.S. Dollar, which has been the primary driver of this recent rally.
It’s worth noting that institutional sentiment supports the bulls, as recent data from the CFTC shows that managed money has increased its net long positions in silver futures by over 15% in the last month. Furthermore, the Gold/Silver ratio has tightened considerably since last year, falling from over 85:1 to near 70:1. This suggests silver continues to be undervalued relative to gold and has further room to catch up.
Given the clear consolidation range and fragile momentum, we believe volatility is mispriced. Traders who are uncertain of the direction but expect a breakout could consider long strangles, buying both an out-of-the-money call and an out-of-the-money put. This strategy would profit from a significant price move above $96.50 or below $80.00 in the coming weeks.
Start trading now – Click here to create your real VT Markets account
The US Dollar Index (DXY) fell about 0.20% on Monday after reaching a 15-week high near 99.70 early on. It opened with a gap up, then slipped back towards 99.00 by the close, following a rally from late-January lows near 95.56 of about four points in six weeks.
The US Dollar has risen amid the Strait of Hormuz crisis, with markets assessing the US as less exposed to the supply shock due to energy independence. Expectations for Federal Reserve cuts have shifted to one 25 basis-point cut this year, likely in September, down from two previously priced.
Fed Policy And Key Inflation Data
The Federal Reserve is holding rates at 3.50% to 3.75%, and January FOMC minutes said several officials discussed possible rate rises if inflation stays above target. February CPI data is due on Wednesday, with forecasts of 0.3% month-on-month and 2.4% year-on-year.
On Friday, January core PCE is expected at 0.4% month-on-month and 3% year-on-year. Preliminary fourth-quarter GDP is forecast at 1.4% annualised, and the University of Michigan March sentiment index is seen at 55, down from 56.6.
We recall the market dynamics of early 2025, when the Strait of Hormuz crisis pushed the US Dollar Index toward a 15-week high near 99.70. That sharp rally was fueled by safe-haven demand and a rapid repricing of Federal Reserve expectations. Today, the DXY is trading in a more subdued range around 103, as the geopolitical risk premium has faded.
Last year’s energy shock forced the Fed to hike rates through the summer of 2025 to fight the resulting inflation, which peaked at 4.2% according to Bureau of Labor Statistics data. Now, with the latest February 2026 CPI report showing inflation has cooled to 2.8% year-over-year, the market has shifted focus entirely. The Fed is holding its policy rate steady at 4.50-4.75%, and derivatives markets are now pricing in a 70% chance of a first rate cut by July.
Given this backdrop, traders should consider strategies that benefit from a stable-to-weaker dollar and falling interest rate volatility. Selling out-of-the-money call options on the DXY or buying puts could offer favorable risk-reward profiles. With the VIX trading near a 12-month low of 14.5, selling volatility through options on interest rate futures like the 3-Month SOFR contract may also be an attractive play.
Positioning For Rate Cuts
The economic calendar is now less about upside inflation surprises and more about signs of a slowdown, a stark contrast to the inflation panic of 2025. We’ve seen this in the final Q4 2025 GDP reading, which was revised down to a sluggish 0.8% annualized growth. All eyes will be on this month’s Non-Farm Payrolls report for further evidence of a cooling labor market that would give the Fed a green light to ease policy.
Therefore, positioning for lower interest rates appears to be the primary trade. Using options on Fed Funds futures to speculate on the timing and magnitude of rate cuts is a direct way to express this view. This is a significant pivot from early 2025, when the dominant strategy was hedging against persistent inflation and further Fed hawkishness.
Create your live VT Markets account and start trading now.
Start trading now – Click here to create your real VT Markets account
USD/JPY rose for a third day on Monday, up 0.07%, and was trading near 158.02. It earlier reached 158.90, with gains linked to demand for the US Dollar and expectations of a less dovish Federal Reserve.
Price action eased after nearing 159.00, an area associated with intervention concerns around 159.00–160.00. The Relative Strength Index points upwards and is close to overbought levels.
Key Resistance Levels
Initial resistance is at 159.00. A move above that level could increase the risk of a reversal if the pair enters the 159.00–160.00 zone.
On the downside, a fall below 157.97 would bring 156.45 into view. Further weakness would target the 50-day simple moving average at 156.15, then the 20 and 100-day SMAs at 155.49/51.
The yen’s value is influenced by Japan’s economic performance, Bank of Japan policy, bond-yield differences, and risk sentiment. The BoJ’s ultra-loose policy from 2013 to 2024 supported yen depreciation, while a gradual policy unwind in 2024 has offered some support and narrowed the 10-year US–Japan yield gap.
The US dollar continues to show strength against the yen, driven by a Federal Reserve that is signaling fewer rate cuts than we anticipated for 2026. US core inflation figures released last month for January came in at a stubborn 3.4%, reinforcing the idea that US rates will stay higher for longer. This keeps upward pressure on the dollar as its yield advantage remains attractive.
Intervention Risk Outlook
With USD/JPY now pushing past 161.00, the risk of direct intervention from Japanese authorities is extremely high. We remember the significant market moves after they stepped in during 2022, and the verbal warnings from the Ministry of Finance have become more frequent in recent weeks. This creates a tense standoff, as the fundamental reasons for a strong dollar clash with political pressure in Japan.
For traders looking to ride the upward trend, buying near-term USD/JPY call options with strikes around 162 could be a smart move. This strategy allows for participation in any further gains if the pair breaks higher. It crucially limits the downside risk to the premium paid, which is essential if a sudden intervention sends the pair tumbling.
On the other hand, the high probability of intervention makes buying puts a compelling strategy to profit from a sharp reversal. Looking back at 2025, we saw the US-Japan 10-year bond yield differential remain consistently wide, often above 400 basis points, which fueled the dollar’s rise. A surprise intervention would cause this to matter less in the short term, leading to a rapid strengthening of the yen.
Given the uncertainty, we expect implied volatility to increase significantly in the coming weeks. This environment makes long volatility strategies, such as purchasing a straddle, particularly interesting. Such a position would be profitable from a large price swing in either direction, whether from a breakout to new highs or a sharp pullback triggered by the Bank of Japan.
Create your live VT Markets account and start trading now.
Start trading now – Click here to create your real VT Markets account
USD/CAD pared earlier declines on Monday as a drop in oil prices weakened the Canadian Dollar, even while the US Dollar remained under pressure. The pair traded near 1.3584 after falling to about 1.3525.
Canada is a major oil exporter, so oil price moves often affect the currency and growth outlook. Scotiabank estimates a lasting oil shock could lift Canadian GDP by about 0.5% over the next year, based on a $10 per barrel rise in WTI.
Oil Prices And The Canadian Dollar
WTI opened with a gap higher amid disruption risks in the Strait of Hormuz, briefly reaching about $113 per barrel before falling back. It later traded near $91.40 per barrel.
The retreat followed reports that G7 countries are discussing a co-ordinated release of oil reserves via the International Energy Agency. Oil prices remain elevated, which can support Canada’s outlook but can also add to global inflation pressure.
The Bank of Canada is expected to keep policy steady while assessing energy-driven inflation risks. In the US, markets have reduced expectations for near-term rate cuts, with CME FedWatch showing a 35.3% chance of a 25 bp cut in June and 41.2% by July.
Focus shifts to Canada’s jobs data on Friday, US CPI on Wednesday, and US PCE inflation on Friday.
Rates And Volatility Outlook
Looking back at the situation in early 2025, we saw extreme volatility in oil, with WTI prices spiking to $113 per barrel before pulling back. As of today, March 10, 2026, the market has stabilized considerably, with WTI crude trading much lower, around $82 per barrel. This has removed a major source of support for the Canadian dollar that was present during the geopolitical tensions of last year.
Last year, we were anticipating the Federal Reserve to remain on hold while the Bank of Canada adopted a wait-and-see approach. Now, the narrative has shifted to the pace of monetary easing, as both central banks have begun to cut rates from their cycle highs. With recent US inflation data from February 2026 showing core CPI still stubbornly above 3%, the Fed may be forced to proceed more cautiously than the Bank of Canada.
This divergence in central bank policy creates opportunities in the options market for USD/CAD. Given that the pair has been trading in a relatively tight range, implied volatility has decreased, making long volatility strategies like straddles potentially underpriced. A surprise move from either central bank could cause a significant breakout, and options offer a defined-risk way to position for that.
The key factor for the coming weeks will be the interest rate differential between the US and Canada, which currently stands at 25 basis points in favor of the US dollar. We must closely watch the forward guidance from the upcoming central bank meetings for any change in tone regarding the future pace of cuts. Any indication that the Bank of Canada will cut rates more aggressively than the Fed will likely push USD/CAD higher.
Create your live VT Markets account and start trading now.
Start trading now – Click here to create your real VT Markets account
Gold trimmed earlier losses on Monday but stayed more than 1.50% below its open, trading at $5,090. Shipping disruption in the Strait of Hormuz pushed WTI up over 30% to near $113 a barrel, with reports also placing crude near $120.
Higher oil prices lifted the US Dollar and weighed on gold, as oil is priced in dollars. The dollar reached a near three-month high, last seen in late November 2025, while the US Dollar Index rose 0.26 to 99.11.
Geopolitical Tensions And Market Impact
Hostilities continued with Israel attacking central Iran and Beirut. The Strait of Hormuz remained shut, through which about a fifth of global oil is shipped.
Tehran named Mojtaba Khamenei as Supreme Leader Ayatollah on Sunday. The Financial Times reported that G7 finance ministers plan to discuss releasing petroleum from reserves.
Swaps markets priced 36 basis points of Federal Reserve rate cuts by end-2026, according to Prime Market Terminal. The New York Fed SCE showed one-year inflation expectations at 3% in February, down from 3.1% in January, with three- and five-year forecasts steady at 3%.
Upcoming US data includes jobs, housing, consumer inflation, and Core PCE. Technically, gold traded within $5,000–$5,194, with resistance near $5,200 and support at $5,050, $5,000, the 50-day SMA near $4,868, and $4,841.
Central banks added 1,136 tonnes of gold worth about $70 billion in 2022, the highest yearly purchase on record.
Trading Signals And Forward Views
The current market is being driven by a massive oil shock, not typical safe-haven flows. We are seeing the US Dollar strengthen significantly because oil is priced in dollars, and this strength is pushing gold prices down despite the geopolitical crisis. For now, traders should recognize that the dollar’s reaction to oil is the most important factor, overpowering gold’s traditional role.
Volatility in the crude oil market is the main play for the coming weeks. With West Texas Intermediate oil surging over 30%, options pricing shows implied volatility has reached levels not seen since the initial conflict escalations in 2022. The potential for a strategic petroleum release from G7 nations creates a two-sided risk, making strategies that profit from large price swings, like straddles, more logical than betting on one direction.
Gold is currently caught between a strong dollar pushing it down and geopolitical fear supporting it. The technical chart shows a clear range between $5,000 and the $5,200 resistance level, suggesting that range-bound strategies on derivatives could be effective. Open interest data shows a recent buildup in options contracts at these specific strike prices, indicating that many in the market are also positioning for this consolidation to continue.
We believe the US Dollar will continue to show strength, especially against the currencies of major oil-importing regions like Japan and the Eurozone. The Dollar Index (DXY) has already climbed over 2% this month, and historical precedents from past oil shocks, like those in the 1970s, show an initial flight to the dollar. Long dollar positions against the yen (USD/JPY) or euro (EUR/USD) could be a primary macro trade.
The Federal Reserve’s path is now highly uncertain, with swaps markets pricing out most of the rate cuts we had expected for 2026. The upcoming Core PCE inflation data is now the most critical economic release, as a high number could force the market to price in no cuts at all. This situation feels very similar to the persistent inflation we dealt with back in 2023, where bets on a Fed pivot were repeatedly proven wrong.
Overall market fear is elevated and should be monitored through the VIX index. The index has jumped above 25, a level we last saw during the banking system stress in early 2025, signaling widespread uncertainty. Using VIX options or futures can provide a direct hedge against a further escalation of the conflict in the Middle East or a larger economic fallout from sustained high energy prices.
Create your live VT Markets account and start trading now.
Start trading now – Click here to create your real VT Markets account