New Zealand electronic card retail sales rose by 1.5% year on year in February. This was up from 0.4% in the previous period.
The release time was 03/15/2026 21:45:04 GMT. The data covers February.
Consumer Demand Remains Resilient
This morning’s electronic card sales data for February shows a jump to 1.5% year-on-year, significantly up from the previous 0.4%. This suggests consumer demand in New Zealand is proving more resilient than many had anticipated. For us, this challenges the narrative that the Reserve Bank of New Zealand (RBNZ) would be in a hurry to cut interest rates.
Given that the RBNZ has held the Official Cash Rate at a restrictive 5.50% to combat inflation, this spending data will concern them. We saw quarterly inflation in the last part of 2025 print at 3.8%, still stubbornly above the central bank’s 1-3% target range. Stronger consumer activity will only add to these underlying price pressures in the economy.
In the coming weeks, we should consider positioning for a stronger New Zealand dollar. The market has been pricing in potential rate cuts for the second half of 2026, but this data makes that less likely. We can express this view by buying NZD/USD call options or selling out-of-the-money puts to gain upside exposure.
Looking back, we saw a similar situation in mid-2025 when a surprisingly strong jobs report caused a sharp repricing of rate expectations and a subsequent rally in the Kiwi dollar. That event showed how sensitive the currency is to data that contradicts the rate-cutting narrative. We should expect a similar dynamic to play out now.
This shift in outlook also impacts the interest rate markets directly. Derivatives tied to the Official Cash Rate, such as overnight index swaps, will need to be repriced to reflect a lower probability of easing. We should look to unwind positions that were betting on imminent cuts and consider trades that profit from rates staying higher for longer.
Volatility And Rates Repricing
Be aware that implied volatility on NZD options will likely increase. Recent business confidence surveys have been lukewarm, so this strong consumer data creates conflicting signals for the economy. This divergence points to a period of greater uncertainty and price swings.
Create your live VT Markets account and start trading now.
Start trading now – Click here to create your real VT Markets account
New Zealand’s electronic card retail sales rose by 1.4% month-on-month in February.
This followed a fall of 1.1% in the previous month.
Stronger Consumer Demand Signal
The recent jump in New Zealand’s electronic card sales, from a 1.1% decline to a 1.4% increase, is a significant bullish indicator for the economy. This data points to stronger consumer resilience than we had been anticipating for the first quarter of 2026. It directly challenges the narrative of a rapidly cooling economy that many had priced in.
This surprising consumer strength will likely force a re-evaluation of the Reserve Bank of New Zealand’s monetary policy path. We believe the market will quickly price out any remaining probability of an interest rate cut in the first half of the year. The central bank has less reason to ease policy if domestic demand is proving this robust.
To make this view more credible, we note that the latest quarterly inflation figures from Stats NZ showed headline CPI at 4.7%, which remains well above the RBNZ’s 1-3% target band. This persistent inflation, combined with renewed consumer spending, gives the central bank a decidedly hawkish tilt. This situation is reminiscent of the stubborn inflation we observed throughout much of 2025, a period where markets incorrectly anticipated rate cuts.
Looking back to 2025, we saw the NZD/AUD cross-rate climb significantly when Australian inflation cooled faster than New Zealand’s, creating a policy divergence. Historical data from that period shows the Kiwi dollar can outperform when our central bank is perceived as more hawkish than its peers. We may be seeing the beginning of a similar pattern now.
Therefore, we see value in positioning for a stronger New Zealand dollar in the coming weeks. We are considering buying NZD/USD call options to capture potential upside with defined risk. This strategy allows us to profit if the currency appreciates on the back of shifting interest rate expectations.
Rates Market Implications
For interest rate traders, this data suggests short-term yields are likely to rise as rate cut expectations evaporate. We should consider selling New Zealand 90-day bank bill futures. This position would profit as the market adjusts to the reality of higher-for-longer interest rates.
Create your live VT Markets account and start trading now.
Start trading now – Click here to create your real VT Markets account
New Zealand’s BusinessNZ Performance of Services Index (PSI) fell to 48.0 in February. It was 50.9 in the previous month.
A PSI reading below 50 indicates a contraction in service sector activity. A reading above 50 indicates expansion.
Services Contraction Signals Broader Weakness
The drop in the services index to 48 shows the New Zealand economy is contracting, a notable shift from the start of the year. This reading complicates things for the Reserve Bank, as we’re still seeing inflation running stubbornly high at 4.1% in the latest quarterly data. The central bank is now caught between its mandate to fight inflation and the need to support a weakening economy.
We believe the market will begin pricing in a higher probability of an Official Cash Rate cut later this year, despite the RBNZ’s firm stance. With the unemployment rate recently ticking up to 4.2%, the case for the RBNZ to hold rates steady at 5.5% is weakening by the day. This is a clear change from the narrative through much of 2025, when the debate was centered on the possibility of another hike.
This weaker economic outlook should put significant downward pressure on the New Zealand dollar in the coming weeks. We see a strong case for shorting the kiwi against the US dollar, as the US economy continues to show more resilience. Looking back at the 2020 downturn, the NZD has historically underperformed when the RBNZ pivots towards cutting interest rates.
The contraction in services, which represents over two-thirds of the economy, is a direct negative signal for corporate earnings and the NZX 50 index. We would consider buying put options on the index to protect against or speculate on a potential market decline. Companies exposed to domestic consumer spending will be particularly vulnerable to this slowdown.
Finally, the conflicting data of slowing growth alongside high inflation is a recipe for increased market volatility. This uncertainty surrounding the RBNZ’s next policy move creates opportunities for traders using options strategies. Positioning for larger price swings, rather than a specific direction, could be a prudent approach over the next few weeks.
US President Donald Trump called on allies on Saturday to help secure the Strait of Hormuz. The Wall Street Journal reported that the White House plans to announce that several countries have agreed to form a coalition to escort ships through the corridor.
In a Truth Social post, Trump said “many countries” affected by Iran’s attempted closure of the strait would send warships with the United States to keep it open and safe. He listed China, France, Japan, South Korea and the UK among countries he wanted to take part.
Coalition Talks And Escort Timing
The Wall Street Journal said talks are continuing about the timing of any operations. It reported that discussions include whether escorts would begin before or after hostilities end.
Iran’s media operations centre warned residents in Dubai and Doha of possible attacks in the coming hours, according to Iran Press TV. It claimed US military personnel are based in those locations.
With nearly a fifth of the world’s daily oil supply passing through the Strait of Hormuz, we must anticipate a sharp spike in crude prices. We should be looking at buying call options on WTI and Brent futures, as this provides upside exposure if the situation worsens. This strategy allows us to profit from rising prices while limiting our maximum loss to the premium paid for the options.
The escalating threats create significant market uncertainty, which means volatility is likely to rise. We should consider purchasing call options on the VIX, which historically moves opposite to the S&P 500 during periods of fear. We saw a similar dynamic during the flare-ups in 2019 and 2022, where even the threat of conflict sent volatility indexes soaring before any actual shots were fired.
Portfolio Hedges And Energy Upside
Higher energy costs act as a tax on the global economy and can hurt corporate profits, especially for transportation and industrial companies. To hedge our portfolios, we should consider buying put options on broad market indices like the SPY or specific sector ETFs like JETS for airlines. History shows that every US recession in the last 50 years, looking back from 2025, was preceded by a sharp increase in the price of oil.
At the same time, we should expect oil and gas producers to benefit directly from higher commodity prices. Buying call options on energy sector ETFs, such as the XLE, or on individual oil majors offers a direct way to profit from this specific trend. We remember how the energy sector was the market’s top performer during the last major price surge we saw back in 2024 and 2025.
However, we must also prepare for a sudden de-escalation, as a diplomatic breakthrough could cause oil prices to collapse just as quickly as they rose. Using option spreads, like bull call spreads on oil futures, can help manage this risk by capping both our potential gains and losses. This more defined approach protects us from a sharp reversal if the planned coalition successfully secures the waterway without incident.
Create your live VT Markets account and start trading now.
Start trading now – Click here to create your real VT Markets account
South Korea said it will communicate closely with the US on the matter and decide after a careful review, according to a statement from the presidential office on Sunday.
In Japan, Takayuki Kobayashi, policy chief of Prime Minister Sanae Takaichi’s ruling Liberal Democratic Party (LDP), said on NHK that the threshold is “extremely high” for sending Japanese navy ships to the region under existing Japanese laws.
Allies Weigh Response To Strait Of Hormuz Security
US President Donald Trump renewed calls on Saturday for allies to help secure the Strait of Hormuz in a post on Truth Social. He wrote that countries receiving oil through the strait “must take care of that passage”, adding that the US will help “A LOT”.
The report also said oil prices are expected to be impacted by developments around the Strait of Hormuz, as the US-Israel war on Iran escalates further.
Looking back at the events of 2025, we see the initial hesitation from South Korea and Japan created significant uncertainty in energy markets. The calls from the Trump administration to secure the Strait of Hormuz, amidst the escalating conflict, laid the groundwork for the volatility we are managing today. This initial reluctance forced the market to price in a higher risk premium for Mideast oil shipments.
That risk is now being realized, as Brent crude futures have climbed to $115 a barrel this week, their highest point in six months. We have seen recent data showing commercial shipping volume through the strait is down nearly 15% from this time last year, as war risk insurance premiums have quadrupled. This sustained disruption, which began with the conflict in 2025, continues to tighten global supply.
Positioning For Prolonged Energy Market Volatility
For traders, this means implied volatility in the energy sector will remain exceptionally high. The CBOE Crude Oil Volatility Index (OVX) is currently elevated at 58, suggesting markets are bracing for sharp price swings in the coming weeks. Therefore, strategies involving long volatility, such as buying straddles or strangles on major oil ETFs, should be strongly considered to capitalize on this instability.
The ripple effects are extending beyond crude oil itself. We should be looking at options on shipping and logistics companies, particularly those not heavily active in the Persian Gulf who may benefit from diverted routes. Conversely, bearish positions on airline stocks could be prudent, as new intelligence reports of Iranian naval drills near the strait last week will likely keep jet fuel costs stubbornly high.
We saw a similar pattern during the “Tanker War” of the 1980s, where targeted attacks on oil tankers in the strait caused prolonged price spikes and market anxiety. That historical precedent suggests this is not a short-term crisis but a sustained period of geopolitical risk. Traders should therefore structure their positions for a volatile environment that could persist for several more quarters.
Create your live VT Markets account and start trading now.
Start trading now – Click here to create your real VT Markets account
The Israel Defense Forces (IDF) said on X that it launched a wave of “extensive strikes” across western Iran. It said it was striking “infrastructure” linked to the Iranian regime, according to The Guardian.
The IDF also said Iran continued to launch missiles towards Israeli territory in recent hours. It said defence systems were intercepting the threat and told citizens to enter protective spaces.
Escalation And Regional Security
Iran’s Revolutionary Guard Corps (IRGC) said it would target Israeli Prime Minister Benjamin Netanyahu as the conflict with the US and Israel continues. “We will continue to pursue and kill him with full force,” it said on Sunday on its Sepah News website.
Iran also accused “the enemy” of using copycat drones to attack neighbouring countries and shift blame onto Tehran. This followed retaliatory strikes across the Middle East.
Ahead of the weekly market open on Monday, traders may move towards risk-off positioning. Oil and the US Dollar may attract fresh buying.
Given the renewed conflict and direct strikes, we anticipate a sharp increase in market volatility. The VIX index, a key measure of market fear, has already jumped 15% in overnight trading to over 21, a level not consistently seen since the regional banking stress we observed in early 2025. We are therefore considering buying call options on the VIX or put options on major indices like the S&P 500 to hedge against further downside.
Oil Dollar And Volatility Hedges
Oil markets are the most direct beneficiary of this instability, with Brent crude futures surging past $98 per barrel, the highest since last autumn. With over 20% of global oil passing near the conflict zone through the Strait of Hormuz, any disruption could send prices much higher. Consequently, buying May and June call options on crude oil futures (WTI or Brent) or on energy sector ETFs like XLE appears to be a primary strategy.
This situation is a classic risk-off trigger, which typically strengthens the U.S. dollar as a safe-haven asset. The U.S. Dollar Index (DXY) has already broken through the 106 level, its strongest point this year, as capital seeks security. This makes long positions in USD futures or call options on currency ETFs an attractive play against more risk-exposed currencies.
Looking back at the market reactions during the initial flare-up in late 2025, the initial shock was followed by a period of intense uncertainty that punished risk assets for several weeks. However, the current direct strikes on Iranian territory, rather than on proxy forces, represent a significant escalation that markets have not fully priced in. This suggests the current defensive posturing may need to be held longer than it was back then.
Beyond broad market hedges, specific sectors will face significant headwinds from higher energy costs and geopolitical uncertainty. We are looking at airlines, shipping companies, and consumer discretionary stocks as being particularly vulnerable right now. Establishing put positions or selling call spreads on these sectors could provide a valuable layer of portfolio protection in the coming weeks.
Create your live VT Markets account and start trading now.
Start trading now – Click here to create your real VT Markets account
Donald Trump told NBC News he was not ready to make a deal with Iran because the terms were “not good enough yet”. He said US strikes on Kharg Island had “totally demolished most of the island”, and added the US had not targeted “energy lines” because rebuilding would take years.
He declined to say whether the US Navy would escort ships, but said the US would sweep the Strait of Hormuz “very strongly”. He said other countries would join efforts to keep the route open, and that some nations were being impeded from getting oil.
Uncertainty Around Strait Of Hormuz
He said it was unclear whether Iran had dropped mines in the Strait of Hormuz. He also said reports that Iran’s Supreme Leader was dead were a rumour.
In Truth Social posts, he said the US had “destroyed 100% of Iran’s Military capability”. He urged countries including China, France, Japan, South Korea and the UK to send warships, and said the US would “help – A LOT”.
Reuters reported that the Trump administration rejected Middle Eastern allies’ efforts to start diplomatic talks, citing three sources. Reuters also reported that two senior Iranian sources said Iran had turned down ceasefire talks until US and Israeli strikes end.
We are looking at extreme volatility in the energy markets for the coming weeks given the uncertain military action in the Strait of Hormuz. With about a fifth of the world’s daily oil consumption passing through that narrow channel, any disruption creates massive supply-side risk. The president’s comments show a commitment to military action but an unwillingness to commit to a diplomatic solution, fueling this uncertainty.
Trading And Hedging Implications
This situation feels similar to the disruptions we saw back in 2025 after the attacks on Emirati oil facilities, when Brent crude spiked nearly $15 in a single day. Historically, during the “Tanker War” of the 1980s, sustained attacks on shipping caused severe price swings for months. The current rejection of a ceasefire by both sides suggests this conflict could have a longer duration than previous incidents.
Traders should consider buying call options on Brent and WTI futures, as a full, even temporary, closure of the Strait could send prices soaring well above current levels. Brent crude has already jumped over $115 a barrel, and implied volatility in the options market is hitting highs not seen since the start of the conflict. The risk of a sudden escalation from a stray mine or drone attack makes holding short positions extremely dangerous.
Beyond simple direction, the futures curve is steepening into backwardation, where near-term delivery contracts are much more expensive than later-dated ones. This reflects the market’s acute fear of an immediate supply shock. We are also seeing tanker insurance premiums for the Persian Gulf surge, reportedly increasing tenfold and adding a direct cost to every barrel leaving the region.
On the other side, any surprise announcement of diplomatic talks or a sudden de-escalation would cause prices to plummet just as quickly. Therefore, buying far out-of-the-money put options could be a prudent hedge against a rapid reversal. We should also anticipate that continued high energy prices will negatively impact transportation and industrial stocks that are heavy fuel consumers.
Create your live VT Markets account and start trading now.
Start trading now – Click here to create your real VT Markets account
From hype to industry-changing sentiments, AI has even loom as a market-clearing event threatening upheaval across industries. In early February 2026, markets witnessed the ‘Software-mageddon‘— an anxious sell off by traders and investments moving away from tech stocks.
The rapid rise of AI has been through hyperspeed and hyperscale evolution amidst 2025 and is making way for the upcoming IPOs of OpenAI and Anthropic, the two big names creating market pulses in moving trillions of dollars in pre-IPO stage.
Trader’s Takeaway:
– AI Industry Shake-Up reshaping industries
– CFD traders should focus on the impact on legacy tech stocks
– Learn Float Risk and impact of anticipation on actual supply
– Find CFD short opportunities in IPO Timeline
The Trillion-Dollar Semiconductor and AI Industry
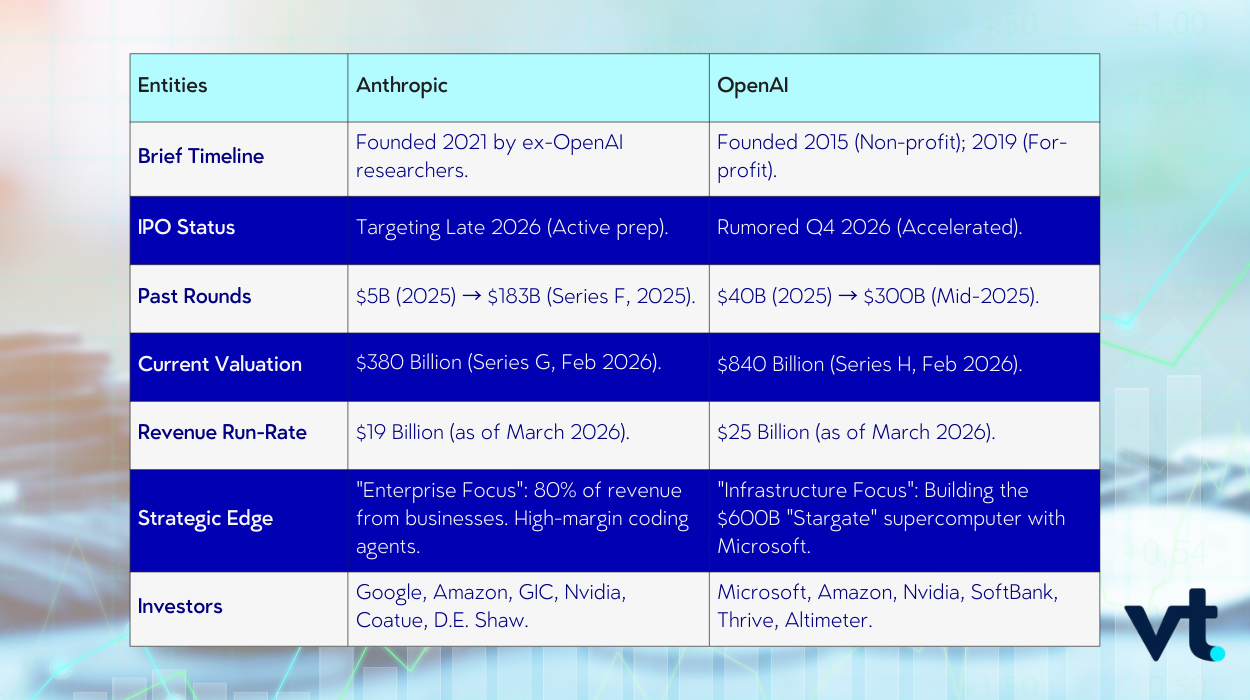
As the industry matures, the “buzz” has shifted from chatbots to infrastructure. OpenAI, recently valued at $840 billion following its February mega-round, and Anthropic, at $380 billion, are no longer just startups; they are the new gravity of the tech sector.
With such a massive valuation that continues to bump up from every funding round, even the market is looking to boost these two companies for further innovation. These companies’ biggest competitors are also their biggest benefactors.
The shift towards Strategic Tech Consolidation where Big Tech and these entities are formulating a critical infrastructure has started.
Any news on these entities creates immediate, tradeable volatility across the entire Magnificent Seven and the semiconductor sector. We are no longer trading isolated companies; we are trading an interconnected AI web.
Download the VT Markets app to monitor real-time price action.
Strategic Hedging
For CFD traders, this creates a dual opportunity: speculating on the AI giants while simultaneously hedging against the “old guard.
The Contagion Trade: When the Backers Become the Risk
Microsoft(MSFT), Alphabet (GOOG), and Amazon (AMAZON) are no longer just traditionally reliable tech companies. In backing heavily in OpenAI and Anthropic, they are also leveraged proxies, indicating sentiments and a ‘report card’ for AI’s growth.
With Anthropic being enterprised-focus, it is looking to dominate software spaces and enable business level automation. The company is merging as a major disruptor to traditional software-as-a-service (SaaS) business models,
Look to Calmer Markets In Blind Volatility
When a massive listing like OpenAI goes live, individual stock movements can become erratic and unpredictable. A more removed exposure to the AI boom might exist in CFD Indices (e.g. NAS100) that distribute performance within just a single stock and supports a general Tech to AI stack.
A Race for Sustainable Intelligence
That said, consolidation within the technology sector can also create a cannibalisation of features and offerings. At that point, the question is no longer on how good the product is, but how far the business can go, a primary metric for Anthropic and OpenAI on their way to market leadership.
Comparing Anthropic and OpenAI IPO Strategies
Strategy Pillar
Anthropic (The Efficiency Play)
OpenAI (The Infrastructure Play)
Primary Strategy
Enterprise-First: Focused on high-margin B2B tools like Claude Code. 80% of revenue comes from stable business contracts.
Ecosystem-First: Building a global “AI Operating System” and “Stargate” infrastructure to own the entire value chain.
Cost Management
Multi-Cloud Diversification: Spreads compute across AWS, Google Cloud, and Oracle to arbitrage chip prices and avoid provider lock-in.
Vertical Integration:Building proprietary data centersband in-house chips to reduce long-term dependency on Nvidia.
Infrastructure Spend
“Capital Light”: Spends heavily on R&D but leases infrastructure, allowing for a faster pivot to cash-flow positivity.
“Capital Intensive”: Tied to a $1.4 Trillion long-term data center roadmap, leading to massive short-term burn.
Profitability Status
Projected Cash-Flow Positive by 2027/28.
Projected $14B Loss in 2026; profit delayed until ~2030 to fund massive scale.
OpenAI works towards a for-profit structure, gaining more control from investors for a high-beta momentum play. Its path is longer and riskier, but its scale is unmatched.
Anthropic is the “Efficiency” play, aiming for profitability years sooner, by avoiding debt trap and distributing reliance.
The agenda remains clear, it is about who can beat the other towards IPO countdown.
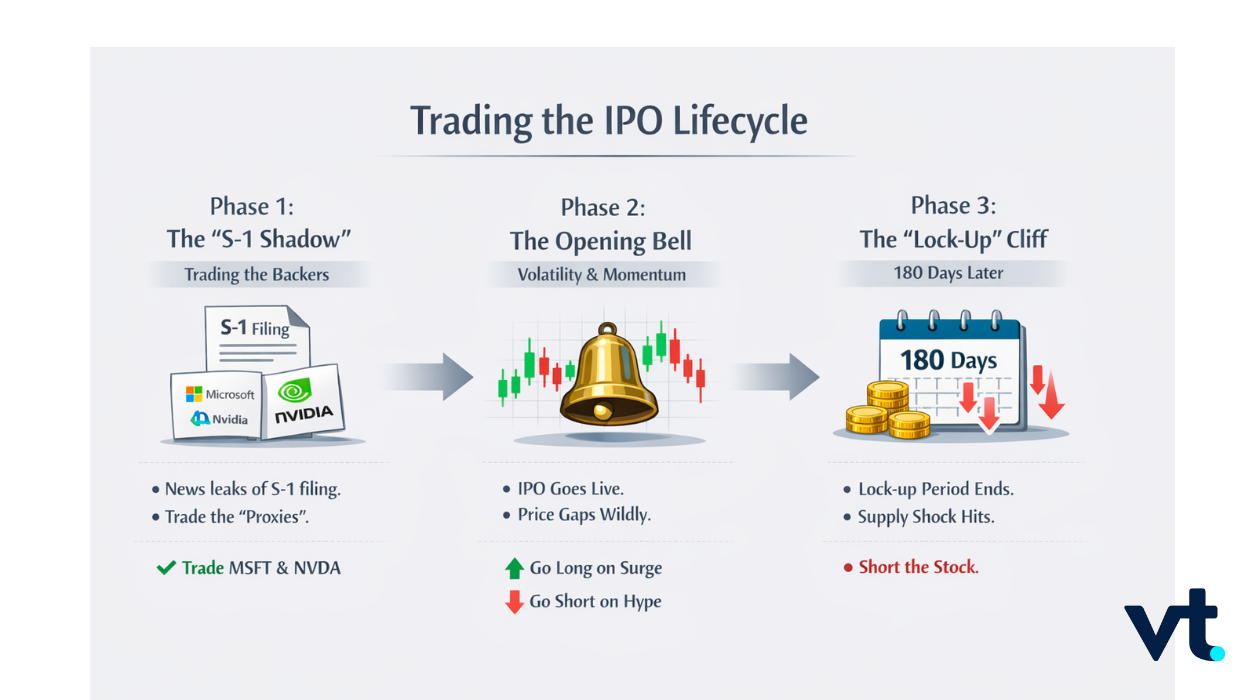
Opportunities in the IPO Timeline
In the world of CFDs, timing is the difference between a successful trade and a missed opportunity. Here is how to navigate an IPO countdown when it happens:
In initial prep, the companies that reflect revenue growth, will boost the stock prices of its primary backersoften surge as discussed in The Contagion Trade section.
When the ticker goes live in phase 2, the low float often causes the price to gap violently, making opportunity for Momentum Trading. A moment to choose long or short with demand surges or price correction.
Finally, approximately six months after an IPO, early investors are finally allowed to sell their shares. This supply shock correction is often another window for price to fall, creating another trade opportunity.
Understanding Float Risk: The CFD Advantage in IPO
In Pre-IPO discussions like now, traders may find opportunities in market fluctuations as these companies move ahead, particularly if there is a rush of investor interest or volatility following their public listing.
Float risk is the primary driver of the “Opening Bell” price movements for these IPOs. The small float means there’s limited supply of shares to meet demand, which causes extreme volatility, an inviting time for CFD trades.
Until IPO, Industry Still Moves
In the Applications stage of the AI lifecycle, the AI stack is scaling. Anthropic’s focus on ethical AI positions adds to the safety-first regulatory approach like what we’ve seen in AI Identity Access Management, while OpenAI bets on becoming the global AI operating system. Both these entities are transitioning into market leaders regardless.
Remember, the ‘Software-mageddon’ sweep shows us the market might be more unanimous than ever, but trading opportunities can still be found.
At VT Markets, we equip traders with the tools, insights, and execution capabilities to navigate these transformative shifts, helping you position ahead of major market developments.
Quick Refresher
What are the primary trading opportunities in OpenAI and Anthropic’s IPOs? The best opportunities come from managing float risk and volatility. Traders can capitalize on sharp price movements after the IPO listing and the lock-up period when early investors sell shares.
How does float risk impact IPO trading? Float risk occurs when a company releases only a small percentage of shares, creating price volatility. This limited supply often leads to rapid price swings, which traders can exploit for short-term gains.
Why is shorting legacy tech stocks a smart strategy now? As AI companies like OpenAI and Anthropic disrupt industries, legacy tech stocks may experience declining value, making them ripe for shorting as market capital shifts toward AI-driven growth.
What is legacy tech? Legacy tech refers to established technology companies and their products, such as software and hardware firms, that may struggle to adapt to new AI-driven trends and innovations in the market.
How can CFD traders prepare for AI IPOs like OpenAI and Anthropic? CFD traders should focus on momentum trading during the IPO, keep an eye on float risk, and track industry shifts in AI that may affect broader sectors, especially legacy tech.
Start trading now – Click here to create your real VT Markets account
US President Donald Trump said the US hit military targets at Kharg Island in the Persian Gulf and warned it could strike oil sites next if Iran keeps disrupting energy flows through the Strait of Hormuz. He described the operation as one of the most powerful bombing raids in the history of the Middle East and said US forces did not target oil infrastructure.
Kharg Island handles nearly all of Iran’s crude oil exports and had largely been avoided by the US and Israel. Reports said officials in the Trump administration have discussed seizing the island as a possible option.
Iran Retaliation Threats
Iran warned it would retaliate against US-linked energy assets. Iran’s Al-Anbiya Central Headquarters said oil and energy facilities linked to companies cooperating with the US would be “immediately destroyed and turned to ashes” if Iran’s energy infrastructure is targeted.
Qatar’s Defence Ministry said its forces intercepted a missile attack aimed at the country, AFP reported. The developments add to a two-week conflict in the region.
WTI is West Texas Intermediate crude, one of three major benchmarks alongside Brent and Dubai. It is a US-sourced, light, sweet crude distributed via the Cushing hub.
WTI prices are driven by supply and demand, geopolitical disruption, OPEC decisions, and the US dollar. API and EIA weekly inventory reports can move prices; their results are within 1% of each other 75% of the time, and API is published Tuesday with EIA the next day. OPEC has 12 members and meets twice yearly, while OPEC+ includes ten non-OPEC members, including Russia.
Market Impact And Trading Approach
With the US striking Kharg Island, we should anticipate a significant spike in crude oil prices when markets open. The immediate strategy involves positioning for this upside, primarily through buying WTI and Brent call options or futures contracts. This direct military engagement in a critical export hub signals a severe escalation that will likely price in a substantial risk premium.
The Strait of Hormuz, through which over a fifth of the world’s daily oil consumption passes, is now the center of a direct military conflict. Iran’s threat to retaliate against US-linked energy infrastructure puts a significant portion of that supply in immediate jeopardy. Any actual attack on tankers or facilities in the region would send shockwaves through the market, pushing prices much higher.
We expect a dramatic surge in market volatility, which will be reflected in options pricing. The CBOE Crude Oil Volatility Index (OVX), which was hovering around 40 last week, will likely gap up significantly, potentially testing highs not seen since the 2022 energy crisis. Buying call options allows us to profit from both the rise in oil prices and this expansion in implied volatility.
This situation has historical parallels, such as the initial phase of the conflict in Ukraine back in 2022, when WTI crude prices surged past $120 per barrel. Given that this new conflict directly targets oil infrastructure, a move toward those previous highs in the coming weeks seems plausible. Traders should use these past events as a rough guide for setting potential price targets.
A key trade to consider is the widening of the Brent-WTI spread, as Brent crude is more directly exposed to Middle Eastern supply disruptions. As of early March 2026, the spread was a narrow $4, but we can expect this to widen considerably as the geopolitical risk is centered in the Persian Gulf. Going long Brent futures while simultaneously shorting WTI futures could capture this divergence.
We must also monitor the response from OPEC+, which currently holds an estimated 3.5 million barrels per day of spare production capacity. While this could theoretically soften the blow of a supply disruption, bringing it online takes time and may not be enough to calm a market facing a full-blown military crisis. Weekly inventory reports from the EIA will be critical to watch, as any surprise drawdowns will add more fuel to the rally.
Create your live VT Markets account and start trading now.
Start trading now – Click here to create your real VT Markets account
The euro ended the week down over 1.74% against the US dollar and fell 0.84% on the day. EUR/USD logged four straight down sessions after dropping below the 200-day simple moving average at 1.1672, and it was trading at 1.1414.
On the weekly chart, EUR/USD is below 1.1450 and the Relative Strength Index moved into negative territory three weeks ago after slipping under the 50 level. This points to continued downward movement, with support levels at 1.1400 and 1.1300.
Technical Levels And Trend
If those supports break, the next major area is the 100-week simple moving average at 1.1165. On the daily chart, the nearest support is the 1 August 2025 swing low at 1.1391.
A break below 1.1391 brings the 29 May 2025 daily low at 1.1210 into view. If weakness continues, the 12 May 2025 low at 1.1065 is the next level to watch.
Looking back at the analysis from late 2025, we saw a strong bearish bias form in the EUR/USD after it broke below its 200-day moving average. That sentiment appears justified, as the fundamental picture has since confirmed a weakening Euro. The technical breakdown we observed then was the start of a more significant move.
The core of the issue is diverging central bank policy, which has become clearer in early 2026. With the latest US inflation data from February 2026 holding firm at 3.2%, the Federal Reserve is maintaining a restrictive stance with rates at 4.75%. In contrast, the European Central Bank, facing weaker growth, made a 25 basis point cut in January 2026, bringing its main rate to 2.75%.
Fundamental Drivers And Trade Ideas
This interest rate difference makes holding US dollars more attractive than euros, pressuring the pair lower. Recent economic data further supports this, with final Q4 2025 US GDP growth at a solid 2.3% annualized rate, while the Eurozone composite PMI for February 2026 dipped to 48.9, indicating a contraction in business activity. This economic divergence gives traders a fundamental reason to expect continued Euro weakness.
For derivative traders in the coming weeks, this environment favors strategies that profit from a falling EUR/USD. Buying put options with strike prices below the current market level offers a clear way to speculate on further downside. Alternatively, selling out-of-the-money call spreads can generate income by betting the pair will not rally significantly.
The key support levels identified back in 2025 remain highly relevant targets for these positions. As we approach mid-March 2026, the 1.1300 and the more significant 100-week moving average, which was noted at 1.1165, are the next logical areas of interest. A decisive break below these levels could accelerate the selling pressure.
Create your live VT Markets account and start trading now.
Start trading now – Click here to create your real VT Markets account