Back

Early-week Asian trading sees silver tumble 4% to mid-$80s, with bears eyeing sub-$80 acceptance

Silver (XAG/USD) fell at the start of the week and hit a four-day low in the Asian session. It traded in the mid-$80.00s, down 4% on the day, after failing near the 100-hour EMA. A move accepted below the $80.00 level is seen as a trigger for further falls. The MACD is in negative territory, with its line below the signal line and a widening negative histogram. The RSI is at 31.92, just above oversold, which points to ongoing selling pressure. It also suggests the price is near a level where short-term rebounds can occur. Support sits near $79.50, then $78.50, with $78.00 as a further downside level. Resistance is at $81.50, and a push above it could lead towards $82.50. The price remains below the 100-period EMA near $84.50, keeping the downside bias in place. A sustained move above that level would weaken the bearish view and point to a steadier recovery. The analysis was produced with help from an AI tool. We are seeing silver begin the week with significant selling pressure, confirming the bearish technical setup. The failure to hold above the $80.00 mark is a critical signal for us in the near term. This price action suggests that downside momentum is building, and traders should be prepared for further weakness. The broader economic environment supports this caution, as last week’s February 2026 Consumer Price Index (CPI) data came in at 4.1%, slightly below expectations. This cooler inflation reading has temporarily dampened silver’s appeal as a hedge, contributing to the current drop. The market is now factoring in a less aggressive stance from central banks, which is weighing on precious metals. For derivative traders with a bearish bias, a sustained break below the $80.00 psychological level presents a clear opportunity. We would consider buying put options with strike prices at $79.00 or $78.50, targeting a move toward the $78.00 objective in the coming weeks. The expanding negative MACD indicator validates this strategy, signaling that the downward trend has strength. However, we recall the powerful rally throughout 2025, which saw silver climb from the low $60s, driven by record industrial demand. The Silver Institute reported that consumption from the solar and electronics sectors grew by another 15% last year, a fundamental support that could trigger sharp bounces. The Relative Strength Index (RSI) is also nearing oversold territory, suggesting the current selling might be overextended. Given this, traders looking for a reversal should remain patient and wait for confirmation. A potential strategy is to watch for a decisive move back above the $81.50 resistance level before initiating long positions. Buying call options above this point could be a way to capitalize on a short-term bounce toward the $82.50 area. Ultimately, the key resistance remains the 100-period EMA near $84.50, and as long as the price stays below this line, the bears are in control. Uncertainty surrounding future industrial orders and the next move from the Federal Reserve will likely keep silver volatile. We will be watching the $80.00 level closely as the pivot point for the next major price move.

Start trading now – Click here to create your real VT Markets account

China’s February annual CPI rose 1.3%, beating 0.8% forecasts, as reported by China’s statistics bureau

China’s Consumer Price Index rose 1.3% in February year on year, up from 0.2% in January, versus a 0.8% market forecast. CPI also increased 1.0% month on month in February, after a 0.2% rise previously. China’s Producer Price Index fell 0.9% year on year in February, following a 1.4% drop in January. This compared with a market forecast of -1.1%.

Market Reaction And Key Context

After the release, AUD/USD was down 0.80% at 0.6965. Trading before the data was already weaker, alongside a risk-off tone and a firmer US Dollar. Ahead of the release, the National Bureau of Statistics was due to publish the figures at 01:30 GMT. CPI and PPI are measures of price changes for consumers and producers, with year-on-year readings comparing the month with the same month a year earlier. Price levels cited for AUD/USD included resistance at 0.7055, 0.7089 and 0.7147. Potential support levels were 0.6906, the 100-day EMA at 0.6810, and 0.6741. Other figures referenced include the RBA’s 2–3% inflation target and iron ore exports of $118 billion a year (2021 data). Looking back to this time in 2025, we saw China’s consumer inflation data beat expectations while producer prices were still falling. This created a mixed signal for the Australian dollar, which struggled to gain traction despite the positive consumer news. That pattern of deflationary pressure from producers was a key theme we watched throughout last year.

Implications For RBA And Audusd

Now, the most recent data for February 2026 shows a more decisive shift, with consumer prices rising a stronger-than-expected 1.8%. More importantly, producer prices have finally turned positive for the first time in over a year, with the National Bureau of Statistics reporting a 0.2% increase. This suggests that the disinflationary pressures out of China, which weighed on the global economy, may be ending. This shift complicates things for the Reserve Bank of Australia, which we’ve seen hold its cash rate steady at 4.35% for the last several meetings. While the AUD/USD has been weak recently, currently trading around 0.6650, this data reduces the probability of near-term rate cuts. We should now watch for any hawkish adjustments in the RBA’s forward guidance. The Australian dollar’s position is also influenced by key commodity prices. After a period of strength, iron ore prices have recently slipped below $110 per tonne, acting as a headwind for the currency. However, this positive producer price data from China, its largest customer, could provide a much-needed floor for industrial commodity prices. Given these developments, we should consider positioning for increased volatility in the AUD/USD pair. Buying call options could be a viable strategy to capitalize on a potential rebound, with initial resistance now seen near the 0.6700 psychological level. Conversely, if global sentiment sours, put options could be used to protect against a slide back toward the year’s lows. Ultimately, the US dollar’s role as a safe-haven asset remains a dominant factor for us to monitor. Even with this encouraging news from China, any increase in global uncertainty tends to push capital into the dollar, which can limit gains for the Aussie. Therefore, we must balance this specific data against the broader risk-on or risk-off market environment. Create your live VT Markets account and start trading now.

Start trading now – Click here to create your real VT Markets account

Week Ahead: The Battle For CLARITY And Oil Stakes

Key Takeaways

  • The CLARITY Act debate in Washington is creating uncertainty across digital asset markets as lawmakers struggle to finalise a regulatory framework for crypto.
  • Banking opposition to stablecoin rewards highlights a growing battle between traditional finance and the emerging digital asset economy.
  • The Trump administration is pushing for faster crypto regulation, arguing delays could push innovation overseas.
  • Traders are also watching US CPI inflation data, which may influence Federal Reserve rate expectations and US dollar strength.
  • Key technical levels remain in focus across major markets, including gold near $4,996, Bitcoin defending $62,502 and USDX testing resistance near 99.631.

One of the biggest developments shaping market sentiment this week is the growing political battle around the Digital Asset Market Clarity Act of 2025, widely known as the CLARITY Act.

The legislation was originally designed to reset the regulatory framework for digital assets in the United States. After passing the House of Representatives with strong bipartisan support last year, the bill aimed to clearly divide regulatory authority between the Securities and Exchange Commission (SEC) and the Commodity Futures Trading Commission (CFTC).

However, progress has slowed dramatically in the Senate. What began as a technical attempt to define crypto market structure has evolved into a broader economic debate about the future of digital finance and the role of the traditional banking system.

For traders, the outcome matters because regulatory clarity could unlock institutional participation in digital assets, while prolonged delays may continue to create volatility in crypto markets.

Why The Bill Has Stalled In Washington

The primary obstacle facing the CLARITY Act is a breakdown in negotiations over the revised Senate version of the bill.

While the House legislation moved quickly, Senate discussions encountered resistance early in 2026. A scheduled markup session in January was postponed indefinitely after several major industry participants withdrew their support for the latest draft.

Crypto firms argued that the revised proposal introduced rules that were too restrictive and could limit innovation in the sector.

The White House attempted to force progress by setting a drafting deadline of March 1, 2026, but that date passed without an agreement. The delay has now become a focal point for markets watching how the United States intends to regulate the rapidly growing digital asset economy.

Banking Opposition And The Risk Of Deposit Flight

Traditional banks have emerged as some of the most vocal opponents of the current version of the legislation.

Their concerns centre around a provision that would allow stablecoin issuers and crypto platforms to offer interest-like rewards on digital dollar tokens. Banks argue that this could create a powerful incentive for consumers to move deposits away from traditional savings accounts and into crypto wallets.

Industry estimates suggest that if stablecoins begin offering yields around 5%, while conventional savings accounts remain far lower, the shift could pull substantial liquidity out of the banking system.

The American Bankers Association has warned that this migration could remove as much as $500 billion in deposits from the US banking sector by 2028.

For financial markets, the debate highlights a deeper conflict between legacy financial institutions and emerging digital asset platforms.

Trump Administration Pushes Crypto Agenda

President Trump has taken a more direct role in the debate, framing the CLARITY Act as a key pillar of his administration’s digital asset strategy.

In recent statements, the administration has criticised major banks for lobbying against the bill, accusing them of attempting to protect their profit margins by slowing regulatory reform.

The White House has also argued that delays could push digital asset innovation overseas, particularly toward countries that are already implementing clearer regulatory frameworks.

From the administration’s perspective, establishing the United States as a global centre for crypto innovation is both an economic and geopolitical objective.

For traders, this political backing increases the likelihood that some form of regulatory framework will eventually emerge, although the timeline remains uncertain. Read recent economic updates connected to Trump here.

Possible Paths Toward A Compromise

Despite the current stalemate, policymakers are exploring several potential compromises.

One proposal from the White House would allow stablecoin rewards only when tokens are actively used for payments, while preventing interest-style rewards on idle balances that resemble traditional savings accounts.

Another development gaining traction is the rise of federal trust bank charters for crypto companies. Several fintech and digital asset firms have recently applied for or received these charters through the Office of the Comptroller of the Currency, allowing them to operate with a degree of federal oversight while broader legislation remains unresolved.

While these measures do not replace the CLARITY Act itself, they may offer a temporary pathway for the industry as lawmakers continue negotiations.

Legislative Timeline Traders Should Watch

The political calendar is also becoming a critical factor.

With US midterm elections approaching in 2026, the window for passing the legislation is narrowing.

Current expectations suggest several key milestones:

  • March 2026: Closed-door negotiations continue after the missed drafting deadline.
  • April 2026: New rules around federal crypto charters could begin taking effect.
  • May 2026: Final opportunity for a Senate Banking Committee markup before election season dominates the agenda.
  • August 2026: Target window for a full Senate vote.
  • January 2027: Potential implementation date if the bill passes before year-end.

For markets, these milestones will shape expectations for regulatory clarity and could influence the trajectory of digital asset investment in the United States.

Upcoming Events

11 March 2026

1. US CPI y/y, Forecast: 2.50%, PRevious 2.40%

Inflation data may reshape Fed rate expectations.

12 March 2026

1. UK BOE Gov Bailey Speech

Markets are watching signals for upcoming rate decisions.

13 March 2026

1. US GDP m/m, Forecast: 0.20%, Previous: 0.10%

Growth data gauges economic momentum.

2. US Core PCE Price Index, Forecast: 0.40%, Previous: 0.40%

Fed’s preferred inflation gauge.

3. JOLTS Job Openings, Forecast: 6.84M, Previous: 6.54M

Labour demand trends influence policy outlook

Key Movements Of The Week

Gold (XAUUSD)

  • XAUUSD consolidates above $4,996 support.
  • Break below $4,842 may attract stronger sellers.
  • CPI inflation data could trigger volatility.

Bitcoin (BTCUSD)

  • BTCUSD rejected after breaking $70,969 swing high.
  • $62,502 now acts as the final defence for buyers.
  • Crypto regulation debate adds volatility risk.

US Dollar Index (USDX)

  • USDX gapped higher at the start of the week.
  • Break above 99.631 could trigger move toward 100.321.
  • CPI may decide the next direction.

SP500

  • SP500 failed near 6,902 resistance and printed a swing low.
  • 6,517 now acts as the crucial support level.
  • Geopolitical tensions increase volatility.

Bottom Line

Markets are entering the week with several competing forces shaping price action. Inflation remains the central macro driver, with US CPI expected at 2.5% year on year. A stronger reading could reinforce US dollar strength and delay expectations for Federal Reserve rate cuts.

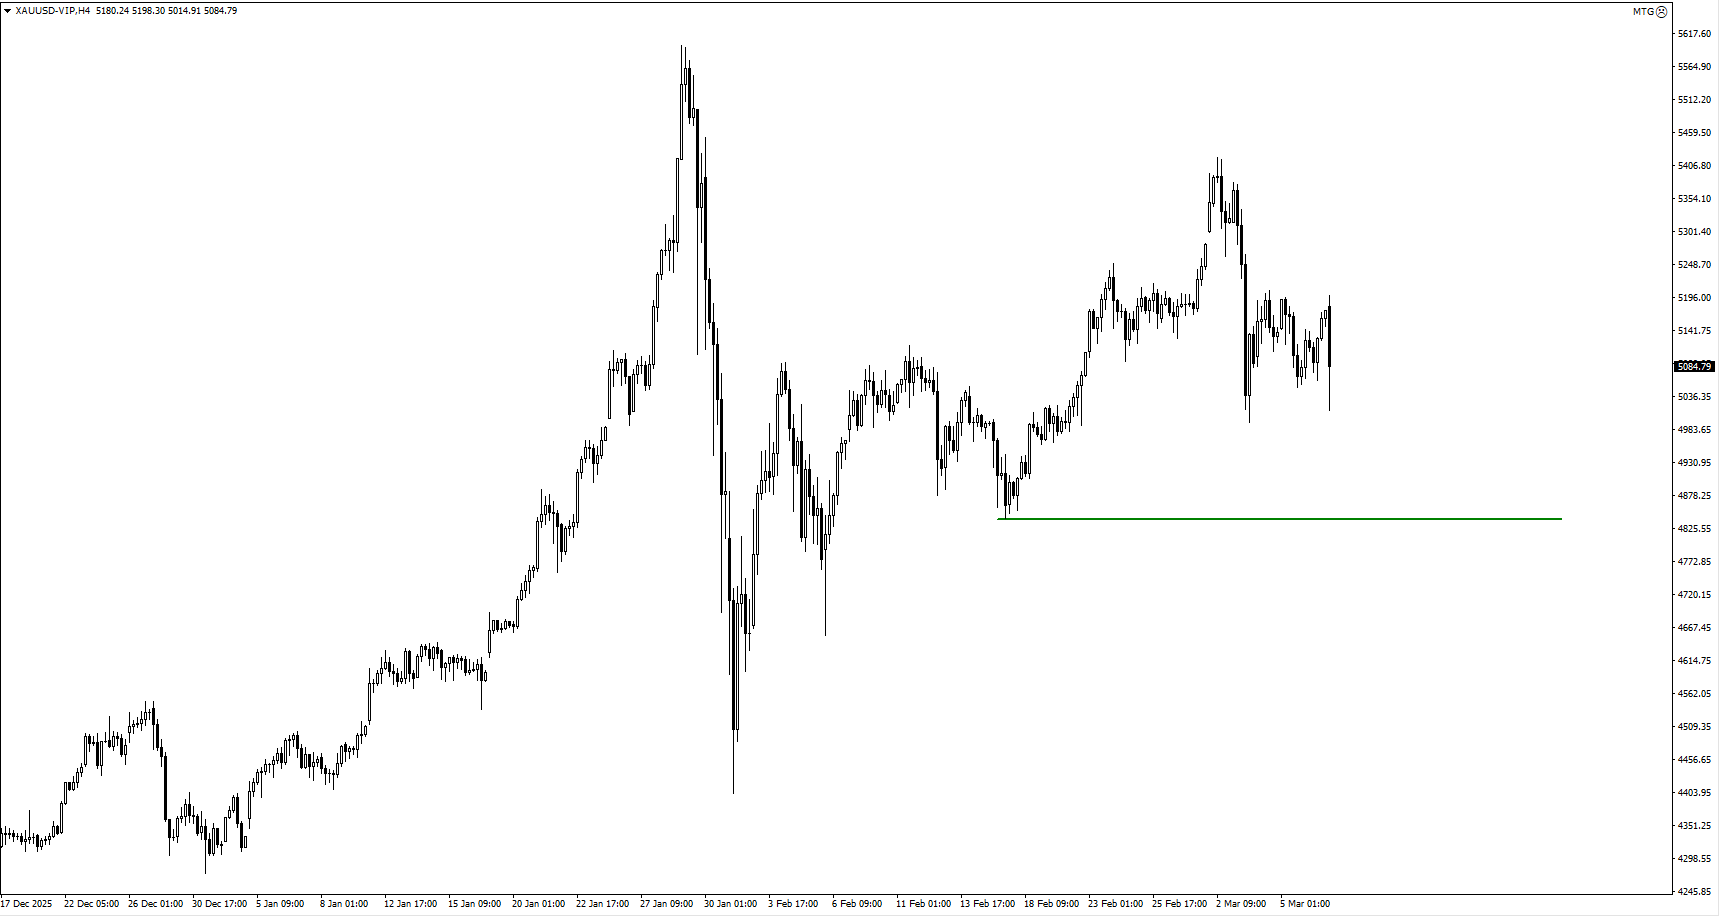
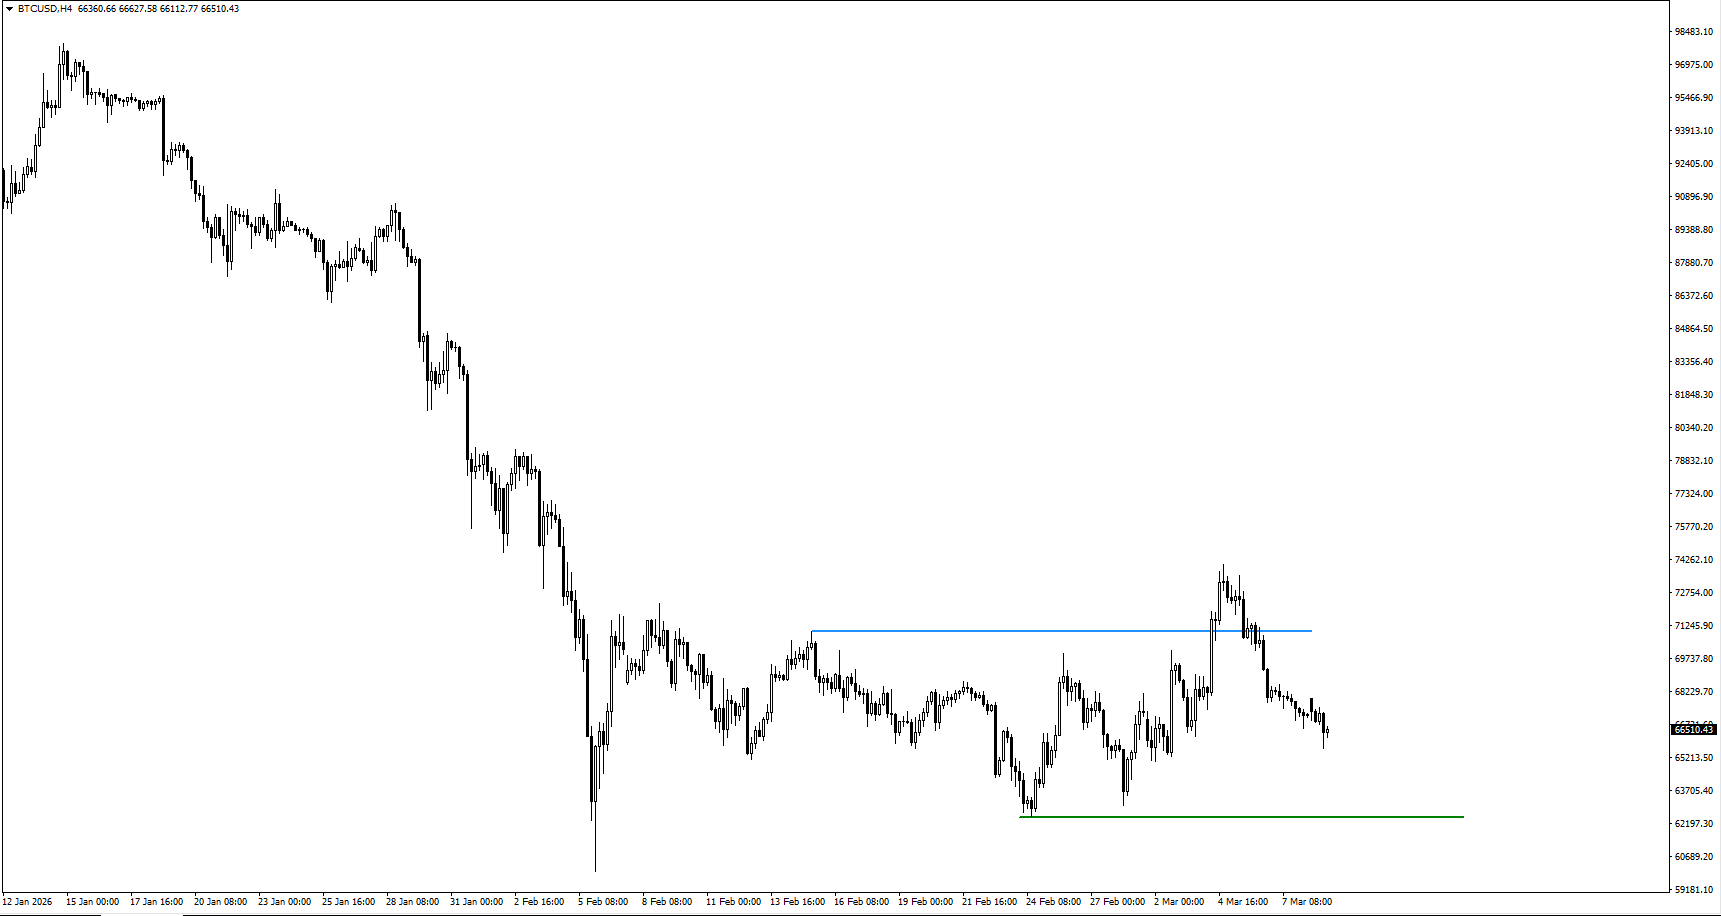
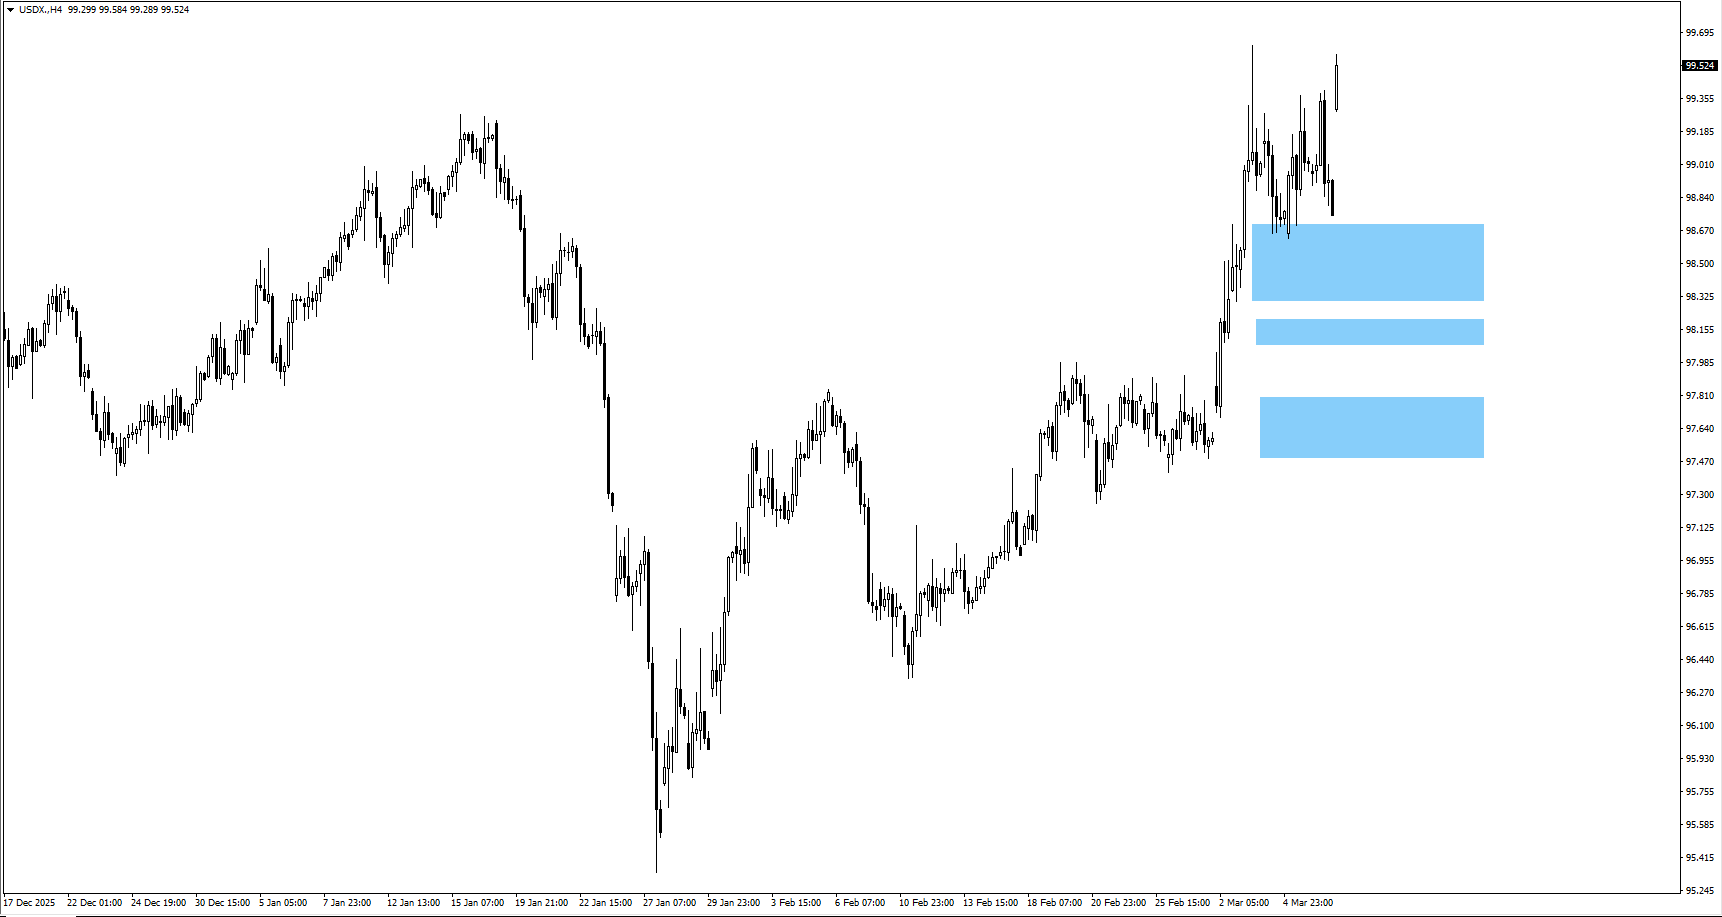
At the same time, geopolitical tensions and rising oil prices above $100 are adding risk premium to global markets. Technically, gold continues to consolidate above $4,996, Bitcoin is defending the $62,502 support level after a failed breakout above $70,969, and the US Dollar Index is testing resistance near 99.631.

These levels will likely determine the next directional move as traders react to inflation data, regulatory developments in crypto markets, and shifting global risk sentiment.

Create your live VT Markets account and start trading now.

Trader FAQs

1. What is the outlook for gold prices this week?

Gold (XAUUSD) is trading in consolidation while markets wait for US CPI data. The key level to watch is $4,996, which currently acts as support. If gold falls below this level, sellers may begin targeting $4,842, where stronger downside momentum could develop. Inflation data and US dollar strength will likely determine the next major move.

2. How does the CLARITY Act affect Bitcoin and crypto markets?

The Digital Asset Market Clarity Act aims to define regulatory oversight between the US Securities and Exchange Commission (SEC) and the Commodity Futures Trading Commission (CFTC). However, the bill has stalled in the Senate due to disagreements around stablecoin rewards and banking oversight. This regulatory uncertainty is contributing to volatility in Bitcoin and broader digital asset markets.

3. Why did Bitcoin fall after breaking above $70,000?

Bitcoin briefly broke above the $70,969 swing high, but the move quickly reversed as traders took profit and risk sentiment weakened. The market is now defending $62,502, which has become the most important support level in the current structure. A sustained break below this level could open the door for a deeper correction.

4. Why is the US CPI important for traders?

US Consumer Price Index (CPI) data measures inflation and strongly influences expectations for Federal Reserve interest rate decisions. If inflation comes in higher than expected, the Federal Reserve may delay rate cuts, which could strengthen the US dollar and pressure assets such as gold and Bitcoin.

5. What levels should traders watch in the US Dollar Index (USDX)?

The US Dollar Index recently gapped higher, with traders watching 99.631 as the immediate resistance level. If the dollar breaks above this level, it could move toward 100.321, strengthening the currency further and potentially weighing on commodities such as gold.

China’s February yearly Producer Price Index fell 0.9%, beating forecasts of a 1.1% decline

China’s Producer Price Index (PPI) fell 0.9% year on year in February. This was a smaller decline than the forecast of -1.1%. The result indicates producer prices were still lower than a year earlier. The gap versus expectations was 0.2 percentage points.

China Ppi Misses Less Than Expected

The latest data shows China’s producer prices fell 0.9% in February, a smaller drop than the 1.1% decline we were braced for. While this marks the 17th straight month of factory-gate deflation, the slower pace of decline suggests the worst pressures might be starting to ease. This slight beat on expectations is a signal we cannot ignore. This points to a potential firming of demand for industrial commodities, as it hints at a bottoming process in China’s manufacturing sector. We’ve seen iron ore prices stabilize around $115 per tonne after dipping earlier in the year, and this PPI number could provide further support. Traders should consider positioning for modest upside in copper and oil through the coming weeks, perhaps using call spreads to define risk. For currency traders, this data may provide a floor for the yuan. A less deflationary environment reduces the immediate pressure on the People’s Bank of China for more aggressive easing, which could temper the yuan’s weakness against the dollar. We should watch the USD/CNH pair for signs of resistance, as a break lower could gain momentum. This improvement, however slight, could also boost sentiment for Chinese equities that were battered by pessimism throughout 2025. Better factory prices can translate into improved margins for industrial companies, potentially lifting indices like the Hang Seng. We should consider buying short-dated call options on China-focused ETFs to play a potential sentiment shift.

Potential Market Implications Ahead

Create your live VT Markets account and start trading now.

Start trading now – Click here to create your real VT Markets account

In February, China’s monthly CPI rose to 1%, up from the previous 0.2%

China’s consumer price index rose by 1% month on month in February. This was up from 0.2% in the previous month. The jump to 1% monthly inflation is the largest we have seen in over a year and challenges the deflation narrative that dominated the second half of 2025. We must now question if this is a temporary spike caused by the Lunar New Year holiday or the beginning of a real economic turnaround. This uncertainty itself creates trading opportunities in the coming weeks.

Implications For Monetary Policy

This data complicates the People’s Bank of China’s next move, especially after they cut the reserve requirement ratio late in 2025 to stimulate growth. Traders positioned for further easing might be caught off guard, creating potential value in short-term interest rate swaps that bet on rates staying firm. We need to watch the PBoC’s open market operations closely for any sign of a shift in liquidity provision. For currency traders, this inflation print provides a reason to be bullish on the Yuan. The currency has been weak against the dollar, but a central bank forced to pause its easing cycle could give it strength. We should look at call options on the CNH to capitalize on a potential upward move with defined risk. This signal of stronger domestic demand is a significant catalyst for commodities. China consumes over half of the world’s refined copper, and prices have already risen over 5% this year to around $8,900 per tonne on supply concerns and recovery hopes. This inflation report supports buying call options on industrial metals and energy futures. On the equity front, we should be cautious, as the market is torn between positive growth signals and the risk of reduced stimulus. While the Hang Seng and CSI 300 may see a short-term boost from positive consumer data, any sign that the PBoC is turning less supportive could cap the rally. We need to see the March data before building large, bullish positions in stock index futures.

Key Trades To Watch

Create your live VT Markets account and start trading now.

Start trading now – Click here to create your real VT Markets account

Monthly Analyst Scope: Kevin Warsh And The High Stakes Monetary Reset

Discussion around the future direction of United States monetary policy has intensified following Donald Trump’s nomination of Kevin Warsh to lead the Federal Reserve, subject to vetting and confirmation by the United States Senate.

While the confirmation has yet to conclude, the nomination itself has already begun to influence market expectations.

Warsh represents a markedly different monetary philosophy from the current Federal Reserve leadership, and his prospective appointment carries meaningful implications for the US dollar, Bitcoin, and global liquidity conditions.

The key issue is not whether money printing will occur. The debate centres on timing, scale, and mechanism.

Markets are attempting to determine whether the next policy regime would continue smoothing every downturn with incremental liquidity or tolerate stress and volatility before deploying decisive intervention. That distinction alone reshapes asset pricing across currencies, bonds, equities, and digital assets.

Markets Focal Point On Kevin Warsh

Kevin Warsh served as a Federal Reserve Governor from 2006 to 2011, placing him directly inside the institution during the Global Financial Crisis. Since leaving the Fed, his commentary has been unusually consistent and direct.

Warsh has repeatedly argued that financial markets have become too reliant on central bank support and that injecting liquidity too early prevents prices from adjusting naturally, while encouraging investors to take excessive risks because they expect to be rescued.

Warsh does not oppose lower interest rates. In fact, he has acknowledged that lower rates are structurally necessary given high debt levels and housing affordability pressures. What he opposes is continuous money creation.

In his framework, markets should be allowed to fall, leverage should be exposed, and only then should policymakers intervene to prevent systemic collapse rather than protect asset prices.

This approach stands in contrast to the policy style associated with Jerome Powell, under whom the Federal Reserve has favoured gradual easing, repeated balance sheet expansion, and rapid deployment of liquidity facilities to dampen volatility.

Both approaches ultimately result in monetary expansion. The difference lies in how pain is distributed. One spreads support consistently through a downturn. The other withholds support until stress forces repricing, then intervenes forcefully.

For Bitcoin and crypto markets, this distinction is critical. Crypto assets are highly sensitive to liquidity conditions. A period of deliberate tightening without immediate intervention is negative for Bitcoin in the short term, as liquidity withdrawal compresses speculative positioning and reduces marginal demand.

For gold and silver, timing is less important than certainty. Whether money printing happens early or late, the long-term erosion of purchasing power remains inevitable. The US dollar may strengthen temporarily during periods of liquidity restraint, but once large-scale printing resumes, real purchasing power erosion follows.

This raises an important political question. If Trump prioritises growth, housing recovery, and domestic manufacturing, why would he favour a figure perceived as liquidity restrictive?

The answer likely lies in the gap between stated philosophy and crisis behaviour. Warsh’s public posture emphasises discipline, but his record during 2008 shows a willingness to support aggressive intervention when systemic stability is threatened.

Credibility calms markets, but policy intentions often change once real pressure hits the system.

What A Warsh Fed Would Likely Do

If Warsh were to shape monetary policy, the most significant shift would likely be a move away from permanent quantitative easing and toward balance sheet neutral liquidity tools.

Ongoing bond purchases would be curtailed, not because liquidity is unnecessary, but because continuous Federal Reserve balance sheet expansion distorts incentives and crowds out private balance sheets.

Instead, the Standing Repo Facility would play a central role. This facility allows banks to borrow cash overnight against high-quality collateral. By removing effective caps on this facility, banks would gain access to emergency liquidity without the Federal Reserve directly injecting money into markets.

This distinction is important. Quantitative easing functions as a stimulant that encourages risk-taking and asset inflation. The repo facility functions as oxygen that is invisible until necessary and deployed only when stress emerges.

Under this framework, banks use their own balance sheets to distribute liquidity. The Federal Reserve shrinks in footprint while the financial system remains operational. Banks earn spreads, Wall Street benefits, and liquidity flows without constant headline money printing.

This framework, however, depends critically on changes to the Supplementary Leverage Ratio. The SLR was introduced after the 2008 crisis as a blunt but effective safeguard.

It requires banks to hold capital against the total size of their balance sheet regardless of asset composition. The rule exists because pre crisis models underestimated risk by relying on ratings that ultimately failed.

The Structural Risk Behind The Strategy

The current problem is that the SLR treats US Treasuries as capital-intensive assets. Since 2020, the US government has issued trillions of dollars in new debt. Banks are the primary buyers of this debt, yet under SLR constraints, every additional Treasury purchase requires raising expensive capital.

As a result, banks have gradually reduced their participation in Treasury absorption, contributing to fragility in the bond market.

Both Warsh and Scott Bessent have criticised this framework. Their argument is that Treasuries are the safest assets in the financial system and should not constrain balance sheets in the same way as risky loans. Removing or relaxing SLR would free bank capacity, restore Treasury demand, and stabilise market plumbing.

This approach carries risk. Removing leverage constraints fixes liquidity but removes the safety belt. Banks could accumulate government debt using high leverage. If inflation resurges and bond prices fall, bank capital could erode rapidly, threatening systemic stability not because assets are toxic, but because leverage is unconstrained.

The Political And Economic Theory

From a political perspective, the strategy may still be rational.

Trump cannot sustain an economic narrative if mortgage rates remain elevated. Housing affordability is more politically powerful than equity market performance. Sacrificing stock market momentum to restore bond market pricing discipline could ultimately lower long-term yields and mortgage rates.

Ending quantitative easing suppresses equities but restores price discovery in the bond market. If inflation expectations decline, mortgage rates eventually follow. This trade-off prioritises long-term economic stability over short-term asset inflation.

A Possible 2026 Outlook

Looking toward 2026, a two-phase scenario emerges.

In the first phase, liquidity discipline dominates if Warsh executes as outlined. Quantitative tightening or restrained liquidity provision strengthens the US dollar, pressures exports, and triggers a correction in risk assets, potentially concentrated around the middle of the year.

In the second phase, the narrative shifts. A rejection of central bank digital currency frameworks combined with a formal acknowledgement of Bitcoin’s role reframes crypto not as a speculative asset but as part of the financial architecture.

Under this framework, Bitcoin benefits not from excess liquidity but from institutional legitimacy and strategic relevance.

Conclusion

Ultimately, the outcome depends less on ideology than on execution. One possibility is that Trump genuinely risks Wall Street to revive Main Street, betting on artificial intelligence-driven productivity, housing recovery, and manufacturing through lower rates.

Another possibility is more tactical. Warsh is appointed for credibility to calm bond markets. Rate cuts are demanded. If markets break and pressure mounts, Warsh, who has supported large-scale emergency intervention before, reverses course and prints aggressively.

In both scenarios, the conclusion converges. Short-term liquidity discipline may strengthen the US dollar and suppress Bitcoin. Long-term monetary reality still favours scarce assets. The path may be volatile, but the destination remains unchanged.

China’s annual CPI rose 1.3% in February, exceeding the expected 0.8% increase by economists

China’s Consumer Price Index (CPI) rose 1.3% year-on-year in February. This was above the forecast of 0.8%. The reading shows inflation was higher than expected for the month. No further breakdown was provided in the update.

China Inflation Signals A Demand Revival

This higher-than-expected inflation figure suggests consumer demand in China is reviving more strongly than we anticipated. After a prolonged period of deflationary pressure throughout 2025, this is a significant shift. We are now focused on whether the People’s Bank of China will alter its accommodative stance in the coming months. The data provides a tailwind for the yuan, as monetary policy may diverge less from Western central banks than previously thought. The offshore yuan (CNH) has already strengthened past the 7.18 per dollar mark, a key level it failed to break during the brief recovery attempt late last year. We believe traders should consider buying short-dated CNH call options to bet on further appreciation. This is also a clear bullish signal for industrial commodities that are dependent on Chinese demand. Copper prices on the London Metal Exchange have already risen 4% this month, hitting an 18-month high of over $9,950 per tonne. We see this trend continuing, making call options on copper, iron ore, and even crude oil attractive plays on a rebounding Chinese economy. For equity indices like the FTSE China A50, the path forward is less certain and suggests volatility. While economic strength is good for corporate earnings, the prospect of tighter credit conditions could cap market upside, similar to what we observed in the sharp downturn of early 2025. This environment is ideal for purchasing straddles on major Chinese market ETFs to profit from large price swings in either direction.

Positioning For Currencies Commodities And Equities

Create your live VT Markets account and start trading now.

Start trading now – Click here to create your real VT Markets account

The PBOC set the USD/CNY midpoint at 6.9158, up from the prior fixing of 6.9025

On Monday, the People’s Bank of China (PBoC) set the USD/CNY central rate at 6.9158, compared with 6.9025 the previous day. The PBoC’s monetary policy aims include maintaining price stability, including exchange rate stability, and supporting economic growth. It also works on financial reforms such as opening and developing China’s financial markets.

Governance And Policy Direction

The PBoC is owned by the state of the People’s Republic of China and is not an autonomous body. The Chinese Communist Party Committee Secretary, nominated by the Chairman of the State Council, influences the bank’s management and direction, and Pan Gongsheng currently holds both that post and the governorship. The PBoC uses multiple policy tools, including a seven-day reverse repo rate, the Medium-term Lending Facility, foreign exchange intervention, and the reserve requirement ratio. China’s benchmark interest rate is the Loan Prime Rate, which affects loan and mortgage costs and savings rates, and can also affect the renminbi’s exchange rate. China has 19 private banks, described as a small part of the financial system. The largest are digital lenders WeBank and MYbank, and in 2014 China allowed fully privately funded domestic lenders to operate in the state-led sector. Given the People’s Bank of China’s decision to set the USD/CNY reference rate at 6.9158, it signals a clear tolerance for a weaker Yuan. This move is likely a response to China’s export growth for January and February 2026, which came in at a disappointing 1.5% year-over-year, well below forecasts. We see this as a subtle policy lever to boost economic activity by making Chinese goods cheaper abroad.

Trading Implications For Usd Cny

For derivative traders, this creates an opportunity to position for further, managed depreciation of the Yuan in the coming weeks. A straightforward strategy would be to purchase USD/CNY call options with strike prices approaching the 7.00 psychological level. This approach allows for participation in the upside if the Yuan continues to weaken while limiting downside risk to the premium paid. This policy action contrasts sharply with the situation in the United States, where the latest CPI data from February 2026 showed inflation remaining sticky at 2.8%. This data makes it unlikely the Federal Reserve will cut rates soon, providing underlying strength to the US dollar. This growing policy divergence between the two nations reinforces the case for a stronger USD/CNY pair, a trend that was less clear in the final quarter of 2025. However, we must remember the central bank’s emphasis on stability, as seen during the periods of rapid depreciation in mid-2025 which prompted state bank intervention. A sudden, sharp decline in the Yuan is not the goal, so traders should hedge against abrupt policy reversals. Using options with defined risk is therefore more prudent than holding highly leveraged short positions in CNH futures. Create your live VT Markets account and start trading now.

Start trading now – Click here to create your real VT Markets account

EUR/USD opens lower, sliding towards 1.1515 in Asia, reaching its weakest level since November 2025

EUR/USD opened the week with a bearish gap and slid to the 1.1520–1.1515 area, marking a fresh low since November 2025. Market dynamics still suggest the risks remain skewed toward further downside. US Dollar demand strengthened as markets looked past a weak US Nonfarm Payrolls report and refocused on the Middle East conflict. The US Israel campaign against Iran entered its tenth day on Monday, pressuring global equities.

Oil Shock Fuels Dollar Bid

Crude Oil moved above $100 on supply disruption fears tied to the Strait of Hormuz. Oil has gained more than 25% since the conflict began, reinforcing inflation concerns. Those inflation worries have pushed expectations for the next meaningful shift in Federal Reserve policy further out. US Treasury yields rose in response, adding support to the US Dollar. Europe’s dependence on imported energy leaves the euro particularly vulnerable if crude and natural gas prices continue to climb. Traders are now focused on this week’s US inflation data for signals on the Fed rate cut trajectory, while simultaneously tracking geopolitical headlines and oil. Given the flight to safety and the persistence of geopolitical stress, US Dollar strength looks like a trend that can endure for the coming weeks. The Cboe Volatility Index move above 25 reflects a level of market anxiety not seen consistently since the banking turmoil in 2025, favoring positioning for a stronger dollar alongside elevated volatility.

Derivatives Views For Eurusd

Positioning for additional EUR/USD downside via derivatives remains the most direct expression of this outlook. The US 10 year yield pushing above 4.5% signals markets are increasingly pricing out near term Fed rate cuts that were expected only last month, making EUR/USD put options targeting 1.1400 or 1.1350 appear reasonable. Europe’s heavy reliance on energy imports, still near 60% of consumption, creates a meaningful vulnerability if oil holds above $100 per barrel. That would represent a material shock to growth and sentiment and could reinforce euro weakness, with upcoming releases such as Germany industrial production potentially reflecting that strain. The sharp oil spike echoes the early 2022 shock that helped ignite a global inflation wave. In this scenario, the inflation impulse supports a relatively more hawkish Fed while the ECB contends with weaker growth risks, a divergence that can act as a strong catalyst for a lower EUR/USD. With implied volatility rising, debit put spreads may offer a more capital efficient alternative to outright puts by defining risk while preserving downside exposure if EUR/USD drifts back toward late 2025 lows. The upcoming US inflation report is the key event risk, where an upside surprise could intensify the downward move. Create your live VT Markets account and start trading now.

Start trading now – Click here to create your real VT Markets account

During early Asian trading, GBP/USD slips towards 1.3300 as Middle East tensions lift the safe-haven US Dollar

GBP/USD fell towards 1.3300 in early Asian trading on Monday, as the US Dollar strengthened amid rising conflict in the Middle East. Markets are also looking ahead to the US February Consumer Price Index (CPI) report due on Wednesday. CNBC reported that Iran appointed Mojtaba Khamenei as supreme leader, just over a week after Ayatollah Ali Khamenei was killed in US-Israeli strikes. US President Donald Trump said he would seek to influence Iran’s next leader and warned that a choice made without Washington’s approval “is not going to last long.”

Geopolitical Risk Lifts Dollar Demand

The extended conflict has supported demand for the US Dollar and weighed on the Pound. The United States is described as a net energy exporter, which can support the currency during periods of geopolitical stress. US jobs data added a counterweight to Dollar gains and could limit further falls in GBP/USD. Nonfarm Payrolls fell by 92,000 in February, versus expectations for a rise of 59,000, while January was revised to 126,000. The Unemployment Rate rose to 4.4% over the same period. The report also noted job losses across key areas. Given the tension in the Middle East, the US Dollar is acting as a classic safe-haven asset, putting pressure on GBP/USD. This is happening despite the very weak US jobs report for February that we just saw, which showed a surprising loss of 92,000 jobs. This creates a conflicting narrative, suggesting a period of high volatility is likely in the coming weeks. The upcoming US Consumer Price Index report is the key event that could break this deadlock. Traders should anticipate a significant price swing after its release, as a high inflation number would reinforce dollar strength while a low number would amplify fears of an economic slowdown. We saw similar dynamics throughout 2022, when CPI data regularly caused currency pairs to move more than 1.5% in a single session.

Historical Patterns In Safe Haven Flows

The dollar’s strength during geopolitical crises is a well-established pattern that should not be underestimated. For instance, at the onset of the conflict in Ukraine in early 2022, the Dollar Index (DXY) rallied from around 96 to over 103 in the following months as capital fled to safety. This historical precedent supports the view that as long as the Middle East conflict remains a primary concern, the dollar will likely remain strong. However, the poor Nonfarm Payrolls data presents a serious challenge to the dollar’s strength. We must remember that during periods of extreme fear, such as the initial COVID-19 shock in March 2020, the dollar rallied hard even as US economic data collapsed. This suggests that the current geopolitical fears could continue to outweigh domestic economic weakness in the immediate future. Therefore, buying options to position for increased volatility is a prudent strategy. Purchasing out-of-the-money put options on GBP/USD can serve as effective insurance against a sharp decline if the geopolitical situation worsens or if US inflation remains stubbornly high. These positions can be structured to cover the next several weeks, offering a cost-effective way to navigate the current uncertainty. Create your live VT Markets account and start trading now.

Start trading now – Click here to create your real VT Markets account

Back To Top
server

Hello there 👋

How can I help you?

Chat with our team instantly

Live Chat

Start a live conversation through...

  • Telegram
    hold On hold
  • Coming Soon...

Hello there 👋

How can I help you?

telegram

Scan the QR code with your smartphone to start a chat with us, or click here.

Don’t have the Telegram App or Desktop installed? Use Web Telegram instead.

QR code