Standard Chartered strategist Nicholas Chia now expects the Reserve Bank of Australia to raise the cash rate to 4.10% at its 17 March meeting, after previously forecasting no change. The bank still expects another rise in Q2, lifting its terminal rate forecast to 4.35% from 4.10%, likely at the May meeting.
The change follows firm activity indicators and RBA communication that leaned towards tighter policy before the blackout period. The note also points to higher inflation expectations, with limited tolerance for any move away from stable short-term expectations.
Oil Price Shock And Inflation Expectations
Part of the rise in expectations is linked to an oil price shock. The RBA may look through that factor, but it may still respond to broader shifts in expectations.
The bank sees a high chance of a split board decision in March. It also says the 17 March call is close, with the main risk being the RBA holding rates to await more data such as quarterly core inflation.
The article was created using an AI tool and reviewed by an editor.
We are seeing a familiar pattern emerge as we approach the next Reserve Bank of Australia meeting. Looking back to this time in 2025, we saw a sudden pivot in expectations towards a rate hike due to firm economic activity and a worrying rise in inflation expectations. This created significant short-term volatility in the rates market.
Positioning Ahead Of The Rba Decision
The situation today, March 12, 2026, has echoes of last year, which warrants close attention. The latest monthly CPI indicator for February surprised slightly to the upside at 3.6%, and retail sales figures also beat forecasts, showing continued resilience in consumer spending. These are the same types of indicators that caused the market to reprice RBA expectations so quickly in 2025.
This shift is reflected in interest rate futures, which now imply a roughly 30% chance of a rate hike at next week’s meeting, up from just 15% a week ago. Given this rising uncertainty, traders should consider using short-dated options to hedge against a hawkish surprise from the RBA. Relying solely on a continued pause in the cash rate now carries significantly more risk.
However, we must also remember the outcome from March 2025, where the RBA ultimately chose to hold rates steady, despite the hawkish chatter, before hiking later in the second quarter. This historical precedent suggests the RBA board may again prefer to wait for more comprehensive quarterly data before acting. Therefore, strategies that profit from increased volatility, rather than a purely directional bet on a hike, may be the most prudent approach.
Create your live VT Markets account and start trading now.
Start trading now – Click here to create your real VT Markets account
Oil and Brent prices kept rising after reports that three commercial vessels were struck by projectiles near the Strait of Hormuz. Markets focused on the risk of disruption around the waterway.
IEA members agreed to release a record 400 million barrels of emergency reserves. This was more than double the 182 million barrels released after the Russian invasion of Ukraine in 2022.
Market Seen Release As Temporary
The release did not stop gains, as the action was treated as short-term support rather than a longer-term fix for supply risks linked to the Strait of Hormuz. Concern remained about further supply shocks.
President Trump said the IEA release would ease energy price pressures while the US continues its campaign against Iran. Oil market worries continued despite this statement.
Reports said President Trump may invoke the Cold War-era Defense Production Act to support oil production off Southern California. US Interior Secretary Doug Burgum said the law is “absolutely” under deliberation to help a Houston-based company drill and to bypass state-level permit issues.
The economic outlook was described as moving towards stagflation, with firm economic data offset by supply-side pressures. The article was produced using an AI tool and checked by an editor.
Looking Back From Early 2026
Looking back to 2025, the market correctly viewed the massive IEA emergency oil release as a temporary fix rather than a real solution. As of today, March 12, 2026, government data confirms over 80% of those 400 million barrels have already been absorbed by the market. This leaves the global supply system with a thinner cushion than it had a year ago.
The geopolitical risk premium remains high, as tensions in the Strait of Hormuz have not abated since the vessel strikes last year. Just last month, February 2026 trade data showed a 12% increase in shipping insurance premiums for tankers passing through the strait, reflecting the market’s ongoing fear of a sudden supply disruption. We believe any further escalation will cause a sharp price spike that is not fully priced in.
The US policy response that was deliberated in 2025 is proving to be a slow-moving solution. While the Defense Production Act was invoked to fast-track drilling, industry timelines show new significant production from these California projects is still over a year away. This domestic supply increase is a story for 2027, offering no relief for the tight market we face today.
The stagflationary environment we worried about has become a reality, with the latest reports showing US GDP growth for the last quarter at a weak 0.7% while inflation remains sticky at 4.2%. Historically, this combination makes the market extremely sensitive to commodity price shocks. Therefore, we expect any upward move in oil to be magnified by these broader economic fears.
Given this backdrop, we see opportunities in long-dated call options on Brent crude, which is currently trading near $97 per barrel. Current implied volatility is not fully capturing the risk of a sudden escalation in the Middle East. Buying calls provides a defined-risk method to gain upside exposure to the supply-side shocks we continue to anticipate in the coming weeks.
Create your live VT Markets account and start trading now.
Start trading now – Click here to create your real VT Markets account
EUR/JPY fell to about 183.55 in early European trading on Thursday, as safe-haven demand supported the Japanese Yen. NBC News reported Iran launched its “most intense operation since the beginning of the war”, firing advanced ballistic missiles towards Tel Aviv and Haifa, while Oman evacuated all vessels from Mina Al Fahal.
Ongoing Middle East tensions have increased demand for safe-haven assets, which can pressure the cross. On the euro side, ECB policymaker Isabel Schnabel said new quarterly forecasts will partly include the economic impact of the war in Iran.
Geopolitical Risk Drives Yen Demand
ECB Governing Council member Peter Kazimir said a rate hike may be nearer than previously thought, and the bank could act if the war lifts inflation expectations. Markets have raised expectations for ECB rate rises after these comments, with swaps implying faster tightening than earlier.
LSEG data shows the ECB is now seen hiking as soon as June. On the chart, EUR/JPY remains above the rising 100-day EMA near 181.40, with the RSI at 51.
Support is seen around 183.10, then 182.10 and 181.40. Resistance is near 184.90, then around 185.70.
The intense new conflict in the Gulf is driving money into the safe-haven Japanese Yen, pushing the EUR/JPY pair down. We are seeing a classic geopolitical reaction as traders seek safety from the missile attacks on Israel. This creates a direct headwind for the cross, despite other factors at play.
Options Strategies For Rising Volatility
We remember from the initial weeks of major conflicts, like the one that began in 2022, the CBOE Volatility Index (VIX) surged above 35, indicating extreme market fear. Current volatility gauges are also rising, with the VIX climbing 12% in the last 24 hours to 19.5, suggesting traders should prepare for wider price swings. This environment is ripe for option strategies that profit from increased volatility, such as straddles.
At the same time, the European Central Bank is signaling rate hikes to combat inflation, which could strengthen the Euro. Recent data shows Eurozone inflation unexpectedly rose to 2.8% last month, giving weight to policymakers’ hawkish comments. Markets are now pricing in a 75% chance of a 25-basis-point hike by the June meeting, creating a powerful upward force on the Euro.
For derivative traders, this means volatility is the main opportunity. Buying options can be more attractive than trading the spot price directly due to the uncertain direction. A long strangle, buying a put option with a strike near the 182.10 support and a call option with a strike near the 185.70 resistance, could profit if the pair breaks out of its current range.
Alternatively, those holding long positions should consider hedging their downside risk. Buying put options with a strike price below the key 181.40 support level offers a form of insurance against a significant escalation in the conflict. This level is critical because a sustained break below it would invalidate the current bullish structure we have been tracking.
Create your live VT Markets account and start trading now.
Start trading now – Click here to create your real VT Markets account
USD/CHF rose to about 0.7820 in early European trading on Thursday. The US Dollar gained against the Swiss Franc as higher oil prices raised inflation concerns and may lead to tighter US monetary policy.
The Middle East war increased fears of rising US inflation. The Federal Reserve is expected to keep rates unchanged at its 17–18 March meeting, with many economists projecting the next cut in June or July 2026.
Oil Prices Drive Inflation Fears
Oman evacuated all vessels from its Mina Al Fahal oil export terminal as a precaution, Bloomberg reported on Thursday. Iran began what it described as its most intense operation since the war began and stepped up efforts to disrupt the Strait of Hormuz.
Further tension could increase demand for safe-haven currencies such as the Swiss Franc. US data due on Friday include the January Personal Consumption Expenditures Price Index and the second estimate of fourth-quarter GDP.
We are seeing the US Dollar gain against the Swiss Franc as rising oil prices fuel inflation worries. Brent crude futures have recently climbed above $110 a barrel, a level not seen in over a year, increasing pressure on the Federal Reserve to delay any rate cuts. This environment favors a stronger dollar in the short term.
The escalating conflict in the Middle East, with Iran’s actions in the Strait of Hormuz, is the main driver of this uncertainty. While this currently supports the USD via higher oil prices, we must remember that the Swiss Franc is also a traditional safe-haven currency. We saw a similar dynamic in late 2025 where both currencies strengthened during initial shocks.
Key Risk Events Ahead
Traders should be cautious ahead of Friday’s US PCE inflation data. The last core PCE reading for December 2025 came in at a stubborn 3.1%, well above the Fed’s target. A surprisingly low number this week could quickly reverse the dollar’s recent gains and challenge the current uptrend.
Given this conflicting tug-of-war, purchasing volatility through options strategies appears prudent. Implied volatility on USD/CHF one-month options has already jumped to a six-month high of 9.5%. Strategies like straddles or strangles could benefit from a significant price move in either direction, whether from a hot inflation report or a major geopolitical escalation.
Next week’s Federal Reserve meeting on March 17-18 is widely expected to result in a rate hold, but the accompanying statement will be critical. The market has already adjusted, with futures now pricing in less than a 40% chance of a rate cut by June, down from 70% a month ago. Any hawkish language from the central bank could add further fuel to the dollar’s rally.
Create your live VT Markets account and start trading now.
Start trading now – Click here to create your real VT Markets account
Gold prices in Saudi Arabia fell on Thursday, based on data compiled by FXStreet. Gold was priced at SAR 620.68 per gram, down from SAR 624.55 on Wednesday.
The price per tola slipped to SAR 7,239.49 from SAR 7,284.62 a day earlier. FXStreet also listed SAR 6,206.80 for 10 grams and SAR 19,305.25 per troy ounce.
How FXStreet Derives Local Prices
FXStreet calculates local prices by converting international rates using the USD/SAR exchange rate and local units. Prices are updated daily at the time of publication and are for reference, with local rates able to vary slightly.
Central banks are the largest holders of gold. They added 1,136 tonnes worth around $70 billion in 2022, the highest annual purchase on record, according to the World Gold Council.
Gold often moves inversely to the US Dollar and US Treasuries. It can also move opposite to risk assets, and may rise when interest rates fall and weaken when borrowing costs rise.
The slight dip in gold prices we are seeing today is minor when viewed against the larger economic picture. We are currently facing uncertainty over the Federal Reserve’s next move, especially after their statements in January and February of this year reinforced a cautious, data-dependent stance on rate cuts. This hesitation has kept the US Dollar relatively firm, creating short-term headwinds for gold priced in dollars.
Central Bank Demand And Market Strategy
However, a strong floor of support remains firmly in place due to massive central bank buying. Looking back at 2025, we saw central banks add over 800 tonnes to their reserves in just the first three quarters, marking a record pace for that period. This trend of de-dollarization and reserve diversification by emerging market banks provides a significant buffer against price drops.
Gold’s role as a hedge against inflation is still very relevant, even as the rate of inflation has cooled from its peaks. The US Consumer Price Index, which lingered near 2.9% in late 2025, remains stubbornly above the central bank’s target, encouraging some investors to hold gold. Ongoing geopolitical tensions also continue to fuel demand for the metal as a safe-haven asset during turbulent times.
We should also consider the inverse relationship between gold and risk assets like stocks. After a strong rally in the S&P 500 for most of 2025, the market has shown signs of fatigue in the first quarter of this year. Any significant pullback in equities could trigger a rotation of capital into the perceived safety of gold.
For those trading derivatives, this creates a complex but opportunity-rich environment. The conflicting signals from central bank policy and physical demand suggest that options strategies could be effective for managing risk. Traders might consider using call options to position for a potential breakout if the Fed signals a more definitive pivot to easing, or utilizing spreads to trade the expected volatility in the coming weeks.
Create your live VT Markets account and start trading now.
Start trading now – Click here to create your real VT Markets account
Gold prices in the Philippines fell on Thursday, based on FXStreet data. Gold was priced at PHP 9,862.49 per gram, down from PHP 9,931.73 on Wednesday.
Gold also dropped to PHP 115,034.20 per tola from PHP 115,841.80 a day earlier. Other listed prices were PHP 98,625.13 for 10 grams and PHP 306,757.80 per troy ounce.
How FXStreet Calculates Local Gold Prices
FXStreet derives Philippine gold prices by converting international rates into PHP using the USD/PHP exchange rate and local units. Prices are updated daily at the time of publication and are for reference, as local rates may vary slightly.
Central banks are the largest holders of gold and increased reserves by 1,136 tonnes worth about $70 billion in 2022, according to the World Gold Council. This was the highest annual total since records began.
Gold often moves opposite to the US Dollar and US Treasuries, and it can also move opposite to shares. Prices can react to geopolitical tension, recession fears, interest rates, and changes in the US Dollar because gold is priced in dollars (XAU/USD).
The minor price drop in Philippine pesos is largely a currency effect and shouldn’t be the main focus. We are paying more attention to the inverse relationship between gold and the US dollar, especially as the dollar has softened following the Federal Reserve’s recent pause on interest rate cuts. This pause comes after a series of rate reductions we saw throughout the second half of 2025.
Options Strategies For Near Term Exposure
We view persistent buying from central banks as a strong support level for gold prices, a trend that continued robustly through 2024 and 2025 after the record-breaking purchases observed back in 2022. With recent data showing US inflation remaining sticky around 3.1%, the metal’s appeal as a hedge against inflation is growing. This environment makes holding long positions in gold futures a compelling strategy.
For the coming weeks, we see buying call options on gold as a prudent way to gain upside exposure. This allows traders to benefit from any sudden price rally driven by geopolitical news while limiting the maximum loss to the premium paid. This strategy positions us well for a potential re-test of the all-time highs gold briefly touched back in 2024.
However, for those with existing long positions, hedging against a potential downturn is wise. Purchasing out-of-the-money put options can provide a cost-effective insurance policy against an unexpected strengthening of the dollar or a more hawkish tone from the Fed. This protects profits from sudden market reversals.
Implied volatility has been ticking higher, which makes options more expensive. Therefore, we should also consider using bull call spreads to lower the cost of entry. This involves buying a call option at a specific strike price while simultaneously selling another call with a higher strike price for the same expiration.
Create your live VT Markets account and start trading now.
Start trading now – Click here to create your real VT Markets account
AUD/USD fell in Asia on Thursday, ending a four-day rise after reaching about 0.7185, its highest level since June 2022. It traded near 0.7130, down 0.30%, and earlier slid to 0.7125.
The US Dollar firmed as tensions involving Israel, US forces, and Iran reduced demand for risk assets. Higher Crude Oil prices raised inflation concerns, lowered expectations of near-term US Federal Reserve rate cuts, and pushed US Treasury yields higher.
Rba Outlook Shifts
In Australia, comments from RBA Deputy Governor Andrew Hauser led markets to bring forward expectations for a second rate rise as early as next week. This supported the Australian Dollar and limited further AUD/USD losses.
On the 4-hour chart, the pair held below the 200-period EMA and later moved above the 0.7130 level. RSI is near 55, and MACD remains slightly positive, though momentum has eased.
Support is around 0.7120, then 0.7080 and 0.7040, near prior lows and the 200-period EMA. A break below 0.7040 would point to 0.7000, while resistance is at 0.7150, then 0.7175 and 0.7220.
We recall that period in early 2025 when the pair was pulling back from a multi-year top near 0.7185, with many seeing the dip as a buying opportunity. That bullish sentiment was supported by a hawkish Reserve Bank of Australia which seemed ready to hike rates further. As of today, March 12, 2026, with the AUD/USD trading around 0.6650, the market dynamic has clearly shifted.
Drivers Behind The New Regime
The aggressive RBA stance we noted back then has reversed, as Australian inflation has cooled to 3.2%, prompting the central bank to cut the cash rate to 3.10%. While the US Federal Reserve has also started its own easing cycle, the interest rate differential still provides underlying support for the US dollar. This fundamental change is a primary reason the pair failed to hold onto gains above the 0.7000 level throughout last year.
The risk aversion that was pushing the US dollar higher has eased, but headwinds for the Aussie dollar have emerged from other areas. We have seen key commodity prices soften, with iron ore, a crucial Australian export, falling from over $130 a tonne in late 2024 to around $110 a tonne currently. This puts direct pressure on the Australian dollar’s valuation.
For derivative traders, this environment suggests that selling call options with strike prices well above current levels, perhaps around the old support of 0.7000, could be a viable strategy. The odds of a sharp rally back to those early 2025 highs seem low given the current central bank policies. Alternatively, traders expecting continued softness could consider buying put options with a strike below the 0.6600 support level.
The technical picture has soured significantly since we saw resilience above the 0.7100 mark. The previous support level around 0.7080 now represents a major long-term resistance area. Our focus in the coming weeks will be on whether the pair can defend the 0.6600 handle, as a sustained break below it could open the door to testing the lows from last year.
Create your live VT Markets account and start trading now.
Start trading now – Click here to create your real VT Markets account
Gold prices in the United Arab Emirates fell on Thursday, based on FXStreet data. Gold was priced at AED 607.38 per gram, down from AED 611.27 on Wednesday.
Gold also dropped to AED 7,084.36 per tola from AED 7,129.69 a day earlier. Other listed prices were AED 6,073.80 for 10 grams and AED 18,891.65 per troy ounce.
How Local Gold Prices Are Calculated
FXStreet produces local gold rates by converting international prices using the USD/AED exchange rate and local units. The figures are updated daily at publication time and are for reference, as local market rates may differ.
Gold is commonly used as a store of value and for jewellery, and is also treated as a safe-haven asset. It is also used as a hedge against inflation and currency weakness, since it is not backed by any single issuer or government.
Central banks are the largest holders of gold and use it to diversify reserves. They added 1,136 tonnes worth about $70 billion in 2022, the highest annual total on record.
Gold often moves inversely to the US Dollar and US Treasuries, and can also move against risk assets such as shares. Its price is affected by geopolitics, recession concerns, interest rates, and shifts in the US Dollar, as it is priced in dollars (XAU/USD).
Market Outlook And Trading Considerations
The minor dip in gold prices should be viewed as a tactical entry point rather than a change in trend. We are seeing US inflation data from February hold stubbornly at 3.1%, keeping it above the Federal Reserve’s target. This persistent inflation continues to fuel the debate around the US Dollar’s next major move, which directly impacts gold.
After a year of holding interest rates steady throughout 2025, central bank commentary is now shifting towards potential rate cuts later in 2026. Gold, being a non-yielding asset, typically strengthens in an environment of falling rates. We should consider using long-dated call options to position for this anticipated easing cycle in the coming months.
Underlying support for gold remains exceptionally strong, driven by institutional buying. We saw central banks globally add a net 1,037 tonnes to their reserves last year in 2025, showing their continued appetite for the metal. This consistent demand creates a solid price floor, making strategies like selling out-of-the-money puts attractive for generating income while we wait for the next leg up.
We must also consider gold’s role as a hedge against market shocks. The VIX volatility index is currently trading at a low level around 14, suggesting a high degree of complacency in the stock market despite ongoing geopolitical risks. Maintaining exposure through gold futures or ETFs is a prudent way to protect portfolios from any sudden flight to safety.
Create your live VT Markets account and start trading now.
Start trading now – Click here to create your real VT Markets account
NZD/USD stayed weak for a third day, trading near 0.5900 in Asian hours on Thursday. The pair fell as the US Dollar stayed firm, as higher energy prices lifted inflation risk and reduced the chance of Federal Reserve rate cuts.
The US Dollar Index rose towards three-month highs and traded near 99.50. Markets are watching US Personal Consumption Expenditures data due on Friday for more policy signals.
Inflation Data Keeps Dollar Supported
US CPI data released on Wednesday showed inflation rising 0.3% month-on-month in February and 2.4% year-on-year. Core CPI rose 0.2% month-on-month and 2.5% year-on-year.
The New Zealand Dollar remained under pressure as risk appetite fell amid tensions linked to the Middle East war. Higher energy prices also added to New Zealand inflation concerns, with expectations that domestic price pressures may last longer and keep the Reserve Bank of New Zealand on a tighter policy path.
We are seeing a familiar pattern of risk aversion driving US Dollar strength. Looking back, we saw similar dynamics in early 2025 when Middle East tensions caused the DXY to approach 99.50. Now, with the DXY holding firm around 104.30, the environment continues to favor the dollar as a safe haven.
The US inflation picture remains a central concern for the Federal Reserve, much like it was last year. Back in February 2025, the annual CPI print of 2.4% seemed manageable, but recent data for February 2026 shows inflation is proving sticky at 2.8%, keeping rate cut expectations at bay. This sustained inflationary pressure suggests that betting on continued dollar strength through call options on USD or put options on risk-sensitive pairs is a viable strategy.
Risk Sentiment And Options Strategies
For the New Zealand Dollar, the situation is complicated by domestic factors. Just as we saw in 2025, surging energy prices are fueling inflation, forcing the Reserve Bank of New Zealand to maintain a hawkish stance with its cash rate holding at 5.5% for over a year now. This creates a tug-of-war, with global risk-off sentiment weakening the NZD while domestic rate policy offers support, implying potential for volatility.
The geopolitical risk premium in energy markets has not disappeared. The surge in oil prices we witnessed in early 2025 has established a new floor, with WTI crude now trading persistently above $85 a barrel, a significant jump from the sub-$75 levels seen before that conflict. This elevated price floor continues to feed into global inflation data, forcing central banks to remain cautious.
Given this backdrop, traders should consider strategies that benefit from both dollar strength and potential volatility in the kiwi. Buying NZD/USD put options provides a clear directional play on further downside for the pair. For those uncertain of direction but expecting a significant price move, a long straddle could capture profits from a breakout driven by either RBNZ policy surprises or escalating global risk aversion.
Create your live VT Markets account and start trading now.
Start trading now – Click here to create your real VT Markets account
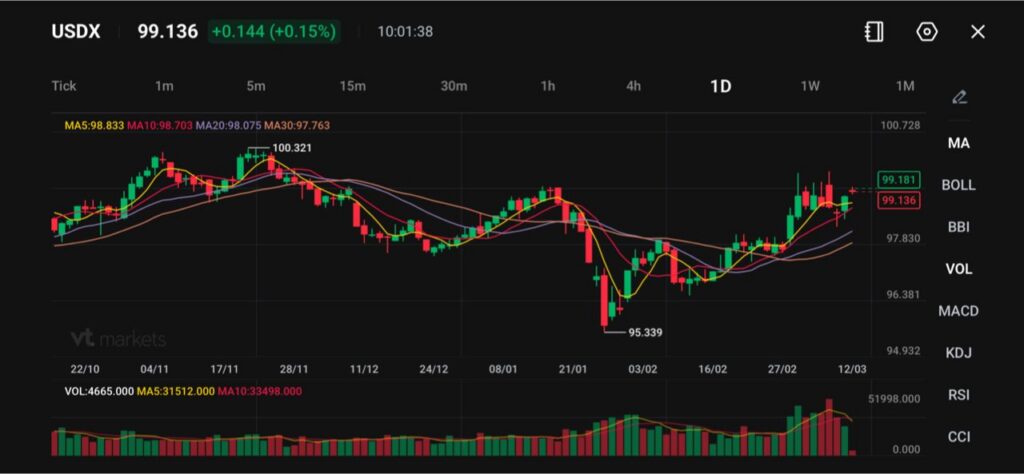
The US dollar index (USDX) trades around 99.136, up +0.144 (+0.15%), hovering near its strongest levels this year.
Brent crude surged above $100 per barrel, intensifying inflation concerns and lifting expectations for tighter central bank policy.
Markets are pushing back rate-cut expectations as oil-driven inflation risks grow, with traders increasingly pricing delayed easing from major central banks.
The US dollar extended its gains as oil prices surged, pushing the currency toward its strongest levels of the year. Traders have been moving back into the dollar as the global energy shock raises concerns about inflation and forces markets to rethink how quickly central banks can ease policy.
Rising oil prices increase energy costs across economies, which feeds into consumer prices and complicates the inflation outlook. This has strengthened the dollar as traders reduce bets on interest rate cuts and look for safety in the world’s reserve currency.
The dollar is the best haven bet as market volatility picks up during the Mideast conflict, according to Nathan Thooft of Manulife Investment Management, who says he’s shifted more of his investments to the US since hostilities erupted https://t.co/jG8GYsdd2X
The move has been broad across the currency market. The euro, yen, sterling and commodity-linked currencies all weakened against the dollar as energy volatility weighed on global risk sentiment.
If oil prices remain elevated, the dollar may continue to find support as markets adjust to the possibility that central banks keep policy tighter for longer.
Energy Dependence Shapes Currency Moves
Currency moves have largely reflected each economy’s dependence on imported energy. Countries that rely heavily on foreign oil and gas face worsening trade balances when energy prices surge.
This dynamic has pressured European and Asian currencies. Europe in particular faces greater exposure to energy shocks because of its dependence on imported oil and gas, which has weighed on the euro despite rising expectations that the European Central Bank may tighten policy.
A sharp swing in European money markets from bets on central bank interest-rate cuts to hikes has caught traders off guard, forcing some to exit options at hefty losses https://t.co/Ac4h2iAIm1
The Japanese yen also weakened toward the 159 per dollar level, approaching its weakest levels in nearly a year. Japan imports the vast majority of its energy needs, meaning higher oil prices quickly translate into economic pressure.
Commodity currencies have also felt the strain. The Australian and New Zealand dollars both slipped as traders reassessed global growth risks and rising inflation.
If energy prices remain volatile and supply disruptions persist, currencies tied to energy imports may continue to face pressure relative to the dollar.
Rate Expectations Shift Across Central Banks
The surge in oil prices has begun to ripple through interest-rate markets. Traders are increasingly questioning whether central banks can cut rates as quickly as previously expected if inflation pressures rise again.
Swaps markets now show expectations that some central banks could tighten sooner or delay easing cycles. The European Central Bank is increasingly expected to move earlier than anticipated, while the Reserve Bank of Australia may face renewed pressure to raise rates.
In the United States, traders have also scaled back expectations for rate cuts. Fed funds futures show markets pushing potential easing further into the year as inflation risks from energy prices rise.
A key measure of US inflation was tame at the start of the year. But another metric is shaping up to paint a very different picture https://t.co/xoKdT0a7Vt
If inflation expectations continue climbing alongside energy prices, central banks may adopt a more cautious policy stance, which would likely support the dollar and maintain volatility in global currency markets.
USDX Technical Outlook
The US Dollar Index (USDX) is trading near 99.14, up around 0.15%, as the dollar continues to hold its recent gains following the rebound from the 95.34 low earlier this year.
The index has been trending gradually higher over the past few weeks, reflecting renewed demand for the dollar amid heightened global uncertainty and shifting macro expectations.
From a technical standpoint, the index is currently trading above its key short-term moving averages. The 5-day moving average (98.83) and 10-day (98.70) are both trending upward and sitting just below the current price level, while the 20-day (98.07) and 30-day (97.76) remain further beneath the market.
This alignment indicates strengthening bullish momentum in the near term as the dollar attempts to extend its recovery.
Immediate resistance is located near 99.30–99.50, where recent rallies have stalled. A sustained break above this region could bring the index back toward the 100.00 psychological level, followed by the 100.32 area, which previously capped the broader advance.
On the downside, initial support is seen around 98.70–98.80, with stronger structural support near 98.00, where the 20-day moving average is currently positioned.
Overall, the short-term bias for the dollar remains moderately bullish, with the index consolidating near recent highs. A move above 99.50 would likely strengthen upward momentum toward the 100 handle, while failure to hold above the 98.70–98.80 support zone could trigger a deeper consolidation.
What Traders Should Watch Next
Oil price volatility and any renewed disruptions to shipping through the Strait of Hormuz.
Central bank messaging as inflation expectations rise alongside energy costs.
Currency reactions in energy-importing economies, particularly the euro and yen.
Whether USDX retests resistance near 100.321 as safe-haven demand strengthens.
Why is the US Dollar Strengthening Right Now? The US dollar is gaining support as oil prices surge and raise inflation concerns. Higher energy costs can delay interest rate cuts, which tends to strengthen the dollar because traders seek higher-yielding and safer assets.
What is the US Dollar Index (USDX)? The US Dollar Index (USDX) measures the strength of the dollar against a basket of six major currencies: the euro, Japanese yen, British pound, Canadian dollar, Swedish krona and Swiss franc.
Why Do Rising Oil Prices Support the Dollar? Higher oil prices increase inflation risks and push central banks to maintain tighter monetary policy. Since the United States is a net energy exporter, rising oil prices often benefit the dollar relative to currencies of energy-importing economies.
How Does the Strait of Hormuz Affect Currency Markets? The Strait of Hormuz is one of the world’s most important energy shipping routes. Disruptions there can push oil prices higher, increase inflation expectations and shift global capital flows toward safe-haven currencies like the dollar.
Why Are Interest Rate Expectations Changing? Surging energy prices increase inflation risks, making central banks more cautious about cutting interest rates. Markets are now pushing potential easing further into the year as policymakers monitor inflation pressures.
Start trading now – Click here to create your real VT Markets account