Germany’s Harmonised Index of Consumer Prices (HICP) rose by 0.4% month on month in February. The result matched the forecast of 0.4%.
The data shows consumer prices increased from the previous month. No other figures were provided in the release.
Market Volatility Outlook
The German inflation figure for February coming in exactly as forecast at 0.4% removes a key source of uncertainty for the market. This suggests that for the next few weeks, implied volatility in European assets may soften. We believe traders should reduce exposure to long volatility strategies.
This steady inflation print reinforces our view that the European Central Bank will not deviate from its current cautious policy path. Looking back at the series of gradual rate cuts that began in mid-2025, this data gives policymakers no reason to accelerate their actions. The market has priced this “wait and see” approach correctly.
Recent statistics support this outlook, with broader Eurozone core inflation for January 2026 slowing to 2.5%, down from the 2.9% we saw in the final quarter of 2025. This consistent, gradual decline towards the 2% target validates a strategy of avoiding bets on any sudden policy shifts. A stable policy environment is the most likely outcome.
For equity derivatives, this suggests selling premium on indices like the DAX could be a prudent approach. With the VSTOXX volatility index recently trading near post-2025 lows of around 14, selling covered calls against long stock positions or initiating bull put spreads can take advantage of expected market calmness. This allows for income generation in a market that is not expecting any major shocks.
In the interest rate markets, the predictability of this inflation data anchors the front end of the EURIBOR futures curve. We see little value in positioning for a surprise at the next ECB meeting. Traders should instead consider calendar spreads that bet on this stability continuing through the second quarter of 2026.
Currency Implications
This data point also offers little impetus for a major move in the Euro, especially against the US dollar. With the Federal Reserve signaling its own steady policy, the interest rate differential is unlikely to change dramatically in the near term. This makes range-trading strategies using options on the EUR/USD pair an attractive possibility.
Create your live VT Markets account and start trading now.
Start trading now – Click here to create your real VT Markets account
Gold futures in New York fall 0.7% to $5,204.40 a troy ounce, while spot remains above the $5,200 mark amid mixed Middle East signals.
ANZ says conflict updates “obscure the outlook for interest rate cuts in the U.S.” and traders withdraw increasing amounts of gold from ETFs.
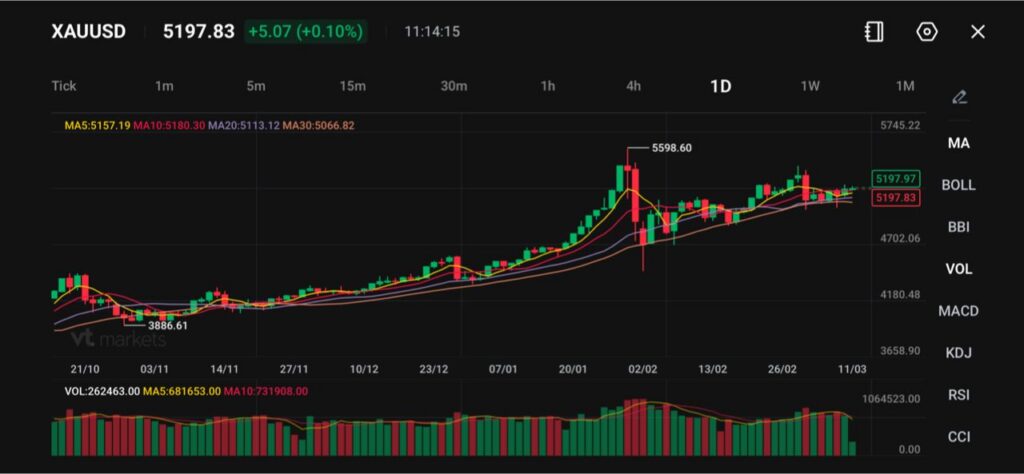
XAUUSD trades at 5197.83, up +5.07 (+0.10%), with MA5 5157.19, MA10 5180.30, MA20 5113.12, MA30 5066.82, plus a recent swing high at 5598.60 and prior low at 3886.61.
Gold Faces a Two-way Push From Headlines and Rates
Gold eased in early trading yet stayed above $5,200 as traders weighed mixed messaging on the Middle East conflict. The market had gained in the prior session as a softer dollar and falling oil prices reduced near-term inflation fear. That shift can support bullion because it lowers the hurdle for Fed cuts and trims real yields.
Gold was little changed, as traders digested conflicting statements by US officials over the war in the Middle East that added to extreme volatility in energy markets https://t.co/SvbAWyoCGQ
At the same time, traders still struggle to price the rate path. ANZ’s point matters here: “the developments continue to obscure the outlook for interest rate cuts in the U.S.” When the path for cuts looks less clear, gold can lose momentum even if geopolitics stays tense.
If oil continues to fall and the dollar stays soft, gold can hold above $5,200 and try to grind higher. If yields rise again on inflation fear, gold may rotate lower even if headlines keep the safe-haven case alive.
ETF Flows Turn Into A Pressure Point
ANZ flagged that traders are withdrawing increasing amounts of gold from ETFs. ETF flows matter because they often reflect broader portfolio behaviour rather than short-term trading. When traders pull metal from ETFs, it can cap rallies and make breakouts harder to sustain.
Against the backdrop of a more accommodating regulatory tone from the Trump administration, the SEC is raising concern over increasingly aggressive fund structures. https://t.co/Hj4tH3TVbT
This does not mean gold must fall. It does mean gold may need fresh catalysts, such as softer inflation prints or a deeper risk-off move, to offset the flow drag.
If ETF outflows persist, gold may need stronger macro support to reclaim recent highs. If flows stabilise or reverse, price can respond quickly because positioning becomes lighter.
US Inflation Data Sets The Next Direction
Traders now wait for US inflation data later this week for clearer guidance on the interest-rate outlook. CPI and PCE can shift the curve fast because they affect how markets price the next Fed move. Reuters reporting this week has kept that “data first” mindset front and centre for bullion.
The current price action fits that setup. New York gold futures are down 0.7% to $5,204.40 a troy ounce, which reads like caution ahead of data rather than panic selling.
A hotter print can lift yields and pressure gold, even if spot stays above $5,200 early on. A softer print can revive cut pricing and support a move higher, but the market may still react in sharp bursts due to headline risk from geopolitics.
Technical Analysis
Gold (XAUUSD) is trading near 5,198, up modestly by around 0.10%, as the metal continues to consolidate following the pullback from the 5,598.60 peak earlier in the year. Recent price action shows the market stabilising within a relatively narrow range, suggesting a period of digestion after the strong bullish rally seen through January.
From a technical perspective, gold is hovering around its short-term moving averages. The 5-day moving average (5,157) sits slightly below the current price, while the 10-day (5,180) is almost aligned with the market, reflecting a balanced short-term structure.
Meanwhile, the 20-day moving average (5,113) and 30-day (5,066) remain below current levels and continue trending upward, reinforcing the broader bullish trend.
Immediate resistance is located around 5,250–5,300, where recent upward attempts have struggled to gain traction. A sustained break above this zone could bring the market back toward 5,400, followed by the previous high near 5,600. On the downside, initial support is seen near 5,100, aligning with the 20-day moving average, with stronger structural support closer to 5,000.
Overall, gold appears to be consolidating within a longer-term uptrend, with price currently moving sideways as the market absorbs earlier gains. Holding above the 5,100 region keeps the bullish structure intact, while a breakout above 5,300 would likely signal renewed upward momentum toward recent highs.
What to Watch Next
Whether New York futures hold the 0.7% dip at $5,204.40 without follow-through selling.
Any shift in ETF flow momentum as traders “withdraw increasing amounts of gold from ETFs.”
CPI and PCE reactions, because rate-cut clarity remains the main driver when the conflict narrative sends mixed signals.
Why is Gold Still Above $5,200 if Prices Fell in Early Trading? Gold held above $5,200 because buyers still treat the level as a buffer while the market digests mixed Middle East signals and waits for US inflation data. The pullback looks more like positioning and uncertainty than a clean shift in trend.
What Does “Mixed Messages” on the Middle East Conflict Mean for Gold? It keeps the safe-haven case alive, but it also increases day-to-day whipsaws. If markets think escalation risk is fading, gold can soften. If traders fear renewed disruption, gold can firm quickly. This push-pull often keeps price range-bound near major levels like $5,200.
Why Did Gold Gain in the Previous Session? Bullion gained as a softer dollar and falling oil prices eased inflation concerns. When oil falls, markets often assume less inflation pressure, which can make rate cuts more plausible and support gold.
Why Do Interest Rate Cut Expectations Matter for Gold? Gold does not pay interest. When investors expect fewer rate cuts, yields can stay higher, which raises the opportunity cost of holding gold. That is why ANZ said recent developments “obscure the outlook for interest rate cuts in the U.S.”
What Are Gold ETF Outflows, and Why Do They Matter? ETF outflows mean investors are reducing holdings in gold-backed exchange traded funds. ANZ said investors withdraw increasing amounts of gold from ETFs. Persistent outflows can cap rallies because they reflect slower, portfolio-level selling rather than short-term trading noise.
Start trading now – Click here to create your real VT Markets account
Gold fell below $5,200 and set a new daily low during the European session on Wednesday. A firmer US Dollar, after rebounding from a one-week low, weighed on the metal.
The US Dollar move was tempered by expectations that lower crude oil prices may allow the Federal Reserve to cut interest rates. This reduced support for the Dollar and limited gold’s decline.
Key Drivers In Todays Trade
Crude oil pulled back after a rally to its highest level since June 2022. The drop followed comments from US President Donald Trump suggesting the Middle East war could end soon.
The Wall Street Journal reported that the International Energy Agency has proposed the largest release of oil reserves in its history. The plan aims to lower crude prices during the US-Israel conflict with Iran.
Fighting continued, with Iran facing heavy US-Israeli strikes on Tuesday. The IRGC said it was expanding operations and targeting technological infrastructure in the region.
Traders awaited US CPI data due later on Wednesday. Attention then turns to the US PCE Price Index on Friday.
Technical Snapshot And Key Levels
Technically, gold broke above the rising 100-hour SMA but lacked follow-through. MACD (12, 26, close, 9) stayed below its signal line, while RSI (14) fell from above 70 to the mid-50s.
Resistance was cited near $5,228, then $5,260. Support levels were $5,190, $5,160, and $5,140.
With Gold pulling back below $5,200, we see this as a temporary pause before the next move higher. All eyes are on the US Consumer Price Index (CPI) report due later today, which will heavily influence the Federal Reserve’s path on interest rates. Any signs of a corrective dip towards the $5,190 support level should be viewed as a potential entry point for long positions.
We should consider buying call options or selling cash-secured puts to capitalize on the underlying bullish trend. The ongoing conflict between a US-Israeli coalition and Iran provides a strong geopolitical floor for gold prices, acting as a safe-haven asset. This backdrop suggests that sharp drops are unlikely to last long as long as military tensions remain high in the Middle East.
Looking at recent data, the trend supports this view. The February 2026 CPI report showed inflation easing to 2.8% year-over-year, and the market, according to the CME FedWatch tool, is pricing in over a 70% probability of a Fed rate cut by June. We saw a similar dynamic in early 2022 after the invasion of Ukraine, when gold rallied over 10% in just a few weeks on the back of geopolitical uncertainty and shifting central bank expectations.
The sharp retreat in crude oil prices further strengthens our bullish conviction for gold. After the International Energy Agency proposed a massive release from strategic reserves, oil prices have fallen significantly, easing concerns that a war-driven energy spike would reignite inflation. This gives the Federal Reserve more flexibility to proceed with anticipated interest rate cuts, which is fundamentally positive for non-yielding gold.
However, the primary risk remains a surprisingly high inflation number from today’s CPI release. A hot print would challenge the rate cut narrative, likely strengthening the US Dollar and pushing gold down toward the more critical $5,160 support zone. To manage this event risk, traders could wait until after the data is released to initiate new positions or purchase short-term put options to hedge existing long exposure.
Create your live VT Markets account and start trading now.
Start trading now – Click here to create your real VT Markets account
RBC Economics said higher oil prices caused by current supply disruptions are unlikely to lead to a major change in Bank of Canada policy. It expects the Bank to keep interest rates on hold through 2026.
The note compared today’s move in oil with 2015, when the Bank cut the overnight rate by 50 basis points after prices fell. It said the 2015 drop was linked to a rise in US production capacity seen as structural.
Oil Shock Seen As Temporary
It said current disruptions are linked to geopolitics and may not be seen as lasting enough to change long-term investment trends in Canada’s oil sands. It added that oil prices could stay high if conflict continues, but it is still hard to judge duration.
Bank of Canada Deputy Governor Sharon Kozicki recently said the policy response to supply shocks depends on their size and duration. Short-lived shocks with limited economic effects are often met by a “look-through” approach.
The article said higher energy prices lift headline inflation but can also cut household purchasing power and weaken demand elsewhere, widening the output gap. It said the recent oil price rise has been large, but that it is too early for the Bank to act without clearer information.
Given the Bank of Canada is expected to hold rates steady, we should not position for rate hikes in response to the recent oil price spike to over $115 for WTI. The central bank is clearly signaling it sees this as a temporary geopolitical event, not a structural shift like we saw back in 2015. This means any derivative trades based on a hawkish BoC pivot are likely to underperform in the coming weeks.
Rates Volatility Strategy
This expectation of stability suggests a strategy of selling volatility in the interest rate market. Implied volatility on options for Bankers’ Acceptance futures (BAX) should decline as the market prices out the possibility of a near-term rate move. We remember the volatility during the 2022 and 2023 hiking cycles, and the current environment feels much calmer, making short straddles or strangles on short-term rates a viable approach.
The Canadian dollar’s reaction will be crucial, as its link to oil may weaken if interest rate differentials with the U.S. don’t move in its favor. While high energy prices are supportive, the lack of a policy response from the BoC could cap the loonie’s gains, especially against the US dollar. We could see USD/CAD remain stubbornly high or even climb, creating opportunities in currency options that bet against significant CAD strength.
Recent data supports the Bank’s cautious stance and our trading view. The latest CPI figures for February 2026 showed headline inflation rose to 3.1% due to energy, but core measures held steady near 2.5%. Furthermore, January’s retail sales data showed a 0.5% contraction, indicating higher energy costs are already pinching consumers and weakening domestic demand.
Create your live VT Markets account and start trading now.
Start trading now – Click here to create your real VT Markets account
AUD/USD rose to about 0.7170 in early Wednesday trading, placing the Australian dollar near a three-year high against the US dollar. The move followed expectations of a more hawkish Reserve Bank of Australia.
RBA Deputy Governor Andrew Hauser said rising oil prices could push inflation above the 4.2% forecast, with the impact dependent on how large and lasting the shock is. Markets are pricing in nearly a 75% chance of a 25 basis point rise to 4.1% next week.
Technical Picture And Key Levels
On the charts, the pair remains above the rising 100-day exponential moving average and trades near the upper Bollinger Band. The RSI is around the mid-60s, still positive and not at extreme levels.
Support is seen at 0.7120, with nearby levels at 0.7100 and the Bollinger mid-band just below 0.7050. Further support sits at 0.7020 and 0.6960, while resistance is at 0.7240 and 0.7300.
The Australian dollar is often influenced by RBA interest rates, Chinese economic demand, and commodity prices such as iron ore. Iron ore is Australia’s largest export at $118 billion a year, based on 2021 data.
Looking back at the analysis from 2025, we saw a strong bullish case for AUD/USD approaching 0.7200. This was driven by expectations of a Reserve Bank of Australia rate hike due to inflation fears, which seemed very credible at the time. Today, however, the situation has completely inverted, and holding onto that bullish bias would be a significant mistake.
Strategy Implications For Derivative Traders
The primary driver last year, a hawkish RBA, has now faded. Australian inflation has cooled considerably, with the latest annual figure from February 2026 coming in at 2.9%, well within the RBA’s target band. Consequently, the central bank has held the cash rate steady at 3.60% for its last four meetings, with market pricing now suggesting a potential rate cut later this year.
Furthermore, two of the Aussie dollar’s other key drivers are showing signs of weakness. Iron ore, a crucial export, has seen its price slide to around $115 per tonne, a stark contrast to the highs we saw in 2025. This is largely due to faltering demand from China, whose recent manufacturing PMI registered a contraction at 49.8, indicating ongoing economic headwinds for our largest trading partner.
Given this reversal, derivative traders should consider strategies that benefit from range-bound action or further downside in AUD/USD, which is currently trading near 0.6650. Buying put options with strike prices below 0.6600 offers a clear directional play on further weakness. This strategy allows traders to profit from a fall in the currency pair while capping their maximum loss at the premium paid.
For those who believe the RBA’s neutral stance will lead to a period of low volatility, selling straddles could be an effective strategy. By selling both a call and a put option with the same strike price, for example at 0.6650, traders can collect premiums from the market’s lack of movement. This position is profitable as long as the AUD/USD stays within a defined range until the options expire.
It is crucial to watch the current trading range between roughly 0.6500 and 0.6750. Any options strategy should place stop-losses beyond these boundaries, as a decisive break could signal a new trend. The fundamental picture has shifted from the hawkish outlook of 2025, and our trading positions must now reflect this new, more cautious environment.
Create your live VT Markets account and start trading now.
Start trading now – Click here to create your real VT Markets account
Brent and WTI saw sharp price moves as the Strait of Hormuz stayed effectively closed, limiting shipping. Brent traded in a USD81–95 range in one day, a 15% swing.
Oil prices fell after US Energy Secretary Chris Wright posted, then deleted, a message saying the US Navy had escorted an oil tanker through the strait. Further market movement followed social media posts from President Trump about mines and calls for Iran to remove any explosives.
Supply Cuts And Market Shock
Saudi Arabia, Iraq, the UAE, and Kuwait cut output due to limited storage capacity. Estimates put the combined reduction at 6.7 million barrels per day, about 6% of global oil supply.
G7 governments asked the International Energy Agency to prepare scenarios for releasing emergency oil stockpiles. The IEA oversees the use of OECD oil reserves and said member governments will assess supply security and market conditions before any decision.
We remember the extreme price swings in 2025 when the Strait of Hormuz was effectively closed, causing Brent crude to whip between an $81-$95 range. That supply shock, which cut global oil output by an estimated 6.7 million barrels per day, showed us how quickly geopolitical events can dominate the market. The frantic social media messages and the potential for an IEA stockpile release at the time created a blueprint for modern energy crises.
That experience from 2025 is critical for us today, as similar tensions continue to affect key shipping lanes. For instance, OPEC+ recently confirmed it will maintain its voluntary production cuts of 2.2 million bpd through the second quarter of 2026, keeping the supply side tight. This underlying tightness means any new disruption could have an exaggerated effect on prices.
Options Strategies For Volatile Markets
Given this backdrop, buying options is a key strategy for navigating potential price shocks in the coming weeks. This provides exposure to large upward or downward moves while defining risk to the premium paid. The CBOE Crude Oil Volatility Index (OVX) has been trading above 30, a level not consistently seen since that crisis period in 2025, suggesting the market is already pricing in significant uncertainty.
For those of us wanting to manage costs, using vertical spreads on Brent or WTI futures is a sensible approach. This allows for a defined risk-reward on directional bets without being fully exposed to the high premiums caused by volatility. It is a more conservative way to position for a price move while protecting capital from sudden reversals.
We should also anticipate increased hedging activity from major consumers like airlines and shipping companies, who were severely impacted during the 2025 disruption. This demand for upside protection could make call options relatively more expensive than puts. This creates potential opportunities in skew trading for experienced traders who can capitalize on the pricing differences.
Looking back, the 15% price swing seen during the 2025 Hormuz disruption was sharp, but it pales in comparison to the volatility spikes during the 2008 financial crisis when oil prices fell over 70% in five months. This history teaches us that supply shocks can be followed by severe demand destruction if the global economy is impacted. Therefore, traders should remain agile and consider downside protection through puts, even as they watch for upside risks.
Create your live VT Markets account and start trading now.
Start trading now – Click here to create your real VT Markets account
Please note that the dividends of the following products will be adjusted accordingly. Index dividends will be executed separately through a balance statement directly to your trading account, and the comment will be in the following format “Div & Product Name & Net Volume”.
Please refer to the table below for more details:
The above data is for reference only, please refer to the MT4/MT5 software for specific data.
If you’d like more information, please don’t hesitate to contact [email protected].
EUR/JPY rose to about 183.90 in early European trading on Wednesday, with the Yen easing against the Euro. Markets are unsure about how fast the Bank of Japan will move towards policy normalisation, while Germany’s final HICP reading is due later on Wednesday.
A Reuters poll on Wednesday found that all 64 respondents expect the BoJ to keep rates unchanged at 0.75% at next week’s meeting. In the same poll, 60% of economists forecast the policy rate will reach 1.00% by the end of June, compared with 58% in February.
BoJ Outlook And Market Uncertainty
BoJ Governor Kazuo Ueda said last week that interest rates may be held for longer because of possible economic effects from the Middle East conflict. Rising tensions, including threats to the Strait of Hormuz, may support the Yen as a safe-haven currency and limit gains in the pair.
Iran’s Islamic Revolutionary Guard Corps warned that Iran could block regional oil exports if US and Israeli attacks continue. On Wednesday, the IRGC said it had begun targeting the enemy’s technological infrastructure in the region, increasing concerns about a prolonged conflict.
Looking back to late 2025, we saw the EUR/JPY cross push towards 184.00, driven by uncertainty over the Bank of Japan’s path to normalization. That doubt about the BoJ’s pace was well-founded, as they have been very cautious since. The key driver then, as it is now, is the difference in central bank policy.
Today, the Bank of Japan’s policy rate sits at 1.00%, exactly where economists predicted it would be by mid-2025, but it has not moved since. With core inflation in Japan hovering around a stubborn 2.2%, the BoJ remains hesitant to signal further aggressive hikes. This contrasts with the European Central Bank, which has held its main rate at 3.0% to combat its own inflation issues, creating a significant yield advantage for the Euro.
Strategy Implications For Eurjpy Traders
For traders, this wide interest rate differential continues to make the carry trade—holding the higher-yielding Euro against the lower-yielding Yen—an attractive base strategy. We can see this reflected in the options market, where implied volatility for EUR/JPY has settled into a lower range compared to the peaks of 2024 and 2025. This suggests that traders could consider selling puts to collect premium, betting that the interest rate gap will provide a floor for the currency pair.
The geopolitical risks in the Middle East that we were watching closely in 2025 remain a crucial wildcard. While a full blockade of the Strait of Hormuz did not materialize, intermittent disruptions have caused periodic spikes in safe-haven buying for the Yen. These events are a key risk to the carry trade, and buying cheap, out-of-the-money EUR/JPY puts can serve as a valuable hedge against a sudden escalation.
Therefore, the current environment suggests a strategy of being long EUR/JPY to capture the yield difference, possibly structured through options to define risk. We should stay alert for any hawkish shift from the BoJ or, more critically, any flare-up in global tensions that could rapidly unwind these positions. Data from Japan’s national wage negotiations next week will be a critical indicator of future inflationary pressure and potential BoJ action.
Create your live VT Markets account and start trading now.
Start trading now – Click here to create your real VT Markets account
AUD/JPY rose for a fourth day in a row in Wednesday’s Asian session, reaching its highest level since 1990. It traded around the mid-113.00s, up 0.90% on the day.
The move followed firmer expectations that the Reserve Bank of Australia could raise interest rates as soon as next week. On Tuesday, RBA Deputy Governor Andrew Hauser said there would be a genuine debate on whether to raise rates at the meeting next week, due to concern about a possible war-driven rise in inflation.
Drivers Behind The Move
The Japanese yen weakened as the chance of an immediate Bank of Japan rate rise eased. Higher oil prices raised worries about slower growth and higher inflation in Japan, a major energy importer.
Rising energy costs were linked to the risk of stagflation, which could complicate BoJ policy normalisation. This kept pressure on the yen and supported AUD/JPY.
Some market participants expected Japanese authorities to act to limit further falls in the yen. Attention now turns to the RBA policy meeting next Tuesday.
A correction dated March 11 at 08:18 GMT clarified the pair reached its highest level since 1990, not an all-time peak.
Looking Back One Year
Looking back at that period a year ago, we saw the AUD/JPY cross break above 113.00, driven by a clear divergence in central bank policy. The market was correctly pricing in imminent rate hikes from the Reserve Bank of Australia while the Bank of Japan was expected to remain passive. This was the classic setup for a strong carry trade.
That fundamental trend did indeed play out, as the RBA hiked its cash rate multiple times through 2025 while the BoJ only exited its negative interest rate policy late in the year. This widening interest rate differential provided the fuel for the pair’s sustained rally. We can see from historical charts that buying during any minor dips proved to be a very profitable strategy throughout last year.
Today, on March 11, 2026, the situation has matured, with the pair trading significantly higher near 118.00. The RBA cash rate is now holding steady at 4.85% after inflation proved sticky, while the BoJ’s policy rate sits at just 0.10%. The explosive upward momentum has slowed as the bulk of the central bank divergence is now priced in.
For derivative traders, this means the simple strategy of buying calls may be less effective than it was when momentum was high. Instead, we should consider strategies that benefit from the large interest rate differential, such as selling out-of-the-money JPY call/AUD put options. This collects premium while the pair likely trades in a more stable, albeit elevated, range.
The significant yield gap of over 4.75% still makes being long the Australian dollar attractive for its carry, or positive income. This environment favors strategies like buying AUD/JPY futures contracts and rolling them to collect the funding rate. Any pullbacks should be viewed as opportunities to enter these carry positions at better levels.
We must remain vigilant for any verbal intervention from Japanese finance officials, which caused sharp but temporary drops in 2025 when the yen weakened too quickly. Furthermore, Australian inflation data is now the key driver; any signs of a faster-than-expected cooling could bring forward RBA rate cut expectations and unwind this trade.
Create your live VT Markets account and start trading now.
Start trading now – Click here to create your real VT Markets account
NZD/USD traded around 0.5930 in Asian hours on Wednesday and stayed below 0.5950 after giving up earlier gains. The New Zealand Dollar had found support as markets increased bets on an RBNZ rate rise in 2026, linked to domestic inflation concerns following higher oil prices.
Crude oil prices were volatile amid uncertainty around the Iran conflict and shipping through the Strait of Hormuz. The Wall Street Journal reported that the IEA is considering its largest-ever oil reserve release, while shipping disruption through the Strait of Hormuz continued.
Rbnz Rate Expectations And Inflation Outlook
Analysts expect New Zealand inflation to be more persistent than the central bank expects, leading markets to price in rate hikes in 2026. This differs from last month, when the RBNZ indicated the official cash rate would likely stay around 2.25% throughout the year.
The US Dollar edged lower after modest gains in the previous session, but could firm on safe-haven demand linked to the Middle East situation. Donald Trump said late Monday the conflict could end soon, while US officials said on Tuesday that military operations were intensifying in Iran and prospects for talks were limited, Reuters reported.
The RBNZ targets inflation between 1% and 3%, with a focus near the 2% mid-point. China’s economy and dairy prices can also affect the Kiwi, while shifts in risk sentiment often move NZD.
The NZD/USD is caught between Middle East tensions pushing it down and expectations of a local rate hike pushing it up. This environment suggests volatility will be high in the coming weeks. We should consider strategies like buying straddles that profit from a large price move in either direction, regardless of which force wins out.
Near Term Trading Strategy And Volatility
In the immediate term, the path of least resistance appears to be lower as the conflict in Iran intensifies safe-haven demand for the US Dollar. With West Texas Intermediate crude oil recently breaking above $95 a barrel for the first time this year, risk aversion is the dominant theme. We see value in buying near-term put options targeting a move below the 0.5900 level.
However, we must watch for a floor to form, as the market is pricing in a rate hike from the Reserve Bank of New Zealand later this year. The last quarterly inflation report from Stats NZ showed the Consumer Price Index at a stubborn 4.5%, well outside the RBNZ’s target range, reinforcing this hawkish outlook. This suggests that any significant dips in the NZD/USD could be buying opportunities for longer-dated call options.
We saw a similar pattern back in 2025 when concerns over the Chinese property market initially weakened the Kiwi, only for strong domestic dairy prices to reverse the trend sharply. This historical price action supports our view that while global risk sentiment can dominate for a few weeks, local economic factors will eventually reassert themselves. Therefore, our short-term bearish stance should be managed carefully, with an eye to pivot as sentiment shifts.
Create your live VT Markets account and start trading now.
Start trading now – Click here to create your real VT Markets account