Silver (XAG/USD) fell 0.30% on Thursday and did not break above resistance at $81.00. It was trading at $78.73 after reaching a daily high of $80.86.
The chart showed a lower high and a lower low, with back-to-back doji candles. This points to indecision near $81.00 while the Relative Strength Index (RSI) stayed bullish but moved flat, suggesting consolidation.
Key Technical Signals Near Resistance
A move above $81.00 would open the way to the 2025 high at $83.75 and then March’s 10-cycle high at $90.01. Further gains could target the March 2 peak at $96.39, followed by the $100 level.
If price drops below the 100-day Simple Moving Average (SMA) at $76.94, the next levels are the 20-day SMA at $73.36 and then $70.00. These are the key downside support areas mentioned.
Looking back at the market in 2025, the indecision near the $81 resistance was a key signal for us. Those back-to-back doji candles suggested a big move was coming, but the direction was unclear. This was a classic setup for using options strategies like straddles to profit from a breakout in either direction.
The weakening bullish pattern we saw then, coupled with a strengthening dollar, made the risk of a drop below $76.94 very real. The U.S. Dollar Index (DXY) did briefly climb above 105 in late 2025, validating those short-term concerns. For those holding long positions, buying put options with a strike price around $75 would have been a prudent way to hedge against a potential slide toward the $70 mark.
Ultimately, the consolidation resolved to the upside, as the dollar’s strength faded into early 2026. As we see today with silver trading around $85, the break above the $81 level was the decisive move. This rally has been supported by strong fundamentals, with industrial demand for silver projected to rise by 4% in 2026, largely due to solar and EV manufacturing.
Options Positioning And Next Resistance Levels
With the market having broken past the 2025 high of $83.75, our focus shifts to the next major resistance levels noted last year, like the $90 mark. Implied volatility has been rising, so selling cash-secured puts below current support could be a strategy to collect premium while waiting for a pullback. We are also seeing significant open interest in call options at the $95 and $100 strike prices for the end of the year, indicating where some traders expect the price to go.
China’s exports to the US have fallen, increasing the role of Japan, South Korea and Taiwan in providing trade surpluses to the US. Across all trading partners, the three economies recorded a combined $40bn surplus in January, with a rolling three-month average of $30bn.
The Bank of Korea has warned the current supply shock could be worse than 2022–2023. This could shift the region from large surpluses into trade deficits and reduce capital outflows linked to surplus recycling.
Capital Flow Reversal Scenarios
If the combined position moved from a $40bn surplus to more than $30bn in deficits, that would be a $70bn single-month change in capital outflows, assuming full recycling. On a three-month rolling basis, the swing could reach $150bn, moving from a $30bn positive average to -$20bn.
The combined surplus drop for China, Taiwan and South Korea for intervention purposes exceeded $100bn in March alone. This is cited as evidence that a $150bn fall in recycling flows is possible.
We should be preparing for a significant reversal of capital flows from Asia, which could spark major currency moves in the coming weeks. The concern is that the large trade surpluses from South Korea, Taiwan, and Japan are about to flip into deficits, removing a key pillar of support for global markets. This suggests we should position for weakness in the Korean won (KRW), Taiwanese dollar (TWD), and Japanese yen (JPY) against the U.S. dollar.
This warning is already being validated by recent data. South Korea’s trade surplus for March 2026 just came in at a razor-thin $0.8 billion, a steep drop from the $4.3 billion surplus seen in February, as rising energy import costs bite into export gains. Looking back, we saw similar pressures build in late 2025, but the current pace of deterioration appears much faster.
Trading And Hedging Implications
For traders, this points towards buying U.S. dollar call options against these Asian currencies to profit from their potential decline with managed risk. The expected capital flow swing, potentially reaching a $150 billion reversal on a three-month basis, will almost certainly spike foreign exchange volatility. Therefore, buying straddles or strangles on currency ETFs is a viable strategy to trade this expected increase in price movement.
The situation in Japan is particularly acute, where the yen has continued to weaken past 162 to the dollar this month, despite the Bank of Japan’s minor rate hike in February 2026. This shows that monetary policy is failing to counter the larger trade and capital flow dynamics. This reinforces the case for long USD/JPY positions.
A reduction in these Asian surpluses means less money being recycled into U.S. government bonds. We are already seeing the 10-year Treasury yield creep back up towards 4.50%, a level not seen since the brief scare in the third quarter of 2025. We should consider using derivatives to position for higher U.S. interest rates, such as shorting Treasury note futures.
This potential trade shock would also directly impact the equity markets of these export-driven nations. Their benchmark indices, like the KOSPI and Nikkei, have already shown signs of stalling in early April 2026 after a strong first quarter. Hedging strategies, such as buying put options on ETFs like EWY for South Korea or EWJ for Japan, should be considered to protect against a downturn.
The US Dollar Index (DXY) traded near 98.20 amid disrupted shipping in the Strait of Hormuz, including reports of a “double blockage” and partial tanker movement. Iran proposed a transit toll paid through its domestic banking system, while talks between Washington and Tehran remained unconfirmed, with President Donald Trump indicating a possible weekend meeting.
A 10-day ceasefire between Israel and Lebanon was due to start at 5:00 pm EST on Thursday. Israel said forces would remain in the South Lebanon buffer zone, while Hezbollah said any continued presence would justify resistance and should not allow Israeli operational freedom in Lebanon.
Major Currency Moves And Market Focus
EUR/USD eased near 1.1780 after eight consecutive days of gains, while GBP/USD drifted lower near 1.3530. USD/JPY rose towards 159.10, and AUD/USD traded near 0.7160, with markets focused on risk conditions and energy-route uncertainty.
WTI traded around $93.90 per barrel as supply concerns persisted. Gold was near $4,789, with attention on potential de-escalation.
Next on the calendar was the US IMF Meeting on Friday, April 17. WTI is a US crude benchmark from the Cushing hub, with prices affected by supply and demand, US dollar moves, inventories from API and EIA (within 1% of each other 75% of the time), and OPEC’s 12-member quotas plus OPEC+ including 10 extra members.
Given the strength in the US Dollar, we should consider options that favor its continued rise against other major currencies. The geopolitical instability is creating a clear flight to safety, and the dollar remains the primary beneficiary. Looking back at how the DXY surged to 20-year highs during the geopolitical uncertainty of 2022, the current level near 98.20 seems to have further room to run if tensions do not de-escalate.
Oil Options Strategies For Supply Shock
The disruption in the Strait of Hormuz, a chokepoint for roughly 20% of global oil consumption, presents a clear opportunity for bullish oil strategies. With West Texas Intermediate (WTI) already above $93, long call options could prove profitable if the blockage worsens or if diplomatic talks fail. This supply shock is particularly potent as it hits a market that we’ve seen tightened by disciplined OPEC+ production quotas over the past couple of years.
We should anticipate continued weakness in currencies sensitive to risk and energy prices, particularly the Euro and the Australian Dollar. The Eurozone’s high dependency on energy imports, with recent data showing over 50% of its energy is imported, makes it uniquely vulnerable to this Mideast crisis. Therefore, buying put options on EUR/USD and AUD/USD could serve as a direct play on escalating tensions.
Gold’s muted response near a historically high price of $4,789 suggests the market is undecided, caught between safe-haven flows and hopes for a ceasefire. This indicates that a volatility play, such as a long straddle, could be an effective strategy to capture a sharp price movement once the direction becomes clearer over the weekend. The current high price already reflects significant fear, meaning any genuine de-escalation could trigger a rapid pullback.
China’s latest monthly data showed mixed trends, with stronger output but weak consumer demand. Q1 GDP rose 5.0% year on year, above the 4.8% consensus forecast.
Industrial production increased 5.7% year on year, beating the 5.3% consensus and supported by export growth. Retail sales in March rose 1.7% year on year, down from an average of 2.8% across the first two months.
Key Domestic Indicators
House prices fell -0.21% month on month, a smaller drop than in recent periods. The unemployment rate rose to 5.4% in March from 5.3% in February, the highest since February last year.
Policymakers in Beijing are expected to monitor whether the Iran war affects exports and domestic demand. Further economic stimulus may be considered over coming quarters if conditions weaken.
After the data release, Chinese stocks saw improved risk appetite and the CNY strengthened slightly. The article was produced using an AI tool and reviewed by an editor.
We are seeing a clear divergence in the Chinese economy, which presents specific opportunities. The strong 5.0% Q1 GDP and industrial production figures are propping up the market, but the weak 1.7% growth in March retail sales shows the domestic consumer is still struggling. This two-speed reality suggests favoring sectors tied to global trade over those dependent on local spending.
Potential Positioning And Catalysts
This production strength is reinforced by recent data from the General Administration of Customs, which showed exports grew by 7.1% in March, beating expectations. Given this, traders should consider call options on China-focused industrial and export-oriented ETFs. This trend appears solid, especially as global supply chains continue to normalize.
Conversely, the consumer weakness is a persistent headwind, reminding us of a similar pattern in mid-2025. That period of weak consumer data preceded targeted stimulus measures from Beijing in the fourth quarter of that year. Therefore, buying put options on consumer discretionary stocks could be a valuable hedge against further domestic slowdown.
The key catalyst to watch for is a potential stimulus package from policymakers, especially if geopolitical tensions related to Iran begin to impact exports more severely. The rise in unemployment to 5.4% adds pressure on Beijing to act sooner rather than later. We should anticipate increased market volatility around major policy meetings in the coming weeks.
The slight strengthening in the CNY is likely temporary, as the prospect of economic stimulus and potential rate cuts will weigh on the currency. We see this as an opportunity to position for future yuan weakness. The positive sentiment in Chinese stocks also feels fragile and highly dependent on government follow-through.
Commerzbank’s Michael Pfister says G10 and emerging market (EM) carry trades have shown strong paper gains since the start of 2025. He links this to Iran-related market moves and to high-yield currencies such as the Brazilian real and Mexican peso.
He says a G10 carry strategy outperformed pure interest income in the first quarter. He attributes this to exchange rate moves that supported the trade, alongside interest income.
Carry Performance Depends On Market Conditions
Pfister says there is no empirical evidence that carry strategies deliver systematic long-term outperformance. He notes that carry can do well in the short term when currency moves align with the position.
He adds that EM carry strategies have become more popular in recent years. The Bloomberg EM Carry Trade Index has posted exceptionally strong performance since the beginning of 2025.
He warns that recent EM carry returns are largely driven by interest income. He says the exchange rate component is still recovering from weak performance in 2024.
We have to remember that the strong paper gains from carry trades in early 2025 were helped by specific geopolitical events and a favorable interest rate environment. That landscape is now changing as major central banks have shifted their policy stance from the aggressive hikes we saw previously. This narrows the yield gaps that make the strategy attractive in the first place.
Hedging Carry Trades In Higher Volatility
For emerging market trades, we must be especially cautious because performance was largely due to high interest income, while the currencies themselves were just recovering from a poor 2024. That recovery now appears to be fading, as we see that the Mexican Peso, a favorite for this strategy, has weakened by over 3% against the dollar year-to-date. This currency depreciation is starting to eat into the high interest rate gains.
The low-volatility environment that helps these trades has also shifted, with the VIX index now consistently holding above 18, a notable increase from the calmer periods of 2025. In such an environment, sudden exchange rate moves can quickly erase months of accumulated interest payments. Historically, carry trades perform poorly when market volatility rises unexpectedly.
Therefore, we should consider using options to hedge our exposure in popular pairs like the USD/MXN. Buying put options on the high-yield currency provides a clear floor, limiting our downside if the currency suddenly weakens in the coming weeks. This allows us to define our risk while still participating in the trade, which is prudent given the changing market conditions.
The Australian Dollar fell against the US Dollar on Thursday as the US Dollar steadied, ending a three-day AUD/USD rise. The pair traded near 0.7155 after nearing 0.7200, a level last seen in June 2022, following Australian jobs data.
The US Dollar Index (DXY) ended an eight-day losing run and traded near 98.20. It rebounded from an intraday low of 97.83, its lowest since March 2.
Us Iran Talks In Focus
Market focus stayed on the US-Iran situation. A Bloomberg report said Gulf and European officials expect a deal may take up to six months, and they called for an extension of the current ceasefire and the reopening of the Strait of Hormuz.
Reuters reported that US and Iranian negotiators are seeking a temporary memorandum rather than a full peace agreement, citing two Iranian sources. US President Donald Trump said the next meeting could be over the weekend and warned that fighting would resume if there is no deal.
Oil prices remained elevated, supporting inflation concerns and limiting expectations for near-term Federal Reserve rate cuts. New York Fed President John Williams said inflation is being lifted and forecast it at about 2.75%-3% this year.
Australia added 17.9K jobs in March versus 20K expected and 49.7K previously. The unemployment rate stayed at 4.3% for a second month.
Aussie Dollar Volatility Strategies
We are seeing the Australian dollar under pressure, currently trading around 0.6650 against the US dollar. This reminds us of similar situations, like the one we observed back in 2025, where a brief Aussie rally was quickly erased by a rebound in the greenback. The key takeaway from that period is how rapidly geopolitical headlines can shift momentum and favor the US dollar as a safe haven.
Current global uncertainty, particularly from ongoing conflicts in Eastern Europe and the Middle East, is keeping markets on edge. This environment is keeping oil prices elevated, with Brent crude futures holding firm above $85 a barrel, creating persistent inflationary pressures. This is very similar to how the tensions around the Strait of Hormuz in 2025 supported both oil prices and the US dollar.
This sticky inflation makes it difficult for the Federal Reserve to consider cutting rates, a fact supported by the latest US Consumer Price Index data showing inflation at 3.5%. Just as the New York Fed president warned in 2025 that conflict was lifting inflation, we are seeing the same dynamic play out now, positioning the Fed to remain restrictive. This policy stance provides a strong underlying bid for the US dollar.
In Australia, the labor market continues to show resilience, with the unemployment rate holding below 4.0% in the latest figures. This strength, much like the solid jobs data we saw in 2025, supports the Reserve Bank of Australia’s own hawkish position. This creates a powerful tug-of-war between the two currencies, likely leading to continued volatility.
Given this backdrop of competing central bank policies and high geopolitical risk, buying volatility on the AUD/USD pair is a prudent strategy. We should consider using options, such as purchasing straddles or strangles, to position for a significant price move in the coming weeks, regardless of the direction. The current tension makes a sharp breakout more likely than a prolonged period of calm.
Alternatively, for those with a bearish bias on global risk, the US dollar’s safe-haven appeal is a powerful factor. Buying AUD/USD put options offers a defined-risk way to position for a potential downturn. This would protect against a scenario where geopolitical fears escalate, causing a flight to quality that would strengthen the US dollar significantly.
Gold edged down in the US session as Middle East tensions eased amid moves to restart US-Iran talks and a proposed Israel-Lebanon ceasefire. XAU/USD traded at $4,784, down 0.13%.
The US Dollar strengthened, with the US Dollar Index up 0.21% at 98.25, adding pressure to bullion. US equities rose as markets assessed the outlook for a Washington-Tehran deal.
Us Iran Talks Narrow Differences
Reports said the US and Iran are narrowing gaps, including on the Strait of Hormuz. Iran is seeking the release of frozen funds in exchange for allowing ships to transit via Omani waters, while the nuclear issue remains unresolved.
Donald Trump said Israel and Lebanon would begin a 10-day ceasefire at 5:00 PM EST (21:00 GMT). The pause aims to halt fighting between Israel and Hezbollah during the Iran conflict.
US Initial Jobless Claims fell to 207K for the week ending April 11, versus 215K expected and 218K prior. US Industrial Production slipped from 0.7% to -0.5% month-on-month in March, led by motor vehicles, parts, and utilities.
New York Fed President John Williams said the Iran conflict is pushing prices up and expects higher headline inflation. Governor Stephen Miran said he expects three rather than four rate cuts due to “less favorable” inflation.
April 2026 Gold Market Shift
We are looking at a much different picture now in April 2026 than we saw back in 2025 when Mideast de-escalation hopes briefly pushed gold down to the $4,780s. While those geopolitical tensions continue to simmer, providing a floor for prices, the primary driver has shifted. Gold is currently trading around $5,150, showing that underlying demand has overpowered the temporary risk-off sentiment we saw last year.
The Federal Reserve’s outlook, which hinted at three or four rate cuts in 2025, has since become more complex due to persistent inflation. Recent data for March 2026 showed the Consumer Price Index (CPI) remains elevated at 3.4% year-over-year, which is complicating the Fed’s path forward. This sticky inflation keeps gold attractive as a hedge, even if it means interest rates stay higher for longer.
A critical factor supporting this rally has been the relentless buying from central banks, a trend that accelerated significantly after 2022. According to the latest World Gold Council data, central banks collectively added over 1,037 tonnes in 2023, and reports indicate this aggressive purchasing continued through 2025 and into this year. This activity creates a strong institutional bid in the market, suggesting any significant price dips will likely be met with buying.
Despite gold’s strength, traders must watch the resilient US Dollar, which currently sits near 105 on the DXY. A strong dollar typically acts as a headwind for bullion, and the healthy US labor market, with initial jobless claims at a low 212,000 for the week ending April 11, 2026, supports the greenback. This creates a tense standoff between a strong dollar and powerful fundamental demand for gold.
For the coming weeks, this suggests a strategy of buying on weakness may be prudent, as the long-term bullish case from inflation and central bank demand remains intact. Traders could consider using options to define risk, such as buying call spreads to target a move toward the $5,250 resistance level while capping upfront costs. The $5,050 level now appears to be a key area of support to watch for entry points.
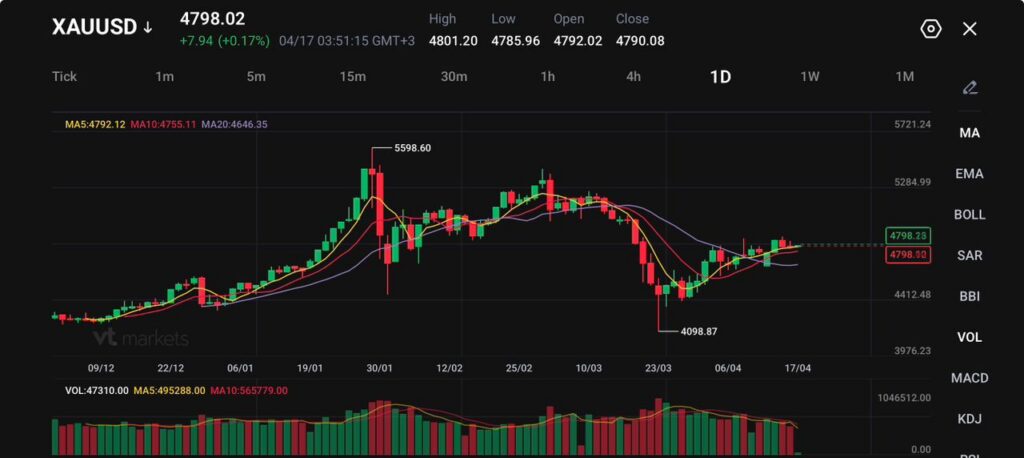
XAUUSD trades at 4,798.02, up 7.94 (+0.17%), with spot gold holding near $4,841.76 and June futures at $4,866.50.
The US dollar remains near its weakest level in more than a month, which is keeping bullion supported.
Markets now see about a 30% to 33% chance of a 25 basis-point Fed cut this year, up from roughly 13% a week earlier.
Gold is holding steady because the market still has not received a clean answer on whether the latest diplomacy will produce a durable break in the conflict. Spot prices are sitting close to a one-week high, while futures remain near the upper end of the recent range.
The 'debasement trade' has driven gold to new heights. Wells Fargo's bull case calls for $8,000 an ounce https://t.co/Jl1h60xX4G
That has kept bullion well supported even as broader risk appetite improved.
The market has moved out of panic mode, but it has not moved into full confidence either. Negotiation headlines have reduced the immediate war premium in oil, yet uncertainty around the Strait of Hormuz and the wider regional backdrop is still keeping a layer of caution under precious metals.
Shipowners and charterers are struggling to agree on who should take on the risk of crossing the Strait of Hormuz, meaning relatively few vessel bookings are occurring https://t.co/69UIR2UDP9
A cautious near-term view still favours support for gold while talks remain unresolved and the dollar stays soft.
Softer Dollar Carries Most of The Support
The dollar is doing most of the short-term heavy lifting for gold. With the greenback near its weakest level in over a month, bullion has become more affordable for non-dollar buyers. That has helped gold stay resilient even as oil eased and equities recovered.
Don't call time on dollar dominance just yet, say analysts as 'petroyuan' call sparks debate https://t.co/taUFxhkAuZ
That combination is important because gold is not rallying off a pure fear trade right now. It is getting support from currency weakness and from a market that is slowly rebuilding the possibility of easier policy later in the year. As long as those two factors stay in place, bullion can remain firm without needing a full risk-off backdrop.
Fed Not Off the Hook
The rates picture has shifted in gold’s favour, but only partially. Traders have lifted the chance of one Fed cut this year to around 30% to 33%, which is a clear improvement from around 13% last week. Even so, the market is still far less dovish than it was before the war shock.
New York Fed President John Williams reiterated monetary policy remains well positioned to deal with the threat of a protracted supply shock caused by war in the Middle East https://t.co/cEaeTSRdT9
That leaves gold in a balanced position. Lower yields and a softer dollar support the metal, but policymakers are still warning that energy costs are feeding into broader inflation. New York Fed President John Williams said the war is already pushing inflation higher through energy and other channels, with inflation likely to remain above 3% in the near term.
A cautious forecast still points to a supportive backdrop for gold, though a hotter inflation path would slow any upside extension.
XAUUSD Technical Outlook
XAUUSD is trading near 4798, holding steady after its recent recovery from the 4098 low, with price now moving sideways just below a short-term resistance zone.
The rebound has stabilised, but momentum has slowed, suggesting the market is entering a consolidation phase as it builds a base after the prior decline.
From a technical standpoint, the structure is neutral to slightly constructive in the near term. Price is sitting around the 5-day (4792) and 10-day (4755) moving averages, which are flattening and offering immediate support.
The 20-day (4646) remains below as a stronger base, indicating that while recovery is intact, upside momentum is not yet strong enough to break into a sustained trend.
Key levels to watch:
Support: 4790 → 4755 → 4645
Resistance: 4850 → 4900 → 5050
Gold is currently consolidating just below the 4850 resistance area. A firm break above this level could open the path toward 4900, with further upside potential toward 5050 if momentum builds.
On the downside, 4790 is acting as immediate support. A move below this level could trigger a pullback toward 4755 and potentially 4645 if selling pressure increases, though such a move would likely remain corrective within the broader structure.
Overall, XAUUSD is range-bound with a slight upward bias, as price compresses between support and resistance. The next move will likely depend on whether buyers can push through 4850 or if the market rolls back into deeper consolidation.
What Traders Should Watch Next
The next move depends on whether diplomacy with Iran produces anything durable and whether the Fed can stay patient without letting inflation expectations drift higher. A stable dollar pullback and steady progress in talks would keep gold supported near the current highs. A stronger inflation scare or a breakdown in negotiations would change the mix quickly, either by rebuilding safe-haven demand or by reviving higher-for-longer rate pressure.
Why Is Gold Holding Near $4,800 Even As Ceasefire Hopes Improve?
Gold is staying firm because the softer US dollar and improved rate-cut expectations are offsetting some of the risk-on shift from the latest Iran diplomacy. Spot prices have remained near the recent $4,841.76 area even as oil pulled back.
Why Does A Weaker Dollar Support Gold Prices?
Gold is priced in dollars, so a weaker dollar makes bullion cheaper for buyers using other currencies. That usually improves demand and helps keep prices supported. The dollar has been trading near its weakest level in more than a month.
Why Has Gold Not Broken Higher More Aggressively?
The market is balancing support from the weaker dollar against reduced panic over the Middle East. Traders are no longer in full defensive mode, and ETF flows show some investors are still taking money off the table rather than chasing the rally. SPDR Gold Trust holdings fell 0.5% to 954.48 tonnes.
How Have Fed Rate Expectations Shifted For Gold?
Markets now see about a 30% to 33% chance of one 25 basis-point Fed cut this year, up from roughly 13% a week earlier. That is more supportive for gold than before, but it is still less dovish than the pre-war expectation for two cuts.
Why Do Rate-Cut Expectations Matter So Much For Gold?
Gold does not pay interest, so it tends to perform better when bond yields and rate expectations fall. If traders become more confident that the Fed can ease later in the year, the opportunity cost of holding gold falls.
Start trading now – Click here to create your real VT Markets account
US President Donald Trump spoke to reporters outside the White House on Thursday about the confrontation with Iran. He said the US was making a lot of progress with Iran and that a deal could be close.
Trump said he was not sure a ceasefire needed to be extended. He said Iran was willing to do things they previously were not prepared to do.
Deal Signals And Geopolitical Risk
He said that if there was no deal with Iran, fighting would resume. He also said Iran had agreed it would not have a nuclear weapon.
Trump said Iran had agreed to give back “the nuclear dust”. He added that Iran had agreed to almost everything.
He said that if an Iran deal was signed in Islamabad, he might go to China.
These statements signal that a deal with Iran is being presented as highly probable, which suggests a coming drop in market volatility. The primary risk is a sudden reversal if talks collapse, as the alternative is a return to fighting. Derivative traders should position for a significant decline in geopolitical risk premium over the next few weeks.
Oil Market And Volatility Trades
We see the most direct impact on oil prices, which are currently trading at $87 for a barrel of WTI. The potential return of over 1.3 million barrels of Iranian oil per day to the market would create significant downward pressure. We should consider buying June puts on WTI or selling call spreads to capitalize on a potential price drop towards the low $80s.
This de-escalation would also crush implied volatility across asset classes. The VIX index, which has been hovering around 18 due to these tensions, could quickly fall back toward its 15-point average. Selling VIX futures or out-of-the-money calls expiring in May seems like a prudent strategy.
Lower energy costs and reduced global tension would be a tailwind for the broader stock market. This suggests a bullish stance on equity indices like the S&P 500. We believe buying call options on SPY with a June expiration could provide upside exposure to a relief rally.
However, we must remember the tensions from last fall in 2025, which showed how quickly the situation can deteriorate. The comment that fighting will resume if there is no deal is a clear warning. A small allocation to cheap, long-dated put options on equities can serve as an effective hedge if this optimism proves misplaced.
A peace dividend would likely pressure the defense sector, which rallied throughout the confrontations in 2025. We could see a rotation out of these names as the threat of a major conflict subsides. Buying puts on defense ETFs or major contractors could be a profitable contrarian play against the recent run-up.
Standard Chartered economists assess how the Middle East conflict could affect global remittances. They say Gulf Cooperation Council (GCC) economies are major sources of remittances to Egypt, Pakistan, the Philippines, Bangladesh and Sri Lanka.
They describe an energy price shock as a key risk to the global economy, with the possibility of recession if it lasts. They also point to physical disruption to oil and gas supply and wider effects on economies, especially in Asia.
Risks To Trade And Supply Chains
They note that other goods moving through the Strait of Hormuz could also face disruption. This could threaten downstream production activity in multiple sectors.
The note says GCC economies host many expats who send personal remittances that support balance of payments positions in recipient countries. It also states the Middle East has become both a destination and a source for international travel and tourism.
On remittances, they say the effect of the conflict is not clear-cut. During COVID-19, early estimates expected remittances to fall by 20–40%, but they declined by 2.4% year on year in 2020.
They state the non-oil economic impact is unlikely to match COVID-19. They add that evidence so far shows limited expat withdrawal, but a prolonged conflict could increase relocation and reduce remittance flows.
Market Hedging And Volatility Signals
The primary risk we see is the energy price shock, which threatens to push the global economy into a downturn. Recent reports from last week indicate a breakdown in ceasefire negotiations, and Brent crude futures just topped $95 a barrel for the first time this year. This suggests traders should consider buying call options on WTI or Brent to hedge against further supply disruptions through the Strait of Hormuz.
We are also watching for broader impacts, especially on the currencies of countries heavily reliant on remittances from the Gulf, like Egypt and Pakistan. While there isn’t a mass exodus of workers yet, the World Bank’s latest report noted a 3% dip in remittance flows to South Asia for Q1 2026, flagging it as a growing concern. Derivative traders could look at purchasing put options on currencies like the Philippine peso (PHP) or the Pakistani rupee (PKR) as a hedge against a worsening conflict.
When we look back at the 2020 pandemic, we remember that initial fears of a remittance collapse were surprisingly overblown as flows only dipped globally by 2.4%. However, this situation is different; a persistent conflict creates physical risk, raising the chances of worker relocation in a way the global pandemic did not. This underlying risk of people actually leaving the region is not yet fully priced into the market.
The uncertainty of a prolonged conflict is already causing jitters in the broader market. We’ve seen the VIX, the market’s fear gauge, climb by 5 points in the last two weeks alone. Traders should consider long positions on volatility indices as a direct play on this escalating tension, which also impacts sectors like international travel and tourism.