USD/CAD was flat near 1.3645 in the European session on Thursday, as a firmer US Dollar offset a steadier Canadian Dollar. The pair hovered near its 20-day EMA at about 1.3665.
The US Dollar Index was up 0.2% near 99.00 after a pullback from 99.67 on Tuesday, a three-month high. A New York Times report about Iran’s willingness to talk was later denied by Tehran, which also threatened a prolonged war, supporting demand for safe-haven assets.
Us Data Reinforces Dollar Demand
US data also supported the Dollar. ADP showed 63K private-sector jobs in February versus 50K expected and 11K previously, while ISM Services PMI rose to 56.1 versus 53.5 expected and 53.8 in January.
The Canadian Dollar stayed supported by higher oil prices linked to the Middle East conflict, as Canada is the largest oil exporter to the US. Against other currencies, the CAD traded firmer.
The 14-day RSI stayed in the 40.00–60.00 range and below 50. Support is at 1.3632, then 1.3558–1.3559 and 1.3490, while resistance is at 1.3720.
Looking back to this time in 2025, we saw the market caught between conflicting forces, holding USD/CAD steady around 1.3645. The US-Iran conflict was creating a tug-of-war, with risk-off demand supporting the US dollar while simultaneously pushing oil prices higher to the benefit of the loonie. This created a period of consolidation that derivative traders found challenging.
Shift To Diplomacy And Rate Divergence
The geopolitical landscape has since shifted from active conflict to tense diplomacy, removing the immediate war premium from markets. West Texas Intermediate (WTI) crude oil is now trading at approximately $82 per barrel, which is notably higher than the sub-$80 levels seen during the peak tensions in early 2025. This sustained strength in energy continues to provide an underlying bid for the Canadian dollar.
Last year’s economic data showed a surprisingly strong US ISM Services PMI of 56.1, which fueled US dollar strength. Today, we see a more moderated picture, with the February 2026 ISM Services report coming in at a still-expansionary 52.8. This indicates a cooling from the post-pandemic highs but reflects a resilient US economy.
The labor market story has also changed significantly from the weak ADP report of only 63,000 jobs in February 2025. The most recent Non-Farm Payrolls report showed a robust gain of 195,000 jobs, reinforcing the Federal Reserve’s cautious stance. This economic divergence has helped push the US Dollar Index (DXY) to around 103.50, a stark contrast to the 99.00 level it flirted with last year.
This dynamic suggests traders should consider the widening interest rate differential as a primary driver. The Bank of Canada has begun a modest easing cycle while the Federal Reserve remains on hold, creating a favorable carry for holding US dollars. Therefore, using options to define risk, such as buying call spreads, could allow traders to position for a gradual grind higher in USD/CAD while being protected from sharp reversals caused by oil price volatility.
Create your live VT Markets account and start trading now.
Start trading now – Click here to create your real VT Markets account
Gold rose for a second day on Thursday as demand increased during the Middle East war. US and Israeli strikes in Iran, and Iranian missile and drone attacks across the region, continued the crisis.
A US submarine reportedly sank an Iranian warship off Sri Lanka. US Defence Secretary Pete Hegseth said it was the first such attack on an enemy since World War II, and the campaign entered its sixth day.
Gold Gains From Weaker Dollar
Gold demand also grew as the US Dollar weakened, which makes dollar-priced Gold cheaper for non-US buyers. The New York Times, cited by Reuters, reported Iran’s Ministry of Intelligence signalled the CIA about possible talks, but Tehran later denied it.
The US is set to impose a temporary 15% global tariff, replacing a 10% rate introduced after the Supreme Court invalidated most earlier levies. Treasury Secretary Scott Bessent said the rate could return to earlier levels within five months as new trade probes proceed.
Higher oil and gas prices raised inflation concerns and reduced expectations for Federal Reserve rate cuts. The US 10-year Treasury yield rose for a fourth session to 4.11%.
Gold traded near $5,160 and held above $5,150, staying in an ascending channel. The nine-day EMA is $5,163, the channel support is $5,070, the 50-day EMA is $4,874, resistance is $5,470, and the record high is $5,598 from 29 January; the 14-day RSI was in the mid-50s.
Central banks added 1,136 tonnes of Gold worth about $70 billion in 2022, the highest on record. Gold often moves against the US Dollar and US Treasuries, and can rise when interest rates fall.
Options Strategies In High Volatility
Given the ongoing conflict and its impact on markets, we should anticipate continued high volatility in gold. With the gold volatility index (GVZ) surging to levels we haven’t seen since the banking turmoil of 2023, buying call options will be expensive. Therefore, traders should consider using call spreads to bet on further upside while managing the high cost of premiums.
A potential strategy involves buying an April call option with a strike price just above the current market, perhaps around $5,200, and simultaneously selling a call with a strike near the channel’s upper boundary around $5,450. This approach lowers the initial cost and provides a solid potential return if gold continues its ascent as the crisis unfolds. It effectively trades unlimited upside for a higher probability of profit.
We must remain cautious about the risk of a sudden de-escalation, as hinted by conflicting reports of peace talks. A swift resolution could trigger a sharp sell-off in gold, similar to the 4% pullback we saw in a single week in late 2024 following ceasefire hopes in Ukraine. To protect against this, holding some cheap, out-of-the-money put options could serve as a valuable hedge for long positions.
The renewed inflation fears, fueled by surging energy prices, are a significant headwind. Looking at the fed funds futures market, traders have significantly dialed back expectations for a rate cut in the second quarter, with the probability now sitting below 30% from over 70% at the start of the year. This, along with rising Treasury yields, could cap gold’s rally if the conflict’s safe-haven appeal begins to fade.
However, the underlying support for gold remains strong due to persistent central bank buying. We’ve seen this play out over the last year, as World Gold Council data showed central banks added another 1,037 tonnes to their reserves in 2025, marking the second-highest year on record. This trend provides a solid floor under the price, suggesting any dips caused by de-escalation may be seen as buying opportunities by these large institutions.
Create your live VT Markets account and start trading now.
Start trading now – Click here to create your real VT Markets account
Spain’s calendar-adjusted industrial output rose by 0.3% year on year in January. The result was below the expected 1.7%.
The release compares actual output growth with a market forecast for the same period. The difference between the two figures is 1.4 percentage points.
Industrial Output Detail
The data point refers to industrial production and is adjusted to remove calendar effects. It describes year-on-year change for January.
The weak industrial output data from Spain, showing just 0.3% growth instead of the expected 1.7%, is a clear signal of a potential economic slowdown. We should view this as a leading indicator of weakening corporate earnings for Spanish companies. This might lead us to consider bearish positions on the IBEX 35 index over the next few weeks.
This isn’t a one-off figure, as it aligns with the recent HCOB Manufacturing PMI for Spain, which fell to 49.5 in February, technically showing a contraction. With Eurozone core inflation remaining sticky at 2.8%, the European Central Bank has little room to stimulate the economy without risking higher prices. This combination of slowing growth and persistent inflation creates a challenging environment for equities.
Looking back, we remember the industrial sector showing signs of a rebound in the latter half of 2025, which helped fuel market optimism at the time. The current data for early 2026 breaks this positive trend, suggesting the recovery has lost its momentum. This shift in narrative could catch some market participants off guard.
Potential Market Strategies
In response, we could look at buying put options on the IBEX 35 to protect our portfolios or to speculate on a further downturn. Another conservative strategy would be to sell out-of-the-money call options against existing Spanish stock holdings to generate income. These positions offer a buffer if the market trades sideways or declines moderately.
This weakness could also spill over into the currency markets, putting downward pressure on the EUR/USD pair. The uncertainty generated by this data suggests an uptick in market volatility is likely. Therefore, we might see value in purchasing options on the VSTOXX index, which tracks Euro Stoxx 50 volatility.
Create your live VT Markets account and start trading now.
Start trading now – Click here to create your real VT Markets account
Middle East tensions have kept oil markets in focus, with attention centred on supply risks linked to Iran. Market pricing has mostly reflected the risk of disruption to oil and gas flows through the Strait of Hormuz.
Energy prices stabilised even as tensions increased and the conflict extended beyond the Gulf. Events cited include a US submarine sinking an Iranian warship off Sri Lanka and NATO intercepting a missile headed for Turkey.
Market Focus On Supply Risk
Weekly US oil inventory data showed no purchases for the US strategic petroleum reserves last week. The US may consider selling reserves if oil price pressures continue.
The article says it was produced using an Artificial Intelligence tool and reviewed by an editor.
We are seeing the market primarily frame the escalating Middle East tensions through the lens of energy supply risk. The potential disruption to the Strait of Hormuz, a chokepoint for roughly 21 million barrels of oil per day, remains the key focus for now. This narrow view presents opportunities, as the market seems to be underpricing the risk of a wider conflict.
Given the surprisingly contained reaction in oil prices, implied volatility appears cheap relative to the developing situation. The CBOE Crude Oil Volatility Index (OVX) has climbed to 45, but this is modest compared to spikes seen during past conflicts. We believe buying options, like straddles or strangles, is a prudent way to position for a sharp price move in either direction over the coming weeks.
Positioning For Higher Volatility
We must not forget the sharp price reaction we saw back in 2022 when geopolitical risk surged in Europe, as that provides a recent historical parallel. The current events, including a naval engagement far from the Gulf and a missile interception by NATO, suggest the potential for a much larger and faster repricing of crude oil. The market’s current stability feels fragile and likely will not last if there are any further escalations.
The possibility of a release from the U.S. Strategic Petroleum Reserve (SPR) is acting as a cap on prices, but its effectiveness is debatable. With current SPR levels sitting near 365 million barrels, a multi-decade low, a release would not have the same impact it did a few years ago. We see this as a limited tool that may only provide temporary relief if a true supply disruption occurs.
Therefore, our immediate focus should be on derivative structures that benefit from an increase in volatility. Establishing long call spreads could capture upside from a supply shock while defining risk. These positions allow us to profit from the current market complacency before a potential repricing event forces the entire market to react.
Create your live VT Markets account and start trading now.
Start trading now – Click here to create your real VT Markets account
NZD/USD fell below 0.5950 and traded near 0.5920 in early European trading on Thursday. The New Zealand Dollar weakened against the US Dollar as conflict in the Middle East increased market caution.
Markets are watching the US weekly Initial Jobless Claims report due later on Thursday. Higher oil and gas prices linked to Middle East tensions have raised inflation concerns and supported a firmer US Dollar.
China Growth Target And Policy Direction
China set its 2026 growth target at 4.5%–5%, down from last year’s 5% expansion. China’s 15th Five-Year Plan (2026–2030) was submitted to the National People’s Congress on Thursday, with a focus on high-quality development and technological self-reliance.
Rising energy costs have led traders to reduce expectations of further US Federal Reserve easing, keeping policy expectations more hawkish. This backdrop has added pressure to NZD/USD.
The NZD is often influenced by Chinese economic conditions because China is New Zealand’s largest trading partner. Dairy prices also matter, as dairy is New Zealand’s main export.
The Reserve Bank of New Zealand targets inflation of 1% to 3% over the medium term, aiming for the 2% mid-point. Interest rate moves and the rate gap with the US can affect the NZD/USD exchange rate.
Trade Setup And Downside Thesis
With the NZD/USD pair breaking below the 0.5950 level, we see an opportunity to position for further downside in the coming weeks. The core of this trade is the widening gap between a strong US Dollar and a weakening Kiwi. The combination of global risks and domestic factors points towards continued pressure on this pair.
China’s lowered 2026 growth target of 4.5% to 5% is a significant signal for us, given the Kiwi’s status as a proxy for Chinese economic health. Recent data from February 2026 confirms this slowdown, with the Caixin Manufacturing PMI at just 50.9, showing minimal expansion. This directly impacts New Zealand’s export outlook and weighs on the currency.
On the other side of the pair, persistent Middle East tensions are keeping oil prices elevated, recently pushing Brent Crude above $84 a barrel. This feeds directly into US inflation concerns, which we saw confirmed in the last CPI report for January 2026 showing inflation at 3.1%. This gives the Federal Reserve every reason to maintain its hawkish stance, supporting a stronger dollar.
While the Reserve Bank of New Zealand held its own rate at 5.5% last week, its forward guidance was not nearly as aggressive as the Fed’s. This growing interest rate differential makes holding US Dollars more attractive than holding the Kiwi. Adding to this domestic pressure, the latest Global Dairy Trade auction showed prices slipping again, further eroding a key source of New Zealand’s income.
We recall a similar pattern unfolding through much of 2025, where concerns over global growth kept the NZD pinned down as a high-risk currency. Investors are once again favoring the safety of the US Dollar amid the current uncertainty. Given this backdrop, buying put options on the NZD/USD could be a prudent strategy to hedge or speculate on a move towards the 0.5800 level.
Create your live VT Markets account and start trading now.
Start trading now – Click here to create your real VT Markets account
European gas prices face upward pressure after President Putin said Russia may redirect gas away from the EU, while global LNG flows from the Persian Gulf are disrupted. Russian gas flows to the EU have already dropped in recent years, and an EU ban is set to cut Russian gas imports further from April 2026 through to end-2027.
EU gas storage is below 30% full, close to levels seen at the same point in 2022. This leaves the market more exposed to supply changes during the refill season.
Supply Risks Intensify
In 2025, the EU imported almost 38bcm of natural gas and LNG from Russia, equal to 12% of total EU gas and LNG imports. This included 20bcm of LNG and 18bcm of pipeline gas via Turkstream.
LNG supply is a main risk because replacing flexible cargoes can be harder when the global market is tight. About 110bcm per year of Persian Gulf supply is currently affected, which reduces alternatives for Europe and can lift TTF in the near term.
We are seeing significant upside risks building for European natural gas. The threat from Russia to redirect supplies away from the EU comes at a time when the global LNG market is already strained by ongoing disruptions in the Persian Gulf. Dutch TTF futures for the front month have already surged past €55/MWh in response to this news.
This supply anxiety is amplified by our low inventory levels. Gas Infrastructure Europe data shows storage is currently at 29.5% full, a level dangerously similar to what we saw in early 2022. That tight supply situation back then preceded a period of extreme price hikes.
Market Volatility Outlook
The potential loss of supply is substantial, considering we imported nearly 38 bcm from Russia in 2025. While replacing the 18 bcm of pipeline gas is a challenge, the real pressure point is the 20 bcm of LNG. Losing that volume in a global market already missing 110 bcm per year from the Persian Gulf creates a severe squeeze for buyers.
For us in the derivatives market, this signals a period of heightened volatility and a clear upward bias for TTF prices in the coming weeks. Implied volatility on near-term options is spiking, making long call positions or call spreads attractive strategies to capture potential price surges. We remember how in early March 2022, with similar fundamental drivers, prices rocketed from around €80/MWh to over €200/MWh in just a matter of days.
Create your live VT Markets account and start trading now.
Start trading now – Click here to create your real VT Markets account
Silver (XAG/USD) fell 1.6% to near $82.00 in the European session on Thursday. The drop followed a rebound in the US Dollar after firm US data.
The US Dollar Index (DXY) rose 0.35% to about 99.10. A stronger dollar can make silver less attractive.
Us Data Lifts Dollar Pressures Silver
ADP reported 63K private jobs added in February, above expectations. ISM said the Services PMI rose to 56.1 from 53.8, while forecasts were 53.5.
Expectations for near-term Federal Reserve rate cuts have eased. CME FedWatch estimates point to no rate cut in the first half of the year, which can reduce demand for non-yielding assets such as silver.
Middle East tensions may support safe-haven demand. The conflict involving the US, Israel, and Iran is expected to last longer after Tehran denied a New York Times report about indirect contact with the CIA over terms to end the war.
Looking back to this time in 2025, we saw silver drop to $82 as strong US economic data boosted the dollar. The ADP and ISM Services figures back then surprised to the upside, creating significant headwinds for precious metals. This pattern of a robust US economy weighing on silver is a key theme we must consider now.
How This Compares With 2026
Today, the situation shows a similar dynamic, with the US Dollar Index firm around the 104 mark. The latest non-farm payroll report for February 2026 showed a stronger-than-expected gain of 280,000 jobs, while the ISM Services PMI printed a solid 54.2. This continued economic strength reinforces the case for a resilient dollar, capping silver’s potential upside near its current price of $79.
The Federal Reserve’s stance, however, presents a different kind of uncertainty compared to last year’s clear hawkishness. While the CME FedWatch tool is now pricing in a 65% chance of a rate cut by the third quarter, the recent strong data is making officials hesitant. This creates a difficult environment for silver, as rate cut hopes provide support while the strong economy pressures it downwards.
Geopolitical factors have also shifted from the intense escalation we saw in early 2025 involving the US, Israel, and Iran. While underlying tensions in the Middle East certainly persist, the immediate safe-haven demand has cooled compared to last year. This removes a significant pillar of support that previously cushioned silver’s price during periods of dollar strength.
Given these headwinds and reduced geopolitical support, traders should consider strategies that protect against further downside. Buying put options on XAG/USD provides a defined-risk way to profit if the price continues to fall under the weight of the strong dollar. Establishing bearish put spreads could also be an effective way to cheapen this position and target a specific price level.
Implied volatility in the silver market is notably lower now than during the geopolitical flare-up of 2025. This makes purchasing options a more capital-efficient strategy for expressing a directional view compared to this time last year. It allows for positioning for a potential drop without the higher premium costs we faced previously.
Create your live VT Markets account and start trading now.
Start trading now – Click here to create your real VT Markets account
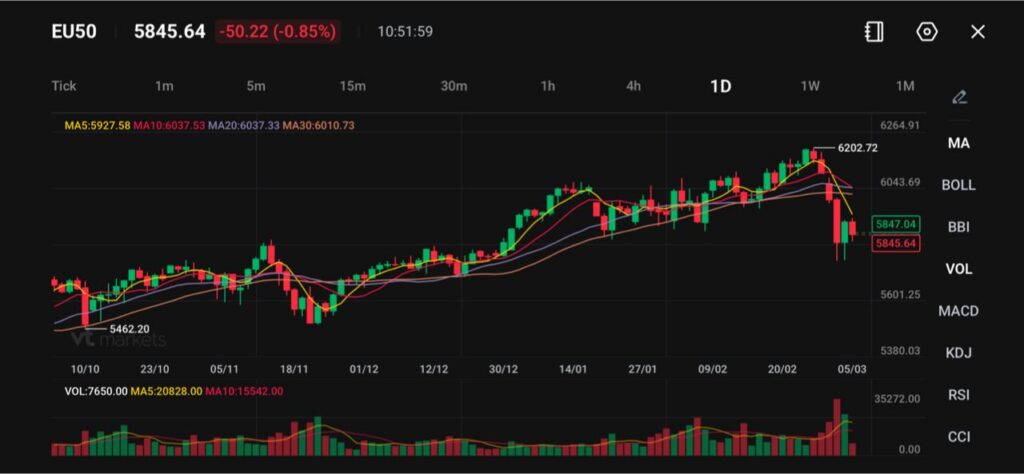
EU50 trades at 5845.64, down 50.22 (-0.85%), as selling pressure returns to European equities.
The STOXX 600 is down about 0.5% at 610 points, though still above the 600.64 low seen earlier this week.
Market breadth is weak, with about two-thirds of stocks declining and one-third rising, while travel and leisure (.SXTP) leads losses.
European equities weakened again on Thursday, with the EU50 index falling to 5845.64, down 50.22 (-0.85%). The decline follows a brief pause in selling on Wednesday as traders reassessed rising energy prices and the broader implications for Europe’s inflation outlook.
European markets head for another mixed open as war unsettles traders https://t.co/h9YOTDwt0z
The wider European market shows similar pressure. The pan-European STOXX 600 is down about 0.5% at 610 points, although the index remains above the 600.64 low recorded earlier this week. Traders remain wary that elevated oil and gas prices could trigger another inflation wave across the region if supply disruptions linked to the Middle East conflict persist.
European natural gas prices resumed their sharpest rally in years as uncertainty around the war in the Middle East continues to rattle energy markets https://t.co/XggBXyDVDf
Europe remains highly sensitive to energy costs. Higher fuel prices can quickly affect manufacturing, transport, and household consumption. As a result, even modest increases in oil and gas prices can push traders to trim equity exposure. The cautious expectation is that EU50 may remain volatile while energy markets stay unstable.
Breadth Signals Weak Market Participation
Market breadth confirms that selling pressure extends across the index. About two-thirds of stocks are declining while one-third are rising, indicating that weakness spreads across multiple sectors rather than a single industry.
When breadth turns negative, rallies often struggle to gain traction because fewer stocks support the index. For EU50, this environment can lead to sharp but short-lived rebounds followed by renewed selling if macro risks remain unresolved.
Polish President Karol Nawrocki said the central bank can provide cheap defense financing as an alternative to €44 billion ($51.2 billion) from the European Union’s loans-for-weapons program. https://t.co/YW9d5ThUDF
A cautious forecast is that EU50 may continue trading unevenly in the near term, with traders responding quickly to shifts in energy prices and geopolitical developments.
Technical Analysis
The EU50 index is trading near 5,845, down about 0.85%, as European equities extend their pullback after failing to hold above the recent peak around 6,202. The decline marks a notable shift in short-term momentum following the steady rally that had been building since late December.
From a technical standpoint, the index has fallen below its key short-term moving averages, with the 5-day moving average at 5,927 and the 10-day at 6,037, both now trending downward.
Price is also trading below the 20-day moving average (6,037) and approaching the 30-day average near 6,010, suggesting the recent bullish momentum has weakened and the market may be transitioning into a corrective phase.
The sharp drop earlier in the session pushed the index toward the 5,780–5,800 region before a modest rebound, indicating that buyers are attempting to stabilise the market around this support zone. If this level fails to hold, the next downside target could emerge around 5,600, where the broader uptrend previously found support.
On the upside, immediate resistance now sits near 5,900–5,930, followed by stronger resistance around 6,040, which aligns with the cluster of short-term moving averages.
Overall, the EU50’s broader trend remains constructive over the medium term, but the recent rejection near 6,200 and the break below short-term averages suggest that near-term consolidation or further downside pressure could persist before the index attempts another push higher.
What Traders Are Watching Next
Traders will closely monitor energy markets and geopolitical developments for signals that could influence European equities. Rising oil and gas prices remain a key risk for the EU50 because they affect inflation expectations and corporate costs across the region.
If energy prices continue climbing, the EU50 may struggle to regain upward momentum. If energy markets stabilise and geopolitical tensions ease, equity markets could attempt a recovery toward recent highs near 6202.72.
What is the EU50 Index, and What Does It Represent? EU50 tracks 50 large, liquid blue-chip companies across the euro area. Traders use it as a quick read on euro zone risk appetite, because it blends banks, industrials, consumer names, and energy-heavy firms into one price.
Why Does the EU50 React So Fast to Energy Shocks? Energy costs flow into European inflation and corporate margins quickly. When oil and gas prices rise, investors often reprice rate expectations and earnings risk at the same time, which can pressure EU50 even if company news stays quiet.
What Does Today’s Move Tell Us About Risk Mood in Europe? The drop to 5845.64, down 50.22 (-0.85%) says sellers still control the tape. The breadth picture reinforces that message, with about two-thirds of stocks declining and one-third rising, which usually points to broad de-risking rather than one-off profit taking.
Which Sectors Tend to Drive EU50 in This Setup? In an energy-risk tape, energy-linked names can support the index while cyclicals drag. That fits the current sector split where energy (.SXEP) is rising, while travel and leisure (.SXTP) sits at the bottom. Defensives like utilities (.SX6P) and food and beverages (.SX3P) can reduce the downside but rarely lead a fast rebound.
How Do Traders Use the Moving Averages on EU50 Right Now? Moving averages help traders judge whether a selloff stays tactical or turns into a trend shift. With price at 5845.64, the market sits below: MA5 5927.58, MA10 6037.53, MA20 6037.33, and MA30 6010.73. If EU50 fails to recover above 5927.58, many short-term traders treat rallies as sellable until price structure improves.
Start trading now – Click here to create your real VT Markets account
Iran denied reports that it had sent a message to the United States amid the ongoing conflict. Tehran said its armed forces were preparing for a long war rather than entering talks.
Tasnim news agency cited an Iranian official as saying no message had been sent to the US. The official added that Iran would not respond to US messages.
Market Reaction And Safe Haven Moves
Market prices rose during the session. Gold (XAU/USD) was up 0.78% at $5,175.
West Texas Intermediate (WTI) also gained. It was up 2.60% at $76.52.
With Tehran signaling a long-term conflict instead of diplomacy, we must prepare for sustained market volatility. The initial jump in gold and oil is likely not a temporary spike but the beginning of a new pricing environment. This changes the calculus from short-term reactions to longer-term strategic positioning.
For oil derivatives, the move in WTI towards $77 suggests the market is pricing in a significant risk premium. We should consider buying call options on crude futures for the coming months, as any actual disruption to shipping in the Persian Gulf could cause a rapid price escalation. This scenario has echoes of the initial price surge seen in 2022 following the conflict in Ukraine, which pushed WTI well over $100 per barrel.
The flight to safety is evident in gold’s strong performance, and we expect this trend to accelerate. This builds on the momentum gold has carried since it broke its previous highs back in late 2024. Call options on gold futures or related ETFs remain a primary strategy to hedge against the increasing geopolitical instability.
Equity And Inflation Implications
This tension will likely suppress broader equity markets as higher energy costs act as a tax on consumers and businesses. We saw a similar, though smaller-scale, market reaction during the Strait of Hormuz naval drills in late 2025, which led to a brief but sharp market correction. Protective put options on indices like the S&P 500 should be considered to guard against a downturn.
This geopolitical shock comes at a delicate time, just weeks after the February 2026 inflation data showed core inflation remaining sticky at 3.1%. An oil price sustained above $80 would introduce new inflationary pressures, making it very difficult for the Federal Reserve to consider any rate cuts this summer. We must now factor in a higher probability of a hawkish central bank stance for the remainder of the year.
Given these dynamics, implied volatility is the key measure to watch and trade in the coming weeks. We should anticipate a sharp rise in the VIX index from its current lows around 14. Strategies that benefit from rising volatility, such as long straddles or strangles on key market indices, could prove effective.
Create your live VT Markets account and start trading now.
Start trading now – Click here to create your real VT Markets account
Gold prices rose in Saudi Arabia on Thursday, based on FXStreet-compiled data. Gold was priced at SAR 624.44 per gram, up from SAR 619.69 on Wednesday.
The price per tola increased to SAR 7,283.37 from SAR 7,227.92 a day earlier. Other listed rates were SAR 6,244.45 for 10 grams and SAR 19,422.43 per troy ounce.
How Fxstreet Calculates Saudi Gold Prices
FXStreet derives Saudi prices by converting international gold prices using the USD/SAR rate and local measurement units. Prices are updated daily at publication time and are for reference, as local rates may differ slightly.
Gold is used as a store of value and medium of exchange, and it is often treated as a hedge against inflation and currency weakness. Central banks are the largest holders of gold and use it to diversify reserves.
World Gold Council data shows central banks added 1,136 tonnes of gold worth about $70 billion in 2022. This was the highest yearly purchase since records began, with China, India and Turkey among countries increasing reserves.
Gold often moves inversely to the US Dollar and US Treasuries, and can also move opposite to risk assets. Its price is influenced by geopolitics, recession concerns, interest rates, and US Dollar strength, as gold is priced in dollars (XAU/USD).
Macro Drivers Behind Gold Strength
Gold’s recent strength is catching our attention. This move aligns with a softening in the US dollar and a slight dip in Treasury yields over the past few weeks. Traders should see this not as a local event but as part of a larger macroeconomic shift.
The market is increasingly pricing in a more dovish stance from the Federal Reserve, a significant change from the hawkish sentiment we saw for most of 2025. With the latest US jobs report showing unemployment ticking up to 4.1%, expectations are solidifying for at least one rate cut before the third quarter. This environment of lower expected rates reduces the opportunity cost of holding a non-yielding asset like gold.
We must not overlook the consistent demand from central banks, which has provided a solid floor for prices. Following the record purchases of 2022, central banks added another 1,037 tonnes in 2023 and maintained a strong pace of buying throughout 2024 and 2025, with China and Poland being notable buyers. This institutional demand suggests any significant dips will likely be bought.
Geopolitical tensions in several key regions continue to simmer, bolstering gold’s appeal as a safe-haven asset. Furthermore, slowing global growth forecasts for 2026 are prompting a rotation out of riskier assets and into perceived safety. The CBOE Volatility Index (VIX) has been creeping higher, reflecting this growing unease.
For derivatives traders, this suggests that buying call options or bull call spreads on gold ETFs could be a viable strategy to capture potential upside in the coming weeks. Implied volatility is still reasonable, offering a decent entry point for long positions. Traders might also consider selling out-of-the-money puts to collect premium, betting on the strong support from central bank buying.
Create your live VT Markets account and start trading now.
Start trading now – Click here to create your real VT Markets account