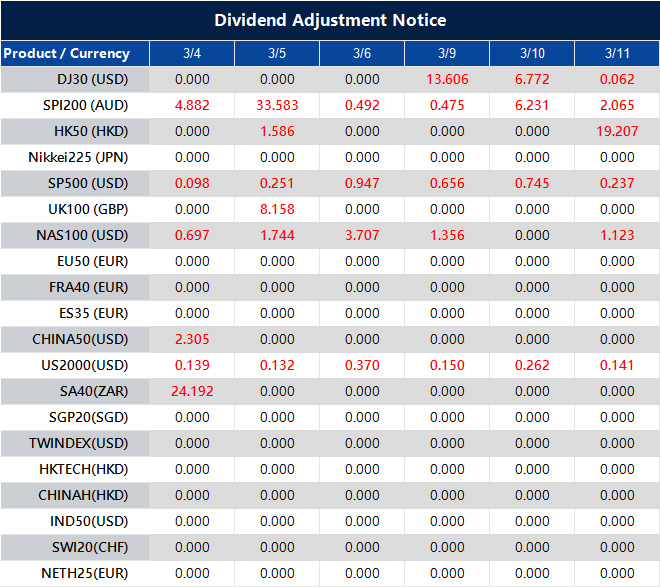
Please note that the dividends of the following products will be adjusted accordingly. Index dividends will be executed separately through a balance statement directly to your trading account, and the comment will be in the following format “Div & Product Name & Net Volume”.
Please refer to the table below for more details:
The above data is for reference only, please refer to the MT4/MT5 software for specific data.
If you’d like more information, please don’t hesitate to contact [email protected].
NZD/USD edged lower to about 0.5875 in Asian trading on Wednesday, with the New Zealand Dollar weaker against the US Dollar after mixed Chinese data. Markets are also watching the US February ISM Services PMI due later on Wednesday.
China’s official Manufacturing PMI fell to 49.0 in February from 49.3 in January, below the 49.1 forecast. The NBS Non-Manufacturing PMI rose to 49.5 from 49.4, but missed the 49.8 estimate.
China Pmi Signals Mixed Momentum
China’s RatingDog Manufacturing PMI rose to 62.1 in February from 50.3 in January, above the 50.1 expected. The RatingDog Services PMI increased to 56.7 from 52.3, above forecasts.
Rising tensions in the Middle East increased risk aversion, supporting the US Dollar and weighing on NZD/USD. The US and Israel targeted Iran’s leadership and nuclear infrastructure over the weekend, and President Donald Trump said on Monday combat operations would continue until US objectives are met.
The NZD is often influenced by New Zealand economic conditions and Reserve Bank of New Zealand policy, which targets inflation between 1% and 3% with a 2% mid-point. Changes in Chinese growth, a key export market, plus dairy prices can also affect the currency, along with shifts in global risk sentiment.
Looking back to early 2025, we saw the NZD/USD pair facing pressure around 0.5875 due to concerns over mixed Chinese economic data and geopolitical tensions. Those themes of a weak Chinese economy and a strong US dollar have largely defined the market over the past year. This established a bearish trend that traders have been watching closely ever since.
Outlook And Key Drivers In 2026
The weakness in China’s economy, which was a concern then, has persisted into 2026. The latest official NBS Manufacturing PMI for February 2026 came in at 49.1, marking the fifth consecutive month of contraction and signaling sluggish demand from New Zealand’s primary trading partner. This continued economic drag directly limits the upside potential for the New Zealand Dollar.
Adding to the pressure on the Kiwi is the divergence in central bank policy that has become more pronounced since last year. While the Reserve Bank of New Zealand is now signaling a potential rate cut later this year as inflation cooled to 3.8% in the final quarter of 2025, the US Federal Reserve remains committed to holding rates firm. This interest rate differential heavily favors the US Dollar and suggests a path of least resistance to the downside for the NZD/USD.
The dairy sector, a crucial component of New Zealand’s exports, has also failed to provide support. The most recent Global Dairy Trade auction in late February 2026 saw prices fall by 2.3%, reinforcing a trend of price weakness that has been evident for several months. This decline in a key source of national income further justifies a bearish outlook on the currency.
Given these fundamental headwinds, we believe traders should consider strategies that profit from further declines in the NZD/USD. Buying put options with strike prices below the current spot rate provides a way to capitalize on potential downside over the next several weeks. This approach has a defined risk, limited to the premium paid for the option.
Alternatively, for those expecting the pair to trade sideways or drift lower, selling out-of-the-money call options is a strategy to consider for generating income from premiums. This takes the view that any significant rally in the Kiwi is unlikely given the current economic backdrop. This should be approached with caution as it carries higher risk if the market moves unexpectedly upward.
Create your live VT Markets account and start trading now.
Start trading now – Click here to create your real VT Markets account
USD/CAD regained ground in Asian trading on Wednesday, moving back towards 1.3700 after a late pullback from its highest level since 23 January. The pair has still stayed within a range that has held for about two weeks.
The US dollar stayed firm due to safe-haven demand linked to rising tensions in the Middle East. Traders also reduced expectations of three US Federal Reserve rate cuts because of concerns about persistent inflation.
Usd Cad Holds Range Near Key Level
The US Dollar Index (DXY) held a bullish tone just below its highest level in over three months. This supported demand for USD/CAD.
Iran’s Islamic Revolutionary Guard Corps said the Strait of Hormuz was closed to shipping and warned that any vessel trying to pass would be set on fire. The strait is a key oil transit route, and the move raised supply concerns.
Oil prices remained within reach of their highest level since June 2025, which supported the Canadian dollar. This limited the scope for further USD/CAD gains.
Markets are watching the US ADP private-sector employment report and the ISM Services PMI. Reaction may be limited as attention remains on geopolitical developments.
Key Catalysts Could Break The Deadlock
We are seeing a classic standoff in the USD/CAD, with the pair struggling to break decisively from the 1.3700 level. The strong US Dollar is being directly challenged by elevated oil prices stemming from the escalating Middle East tensions. This creates a difficult environment for directional bets as the two opposing forces are keeping the pair tightly range-bound.
The case for a stronger US Dollar is supported by hard data, as the latest Core PCE Price Index is holding stubbornly above 3%, keeping inflation fears alive. As a result, market odds for a Federal Reserve rate cut before July have now dropped below 40%, a significant shift from the sentiment we saw at the start of the year. This fundamental backdrop continues to provide a strong floor for the greenback against most currencies.
On the other side, the closure of the Strait of Hormuz has pushed WTI crude to hold firm above $95 a barrel, its highest level since the spike in mid-2025. This provides significant support for the commodity-linked Canadian dollar and explains why every attempt for USD/CAD to rally has been quickly sold off. Until the global oil supply situation is clarified, it is difficult to see the Loonie weakening substantially.
From our perspective, this reminds us of the market volatility seen back in 2022 when geopolitical events first caused a major energy price shock. Back then, the US Dollar also benefited from safe-haven flows, creating a similar tug-of-war for the USD/CAD pair. History suggests these situations can persist for weeks, defined by sharp moves within a broader range.
For derivative traders, this suggests that long volatility strategies could be profitable in the coming weeks. Buying straddles or strangles allows us to profit from a large price move in either direction, which seems more likely than a sustained trend. One-month implied volatility for the pair has already climbed to 8.5%, reflecting this market uncertainty.
Looking ahead, the upcoming US Non-Farm Payrolls report and the next CPI inflation reading will be critical for the US Dollar. Similarly, the Bank of Canada’s upcoming policy statement will be closely watched for any change in tone due to higher energy prices. These events will likely be the catalysts that finally break the current deadlock.
Create your live VT Markets account and start trading now.
Start trading now – Click here to create your real VT Markets account
China’s RatingDog Manufacturing Purchasing Managers’ Index (PMI) rose to 62.1 in February from 50.3 in January, according to data released on Monday. The result was above the expected 50.1.
The Services PMI increased to 56.7 in February from 52.3 previously. The market forecast was 52.3.
Market Reaction And Currency Snapshot
At the time of writing, AUD/USD was trading near 0.7004, down 0.52% on the day.
Looking back at the February 2025 data, we saw an exceptionally strong economic signal from China. The manufacturing reading of 62.1 was not just expansionary; it was the highest figure we had seen since before the 2022 economic slowdowns. This suggests the recovery is far more robust than initial forecasts predicted.
The immediate drop in the AUD/USD, despite being a traditional proxy for Chinese economic health, should be viewed with caution. This move was likely driven by broader strength in the US dollar, with the DXY index firming above 104 on the back of separate inflation data. We believe this created a disconnect where the currency’s move did not reflect the positive underlying fundamentals for Australian exports.
Given this, we see opportunities in positioning for a surge in commodity demand over the next several weeks. Call options on industrial metals, particularly copper futures, look attractive as manufacturing ramps up. With copper prices recently stabilizing around $8,600 per metric ton, the foundation for a significant move higher is in place based on this new demand signal.
Equities And Volatility Positioning
This strength should also translate to Chinese and regional equities, which have been lagging. We can use derivatives to gain exposure to a potential rally in indices like the Hang Seng. Historically, we saw a similar setup in late 2022 when the Hang Seng rallied over 40% in three months on reopening optimism, and this PMI data is a much more concrete signal of activity.
The sharp divergence between the economic data and the initial currency reaction suggests an increase in market uncertainty. This makes buying volatility a prudent short-term strategy through options on currency pairs like AUD/JPY, which is highly sensitive to shifts in risk sentiment. An increase in volatility is likely as the market digests whether this strong data is a one-off event or the start of a sustained trend.
Create your live VT Markets account and start trading now.
Start trading now – Click here to create your real VT Markets account
China’s Ratingdog Manufacturing PMI rose to 62.1 in February. The forecast was 50.1.
A PMI reading above 50 suggests expansion in manufacturing activity. The February result was 12.0 points above the forecast.
China Manufacturing Surge
The February manufacturing data is a massive shock to the system, blowing past all expectations. A reading of 62.1 indicates an explosive acceleration, not the modest growth we were positioned for. This forces a complete re-evaluation of China’s economic trajectory for the coming months.
We must immediately consider long positions on industrial commodities. This PMI number suggests a voracious appetite for raw materials, a trend confirmed by recent data showing iron ore inventories at Chinese ports falling for five consecutive weeks. Look at call options on copper futures and major miners like BHP, as their earnings are directly tied to this unexpected industrial boom.
This data should provide a significant tailwind for Chinese equities, which underperformed during the second half of 2025. We are looking at bullish strategies on the Hang Seng and CSI 300 indices through futures or options. ETFs like FXI and MCHI are direct ways to play this renewed confidence in the Chinese market.
The Australian dollar is now a primary focus for currency traders, given its role as a proxy for Chinese industrial health. We anticipate the AUD/USD pair, which struggled to maintain the 0.6500 level late last year, will break significant upside resistance. Consider long futures positions or call options on the Aussie dollar.
The scale of this surprise will spike implied volatility across related assets. We see an opportunity in buying front-month call options on Chinese large-cap stocks while the market digests the news. The immediate jump in volatility makes these options more expensive, but the upward momentum could far outweigh the initial cost.
Global Freight Implications
Second-order effects on global logistics must be priced in. A surge in manufacturing output directly translates to higher shipping volumes, a sector that saw freight rates soften in the final quarter of 2025. We expect global shipping stocks and freight futures to rally strongly in the coming weeks.
Create your live VT Markets account and start trading now.
Start trading now – Click here to create your real VT Markets account
A potential policy shift at the Federal Reserve under Kevin Warsh would favour delayed liquidity intervention rather than immediate market support.
The US–Iran conflict could accelerate the liquidity cycle through oil shocks, stronger US dollar flows and tighter financial conditions.
In the short term, this implies dollar strength and pressure on risk assets, including Bitcoin.
Over the medium to long term, geopolitical stress and fiscal expansion increase the probability of renewed monetary easing.
The core issue is the timing of liquidity, not whether it eventually returns.
A Monetary Debate Meets a Geopolitical Shock
Discussion around the future direction of the United States monetary policy has intensified following Donald Trump’s nomination of Kevin Warsh to lead the Federal Reserve, subject to confirmation by the United States Senate.
Obstacles are mounting for Kevin Warsh to deliver the drastic rate cuts President Donald Trump wants if he becomes the next chair of the Federal Reserve https://t.co/jKt7wcUtln
While the confirmation process is still ongoing, markets are already adjusting their expectations.
The policy debate is no longer taking place in isolation. Rising tensions between the United States and Iran add a geopolitical dimension to an already fragile macroeconomic environment. The question now is not simply whether a new monetary regime is emerging, but whether external shocks are speeding up its arrival.
The fundamental issue is not whether liquidity will return, for it always does. The focus is on timing, scale and the method of implementation. Geopolitical instability has a way of shortening those timelines.
A Shift in Monetary Philosophy
Kevin Warsh served as a Federal Reserve Governor from 2006 to 2011, placing him at the centre of policy decisions during the Global Financial Crisis. Since leaving the institution, he has consistently argued that financial markets have become overly reliant on central bank support.
Injecting liquidity too early, in his view, prevents necessary repricing and encourages excessive risk-taking under the assumption of a guaranteed rescue.
Warsh does not oppose lower interest rates outright. He acknowledges that structurally high debt levels and housing affordability pressures may require accommodative policies. What he resists is perpetual balance sheet expansion — the notion that every downturn must be smoothed immediately through asset purchases and liquidity facilities.
This contrasts with the approach associated with Jerome Powell, under whom the Federal Reserve has favoured rapid liquidity deployment to dampen volatility and stabilise markets.
Both frameworks ultimately increase liquidity. The difference lies in the distribution of pain:
One cushions downturns early and gradually.
The other tolerates stress, forces repricing, and intervenes decisively only when systemic risk emerges.
This distinction materially influences the behaviour of currencies, bonds, equities and digital assets.
Where the US–Iran Conflict Enters the Equation
Geopolitical escalation, particularly involving energy infrastructure or military confrontation, affects markets through three immediate channels:
Oil price volatility
Safe-haven flows into the US dollar
A tightening of global financial conditions
Heightened tensions between the United States and Iran increase the risk of supply disruptions in the Middle East, driving crude prices higher. Rising energy costs feed inflation expectations at a moment when central banks are striving to manage disinflation.
This creates a policy dilemma.
If inflation accelerates due to geopolitical supply shocks, justifying a liquidity-restrictive stance becomes more difficult. Yet if financial markets react violently, especially in credit or emerging markets, pressure mounts for intervention.
In effect, geopolitical stress shortens the period during which a “tolerate the pain” strategy can realistically function.
Implications for the US Dollar, Bitcoin and Precious Metals
US Dollar
During periods of geopolitical escalation, the US dollar typically strengthens as global capital seeks safety and liquidity. A Warsh-style reluctance to deploy immediate stimulus would amplify that near-term dollar strength.
However, if conflict-induced instability threatens the functioning of the financial system, liquidity facilities would likely be expanded swiftly. Once large-scale intervention resumes, the longer-term risk of purchasing power erosion once again becomes the dominant theme.
Liquidity-sensitive assets, such as Bitcoin, are particularly exposed to shifts in the monetary regime.
A deliberate withholding of liquidity tends to weigh on speculative positions in the short term. Crypto markets contract when marginal liquidity dries up.
However, if geopolitical conflict forces an abrupt intervention, particularly through expanded repo facilities or balance-sheet tools, the rebound in risk assets could be swift. The path becomes more volatile, though not necessarily more bearish over the long term.
The key distinction lies in sequencing: pain first, liquidity later.
The same dynamics apply to precious metals such as gold and silver.
For gold and silver, timing matters less than inevitability. Whether liquidity is deployed early or late, sustained fiscal deficits, rising defence spending and geopolitical fragmentation ultimately require financing.
In a prolonged US–Iran conflict scenario, defence expenditure would rise, fiscal balances would deteriorate further, and the likelihood of future monetary accommodation would increase. Precious metals tend to price that forward.
Under a Warsh-influenced Federal Reserve, the emphasis would likely shift away from permanent quantitative easing and toward balance-sheet-neutral tools.
The Standing Repo Facility would take centre stage. Rather than engaging in continuous bond purchases, banks would access overnight liquidity against high-quality collateral as needed. Liquidity would act as emergency oxygen — available, but not constantly flooding markets.
This framework relies heavily on adjustments to the Supplementary Leverage Ratio (SLR), introduced after the 2008 crisis, which require banks to hold capital against total balance-sheet exposure. Relaxing SLR constraints during periods of stress would allow private balance sheets to expand without immediate central bank asset purchases.
In theory, this preserves market discipline while preventing systemic collapse. In practice, however, geopolitical shocks may shorten the tolerance threshold.
Is the Liquidity Regime Shift Being Accelerated?
The emerging regime shift is not a question of whether liquidity returns. It is about whether policymakers allow volatility to cleanse excess before intervening.
The US–Iran conflict raises the likelihood that stress will arrive sooner than intended.
If energy prices spike, inflation complicates rate decisions. If markets sell off sharply, financial stability risks increase. If fiscal deficits expand due to defence spending, the case for monetary accommodation grows over time.
Geopolitical escalation, therefore, acts as a catalyst. It does not alter the underlying philosophy, but it may force earlier execution.
The paradox is this: a leader advocating discipline may ultimately oversee even more dramatic intervention, simply because the external environment demands it.
A Possible 2026 Outlook
Looking towards 2026, a two-phase scenario emerges — but tensions between the United States and Iran may influence the duration of each phase.
Phase One: Liquidity Discipline
If Kevin Warsh follows the approach outlined, liquidity restraint would dominate early in the year. Quantitative tightening or limited intervention would strengthen the US dollar, weigh on exports, and trigger a correction in risk assets, potentially around mid-year.
However, geopolitical escalation, like spikes in oil prices or defence-driven fiscal expansion, could shorten this phase. Rising energy costs would complicate inflation dynamics, while market volatility might force earlier intervention. In this sense, the US–Iran conflict may not prevent tightening, but it could accelerate the point at which discipline gives way to support.
Phase Two: Liquidity and Legitimacy
In the second phase, liquidity returns, whether through expanded repo facilities or broader intervention if markets begin to fracture.
At the same time, a rejection of central bank digital currency frameworks, combined with formal recognition of Bitcoin, repositions crypto from a purely speculative instrument to a strategic asset. Within this framework, Bitcoin benefits less from excess liquidity and more from institutional legitimacy amid a fragmented geopolitical landscape.
Conclusion
Ultimately, the outcome depends less on ideology than on execution.
One possibility is that Trump tolerates market pain to prioritise domestic growth and structural reform. Another is more tactical: Warsh provides credibility, rate cuts follow, and if markets break under geopolitical strain, aggressive intervention resumes.
In both scenarios, the conclusion converges. Short-term liquidity discipline may strengthen the US dollar and weigh on Bitcoin. Yet if geopolitical tension accelerates fiscal expansion and financial instability, the return of liquidity could arrive sooner than intended.
The path may be volatile, but the destination, renewed monetary expansion, remains difficult to avoid.
1) How does the US–Iran conflict affect global liquidity?
Escalating tensions between the United States and Iran can tighten global liquidity through higher oil prices, increased market volatility, and stronger demand for the US dollar. If conflict disrupts energy supply or increases defence spending, fiscal deficits may widen — increasing the likelihood of future monetary expansion.
In short, geopolitical conflict can initially drain liquidity, but over time it may accelerate the return of monetary support.
2) What is a liquidity regime shift?
A liquidity regime shift refers to a structural change in how central banks manage money supply and financial stress. Under the current system, the Federal Reserve has often deployed liquidity early to stabilise markets.
A regime shift would involve tolerating market volatility first, allowing asset repricing, and only intervening when systemic risk emerges. The difference lies in timing — not the eventual return of liquidity.
3) Why would Kevin Warsh change Federal Reserve policy?
Kevin Warsh has argued that financial markets have become overly dependent on central bank support. His framework suggests limiting continuous quantitative easing and relying more on emergency facilities such as repo operations.
If confirmed, policy may initially emphasise discipline and reduced balance sheet expansion — though history suggests intervention remains likely during systemic stress.
4) Would the US–Iran conflict strengthen the US dollar?
Historically, geopolitical tensions increase demand for safe-haven assets. The US dollar often strengthens during global uncertainty because it remains the primary reserve currency and funding currency for global trade.
However, if prolonged conflict expands fiscal deficits and forces monetary accommodation, longer-term purchasing power erosion could follow.
5) How would Bitcoin react to a liquidity regime shift?
Bitcoin is highly sensitive to global liquidity conditions.
During liquidity restraint, Bitcoin may face short-term pressure due to reduced speculative flows.
If market stress forces renewed monetary expansion, Bitcoin could benefit from increased liquidity and its perception as a scarce asset.
Geopolitical fragmentation may also increase Bitcoin’s strategic relevance beyond pure speculation.
6) Could war accelerate money printing?
War itself does not automatically trigger money printing. However, conflict increases government spending, raises borrowing needs, and heightens financial instability. If markets struggle to absorb rising debt issuance, central banks may eventually intervene to stabilise conditions.
This is why geopolitical escalation can accelerate — rather than prevent — a liquidity cycle.
Start trading now – Click here to create your real VT Markets account
China’s official NBS non-manufacturing PMI came in at 49.5 in February. The consensus forecast was 49.8.
A reading below 50 indicates contraction in non-manufacturing activity. The result was below the expected level.
China Services Construction Signal Weakness
The non-manufacturing PMI for February came in at 49.5, indicating a contraction and missing expectations of 49.8. This suggests China’s economic recovery is faltering more than we thought, especially in the crucial services and construction sectors. We should therefore consider buying put options on China-focused ETFs, such as the FXI, to position for a potential decline in the coming weeks.
This economic weakness increases pressure on the People’s Bank of China to introduce more stimulus. We saw them take aggressive action in late 2025 when they cut the five-year loan prime rate to support the property market, and with youth unemployment recently reported at 15.1%, they may act again. A bearish position on the offshore yuan (CNH) against the US dollar, using futures or options, is a logical response to potential monetary easing.
We must anticipate that slowing activity in China will reduce demand for industrial commodities. Copper prices, which have already seen a 3% dip since their January highs, are particularly exposed to a downturn in Chinese construction. Shorting copper futures or buying puts on related mining company ETFs represents a direct way to trade this view.
The slowdown will also impact global companies that rely heavily on Chinese consumers. European luxury brands, which derive over 25% of their total sales from China, and major technology firms with large supply chain and market exposure are vulnerable. We should be identifying and purchasing protective put options on these specific international stocks, as they are likely to underperform.
Broader uncertainty stemming from China’s weakness could lead to a spike in global market volatility. Historically, during periods of global growth fears, such as the market jitters we observed in the third quarter of 2025, the CBOE Volatility Index (VIX) has risen significantly. Buying VIX call options can serve as an effective hedge or a speculative play on this anticipated increase in market fear.
China’s National Bureau of Statistics (NBS) manufacturing Purchasing Managers’ Index (PMI) was reported at 49 for February. The market expectation was 49.1.
A PMI reading below 50 indicates contraction in manufacturing activity. The 49 result is 1 point below the 50 threshold.
Implications For Industrial Commodities
With China’s February manufacturing PMI coming in at 49.1, signaling a second consecutive month of contraction, we should anticipate continued weakness in industrial commodities. This data points to flagging domestic demand, which directly impacts the consumption of materials like iron ore and copper. For the coming weeks, this supports initiating bearish positions through selling futures contracts or buying put options on major mining companies.
This weak factory data adds to other concerning statistics, such as the 5.2% year-over-year decline in new construction starts reported for the fourth quarter of 2025. The combination of slowing manufacturing and a troubled property sector reinforces a negative outlook for base metals. We see this as an opportunity to look at shorting copper, which is particularly sensitive to Chinese industrial health.
The persistent economic softness increases the likelihood of monetary easing from the People’s Bank of China. We remember how in mid-2025, similar weak PMI readings preceded an unexpected cut to the reserve requirement ratio, causing a sharp drop in the yuan. Traders should therefore consider strategies that profit from a depreciating currency, such as buying US dollar-offshore yuan (USD/CNH) call spreads.
This economic environment will likely cause a ripple effect on global equities with high exposure to the Chinese consumer.
China Exposure And Global Equity Risk
German automakers, for example, saw their sales in China decline by 4% in the last quarter of 2025, and this manufacturing data suggests that trend will not reverse quickly. We believe buying puts on China-exposed ETFs or specific European industrial stocks is a prudent way to hedge or speculate on this downside risk.
Create your live VT Markets account and start trading now.
Start trading now – Click here to create your real VT Markets account
Nikkei falls to its lowest level since early February as geopolitical tensions intensify
Technology stocks lead the selloff, with SoftBank and chipmakers under pressure
Rising oil prices and global uncertainty drive traders toward safer assets
Japan’s Nikkei 225 slid to a one-month low on Wednesday as traders moved away from risk assets amid intensifying conflict in the Middle East.
The index fell sharply during afternoon trading, dropping as much as 4.7% before stabilising near 54,000, marking its third consecutive session of losses. The broader Topix index also declined more than 4%, reflecting broad-based selling across the Japanese market.
The downturn comes as escalating military action between the United States, Israel and Iran unsettles global markets and pushes traders to reassess exposure to equities.
Volatility Signals Rising Market Anxiety
Market volatility increased alongside the equity selloff.
Japan’s Nikkei Volatility Index rose to its highest level since August 2024, indicating stronger demand for protection against further stock-market declines.
Rising volatility typically reflects growing investor uncertainty, particularly during periods of geopolitical tension and macroeconomic instability.
Oil Prices Add to Market Pressure
Escalating conflict in the Middle East has also pushed oil prices higher, further weighing on risk sentiment.
Japanese Prime Minister Sanae Takaichi said she’ll have frank talks on Iran when she meets US President Donald Trump in Washington later this month https://t.co/L6zgmIpWMV
Higher energy prices can raise inflation concerns and increase costs for businesses, particularly in energy-importing economies such as Japan. The surge in crude prices following the latest military strikes has therefore added another layer of pressure on global equity markets.
Technical Structure
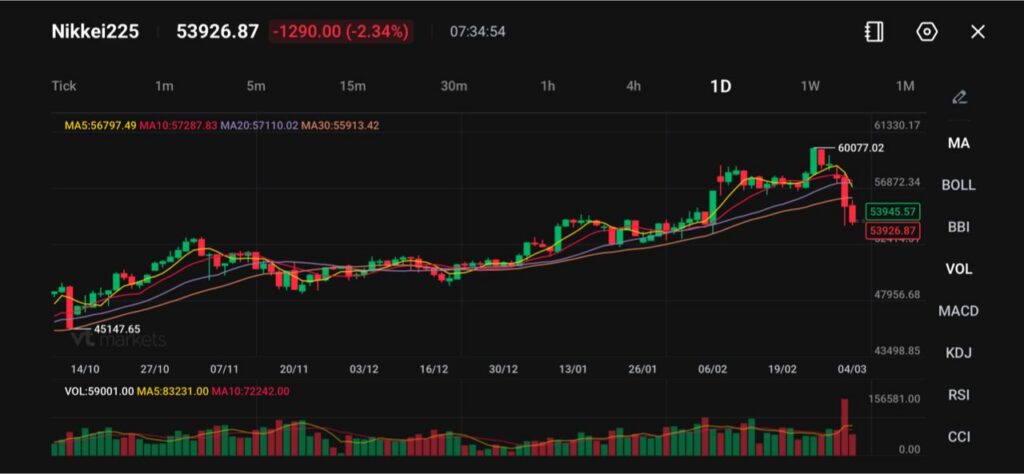
Japan’s Nikkei 225 has come under renewed selling pressure, with the index trading near 53,926, down roughly 2.3% on the session as the recent rally from late December shows signs of exhaustion. The index has retreated sharply from the recent high around 60,077, breaking below short-term momentum levels and signalling a potential corrective phase.
Technically, price has slipped below the 5-day moving average (56,797) and 10-day (57,287), indicating a deterioration in near-term momentum.
The index is now approaching the 20-day average (57,110) from below, while the 30-day average (55,913) sits slightly above the current price zone. This compression of moving averages suggests that the recent uptrend is losing strength and could transition into a period of consolidation or deeper pullback.
Immediate support is seen around the 53,500–54,000 region, where the current decline is attempting to stabilise. A break below this zone could expose further downside toward 52,000, with broader structural support closer to the 50,000 psychological level. On the upside, the 56,800–57,000 area now acts as the first resistance, followed by stronger resistance near 60,000, where the previous rally stalled.
Unless the index can reclaim the 57,000 level in the near term, the bias may remain tilted to the downside, with investors likely to remain cautious following the sharp reversal from recent highs.
Market Implications
The Nikkei’s sharp fall highlights how quickly global macro risks can shift investor positioning.
Escalating geopolitical tensions, rising oil prices and increased market volatility are currently outweighing domestic drivers for Japanese equities. Until global sentiment stabilises, the index may remain sensitive to external developments shaping broader financial markets.
Learn more about trading Energies on VT Markets here.
Frequently Asked Questions
Why is the Nikkei falling today? The Nikkei is declining due to a global risk-off move triggered by escalating conflict between the United States, Israel and Iran, which has increased geopolitical uncertainty.
Why are Asian stocks reacting strongly to the conflict? Asian markets, particularly Japan and South Korea, had previously outperformed global equities. During periods of heightened uncertainty, investors often take profits in stronger markets first.
Why are technology stocks leading the decline? Technology stocks tend to be more sensitive to shifts in investor sentiment and economic expectations. When risk appetite weakens, high-growth sectors often experience larger declines.
What role are oil prices playing in the selloff? Rising oil prices increase inflation risks and raise costs for businesses and consumers. This can negatively affect economic growth expectations and pressure equity markets.
What does the rise in the Nikkei volatility index mean? A higher volatility index indicates that investors are buying protection against potential market declines, signalling increased uncertainty and risk aversion.
Start trading now – Click here to create your real VT Markets account
EUR/USD fell for a third day and moved back below 1.1600 in Asian trading. It rebounded from about 1.1530, its lowest level since November 2025, but then turned lower again.
Fighting in the Middle East continued, raising concern about inflation if the war lasts longer. The US Dollar stayed firm as expectations for rapid Federal Reserve easing fell, and the USD Index remained close to a three-month high set on Tuesday.
Energy Shock Keeps Pressure On Euro
Risk of the Strait of Hormuz closing increased worries about oil and gas supply disruption. Europe’s reliance on imported energy kept pressure on the euro, as higher crude and natural gas prices could hurt the economy.
Markets are watching the final Eurozone Services PMI for near-term moves. In the US, ADP private-sector employment and the ISM Services PMI are due, while geopolitical news remains a key driver of USD demand.
We see the Euro struggling against the US Dollar, and this trend looks set to continue. The pressure comes from two sides: ongoing conflict in the Middle East makes the dollar a safe place for money, while the same tensions create an energy crisis that specifically hurts Europe. This combination suggests that betting against the EUR/USD pair is the logical move.
The recent closure of the Strait of Hormuz is not just a headline; it’s a real supply shock. With Brent crude oil prices now surging past $110 a barrel, a level not seen in over a year, investors are flocking to the safety of the US dollar. This reminds us of similar flights to safety during geopolitical events of the past, reinforcing the dollar’s role as the world’s primary reserve currency.
Policy Divergence And Options Trade Ideas
For Europe, this is a direct economic threat. European natural gas futures (TTF) have already jumped 40% in the last month, and we just saw that final German industrial production for January 2026 fell by a surprise 1.2%. This shows the high energy prices are already damaging the industrial core of the Eurozone economy.
This economic divergence is shifting central bank expectations. While the market now only prices in two potential US Federal Reserve rate cuts for 2026, there is growing speculation the European Central Bank may have to cut rates sooner to support its struggling economy. This growing gap in policy expectations will continue to weigh heavily on the Euro.
Looking back, the pair’s drop to the 1.1530 area in November 2025 was a significant warning. We are now testing those same lows, and the fundamental picture has only gotten worse for the Euro since then. The situation feels very similar to the energy shock Europe experienced back in 2022, which drove the currency down significantly.
Derivative traders should consider buying EUR/USD put options to profit from a further slide. Options with strike prices below the key 1.1500 level, such as 1.1450 or 1.1400, offer a direct way to bet on this expected weakness. Looking at expirations in April or May 2026 would give this trade enough time to play out over the coming weeks.
Another strategy is to sell out-of-the-money EUR/USD call options or establish bear call spreads. This approach benefits from both a falling price and the passage of time. A trader could sell calls with a strike price around 1.1700, which provides a buffer from the current level while collecting premium from those betting on a rebound.
Create your live VT Markets account and start trading now.
Start trading now – Click here to create your real VT Markets account