Back

Supply Risks Intensify Across the Middle East

Key Takeaways

  • Oil prices rose as escalating US-Israel strikes on Iran disrupted Middle East energy infrastructure.
  • Tanker attacks and continued closure of the Strait of Hormuz are tightening supply expectations.
  • Iraq has already cut nearly half its oil production due to export disruptions.
  • US naval escort proposals may stabilise shipping routes but have yet to restore market confidence.

Oil prices moved higher on Wednesday as escalating military conflict between the United States, Israel and Iran disrupted energy flows across the Middle East.

Brent crude rose about 1.4% to $82.53 per barrel after closing at its highest level since January 2025 in the previous session. US West Texas Intermediate climbed to around $75.37, marking its strongest settlement since June.

The latest price gains reflect growing concern that regional supply disruptions may intensify if the conflict continues to damage production and export infrastructure.

Export Routes Under Pressure

The Strait of Hormuz remains the central pressure point for global energy markets.

Iranian forces have targeted tankers passing through the waterway, effectively halting traffic for a fourth consecutive day. Roughly one-fifth of the world’s oil and liquefied natural gas flows through the Strait, making even temporary disruption highly significant for global supply chains.

The conflict has already forced producers and shipping operators to reassess logistics across the region.

Iraq Cuts Output as Export Channels Close

Iraq, the second-largest crude producer in OPEC, has reduced output by roughly 1.5 million barrels per day due to limited storage capacity and blocked export routes.

Officials warned that if exports do not resume soon, nearly 3 million barrels per day of production could be shut down entirely within days.

Such a reduction would represent a substantial tightening of global supply, particularly at a time when geopolitical risk is already elevated.

Military Escorts May Stabilise Shipping

US President Donald Trump said the US Navy could begin escorting oil tankers through the Strait of Hormuz if necessary to restore trade flows.

Washington has also directed the US International Development Finance Corporation to provide political risk insurance and financial guarantees for maritime shipping in the Gulf.

While these measures may help reduce shipping risks, market participants remain cautious. Ship owners and analysts have questioned whether military protection alone will be sufficient to restore confidence.

Technical Analysis

Oil prices remain elevated, with UKOUSD (Brent Crude) trading near $82.40, holding close to recent highs after a strong rally from the December low around $58.96. The broader daily structure shows a clear bullish trend, supported by a sequence of higher highs and higher lows since the start of the year.

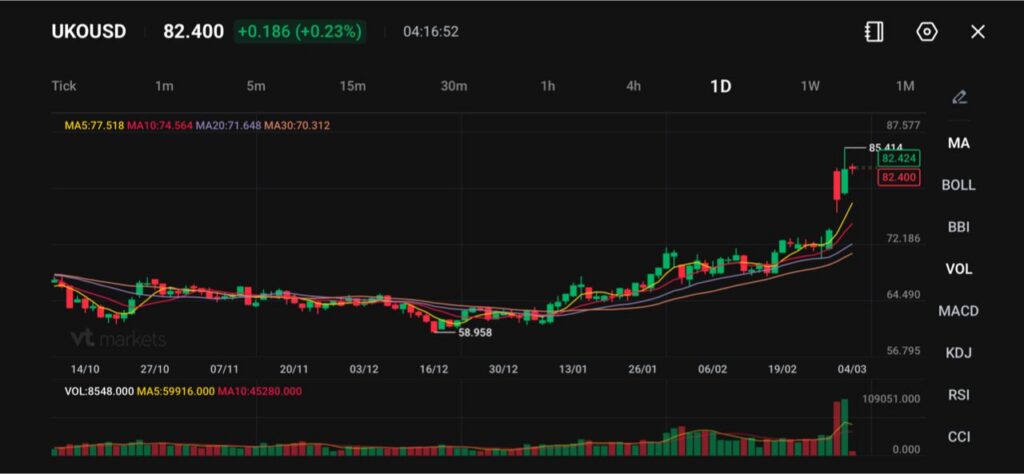
Momentum indicators reinforce the upward bias. The 5-day moving average (77.52) and 10-day (74.56) are sharply rising, while the 20-day (71.65) and 30-day (70.31) remain well below current price levels and continue to trend higher. This wide separation between price and the longer-term averages reflects strong bullish momentum following the recent breakout above the $80 psychological level.

Immediate resistance is located near $85.40, where the latest rally stalled. A decisive break above this zone could extend the move toward $87.50. On the downside, initial support sits around $80.00–$81.00, followed by stronger structural support near $75.00–$77.00, where the short-term moving averages are clustered. As long as prices remain above the $80 region, the near-term outlook remains constructive, though the recent sharp rally may leave room for short-term consolidation before the next directional move.

Global Buyers Seek Alternative Supply

With uncertainty surrounding Middle East shipping routes, major energy-importing countries have begun exploring alternative supply options. India and Indonesia are seeking replacement cargoes, while some Chinese refineries have either reduced operations or brought forward maintenance schedules.

Meanwhile, Saudi Arabia’s Aramco is reportedly attempting to reroute certain exports through the Red Sea to bypass the Strait of Hormuz.

These adjustments illustrate the scale of disruption currently affecting global energy logistics.

Learn more about trading Energies on VT Markets here.

Frequently Asked Questions

  1. Why are oil prices rising?
    Oil prices are increasing due to supply disruptions linked to escalating conflict between the United States, Israel and Iran. Attacks on energy infrastructure and shipping routes have raised concerns about global supply availability.
  2. Why is the Strait of Hormuz so important for oil markets?
    The Strait of Hormuz handles roughly 20% of global oil and liquefied natural gas shipments. Any disruption to traffic through the Strait can significantly affect global energy supply and prices.
  3. How much production has Iraq already cut?
    Iraq has reduced output by around 1.5 million barrels per day due to storage constraints and blocked export routes. Officials warn that production could fall further if exports do not resume.
  4. Could US naval escorts reopen shipping routes?
    US naval escorts may help protect tankers and restore shipping confidence. However, analysts remain uncertain whether military protection alone will be enough to fully normalise traffic.
  5. How are global buyers responding to the disruption?
    Several countries are seeking alternative supply sources. India and Indonesia are exploring new import routes, while some Chinese refineries are adjusting operations due to supply uncertainty.

Start trading now – Click here to create your real VT Markets account

Commerzbank’s Volkmar Baur says China’s Two Sessions will set macro goals, unveil a 2030 plan, affecting yuan

China’s Two Sessions start in Beijing and cover the annual week-long meeting of the Chinese Parliament and the Chinese People’s Political Consultative Conference. The meetings set China’s political priorities and macroeconomic targets. A new five-year plan running until 2030 is due to be published. The macro targets are linked to the Yuan exchange rate.

Key Targets In Focus

The main targets in focus are economic growth and new debt. Provincial growth goals, when weighted by economic size, point to a national target of 5%, slightly lower than last year. New debt last year is estimated at around 9% of GDP, compared with an official figure of 4%. The plan may also include wording or targets related to internationalisation of the RMB. As we enter the new political cycle, it’s useful to look back at the targets set during last year’s Two Sessions in 2025. The key themes then were achieving around 5% growth, managing high levels of hidden debt, and pushing for the international use of the RMB. These same factors continue to shape the trading landscape today. Last year’s growth target was largely met, with China’s official 2025 GDP coming in at 5.2%, but the focus now is on current momentum. Recent data shows the Caixin General Manufacturing PMI for February 2026 registered 50.9, indicating a slight expansion in factory activity for the fourth straight month. This suggests some underlying stability, which could keep downside risks for equity-linked derivatives, like options on the FTSE China A50 index, in check for the near term.

Trading Implications And Positioning

The significant gap between official and true new debt, which we estimated was around 9% of GDP in 2025, remains a primary concern. This underlying leverage continues to weigh on investor sentiment and could cause sharp, unpredictable swings in the market. Traders should consider strategies that protect against sudden downturns in Chinese equities, as any official action on local government debt could trigger volatility. For currency traders, the push for RMB internationalization that was a focus in 2025 has yielded tangible results, with the yuan’s share of global payments via SWIFT reaching 4.61% in January 2026. This policy goal means authorities have a strong incentive to prevent sharp depreciation of the currency. The People’s Bank of China continues to set a strong daily reference rate for the yuan, keeping the USD/CNY pair in a tightly managed range around 7.20. This creates a split environment where the government’s actions are suppressing currency volatility while debt issues could fuel stock market volatility. Therefore, strategies that bet on a stable yuan, such as selling short-dated USD/CNY volatility, may be attractive. In contrast, the ongoing economic balancing act means traders should remain prepared for potential shifts in equity markets. Create your live VT Markets account and start trading now.

Start trading now – Click here to create your real VT Markets account

US total vehicle sales reached 15.8M, surpassing the 15.2M forecast, per February data release

United States total vehicle sales reached 15.8 million in February. This was above the forecast of 15.2 million. The difference between actual sales and the forecast was 0.6 million. The figures indicate sales exceeded expectations for the month.

Implications For Consumer Strength

The strong February vehicle sales data suggests the US consumer is more resilient than we anticipated. This strength in a major sector of the economy forces us to reconsider the timing of expected interest rate cuts. The market may now have to price in a more delayed easing cycle from the Federal Reserve. This report challenges the narrative of a cooling economy that many held throughout 2025. Given that recent Core CPI data has remained sticky around 2.9%, this consumer strength adds weight to the Fed’s “higher for longer” stance. We’ve seen fed funds futures react immediately, with the probability of a rate cut by June 2026 dropping from over 60% to below 40% overnight. For equity derivatives, we should look for upside in automakers and their suppliers. Call options on names like General Motors and Ford, as well as on ETFs like CARZ, are becoming more attractive as earnings estimates will likely be revised higher. Implied volatility in these stocks is expected to rise, reflecting the uncertainty around future demand and financing costs. This data is particularly notable when we look at inventory levels, which have stabilized after the supply chain issues we saw back in 2024 and early 2025. Automakers now have more pricing power than forecasted just a few months ago. This could also signal strength in related sectors, such as auto lenders and parts manufacturers.

Rates Strategy Adjustments

We should adjust interest rate positions accordingly, possibly by selling short-term Treasury futures to hedge against a more hawkish Fed. The economic strength shown here means the central bank has little reason to rush into cutting rates. The market had been too optimistic on the timing of a policy pivot. Create your live VT Markets account and start trading now.

Start trading now – Click here to create your real VT Markets account

UOB economists say Indonesia’s February inflation rose to 4.76%, driven by base effects, gold, food, oil risks

Indonesia’s February CPI rose to 4.76% year-on-year, up from 3.55% in January and above Bank Indonesia’s target range. On a monthly basis, CPI increased 0.68%, after a 0.15% fall in the prior month. The rise was linked to base effects from electricity tariffs, higher gold prices, and food demand ahead of Ramadan. Food inflation was 4.01% year-on-year in February and has stayed above 3% since July 2025.

Drivers Behind The Inflation Spike

Inflation is expected to ease as base effects fade, and the recent drivers were described as non-structural. The report stated these factors are unlikely to change Bank Indonesia’s interest-rate stance. Upside risks were tied to military action involving Iran and the Middle East and its impact on energy prices. A revised Brent crude assumption of about 15% on average over the next three quarters was estimated to add around 0.32 percentage points to overall inflation. On that basis, inflation for 2026 was put at about 2.8–2.9%, within Bank Indonesia’s target range but nearer the upper end. We see that February’s inflation number came in hot at 4.76%, which is well outside Bank Indonesia’s target range of 1.5-3.5%. However, we believe this spike is temporary, driven by one-off base effects and pre-Ramadan food price increases. Consequently, derivative traders should not price in an imminent interest rate hike from the central bank.

Potential Trades And Key Signals

The main risk to the Indonesian Rupiah is not domestic policy but global energy prices. With Brent crude recently hitting $95 per barrel after the latest flare-up in the Middle East, the pressure on the IDR will mount. We should consider buying call options on USD/IDR, as this provides a cheap way to profit from potential Rupiah weakness in the coming weeks. This environment of uncertainty is perfect for volatility plays. Implied volatility on USD/IDR options is likely to rise as traders weigh the temporary domestic inflation against the very real external oil shock. This suggests strategies that benefit from a large price move, such as buying straddles, could be profitable. Looking back, we saw food inflation running consistently hot since the middle of 2025, so this is a persistent issue that oil prices will only worsen. A direct hedge or speculative position would involve going long on Brent crude futures or options. This aligns with the view that oil could climb another 15% over the next few quarters. While we anticipate Bank Indonesia will hold rates steady for now, sustained high oil prices could force their hand later in the year. Therefore, traders should monitor forward rate agreements for the third and fourth quarters of 2026. Any sign that the market is beginning to price in a future hike would be a key signal to adjust positions. Create your live VT Markets account and start trading now.

Start trading now – Click here to create your real VT Markets account

New Zealand’s fourth-quarter Terms of Trade Index rose 3.7%, beating expectations of a 0.7% fall

New Zealand’s terms of trade index rose by 3.7% in the fourth quarter. This was above the forecast of a 0.7% fall. The terms of trade index measures the ratio of export prices to import prices. The 3.7% result indicates an increase in this ratio for the quarter.

Terms Of Trade Surprise Lifts Outlook

The surprise jump in New Zealand’s fourth-quarter 2025 terms of trade, hitting 3.7% against a forecast drop, is a clear bullish signal for the economy. This indicates we are receiving significantly more for our exports relative to what we are paying for imports. Traders should view this as a direct positive for the New Zealand dollar and reassess short positions. This robust economic data makes it much harder for the Reserve Bank of New Zealand to consider cutting interest rates anytime soon. With inflation data from late 2025 still showing a stubborn 4.5% annual rate, well above the target band, this report adds pressure for a “higher for longer” stance. We should anticipate interest rate futures to price out any lingering expectations of a rate cut before the third quarter of this year. The strength appears driven by a recovery in key export prices, particularly in dairy, where recent Global Dairy Trade auctions in February 2026 have shown price increases of over 5%. Looking back at similar periods in 2024, a rising terms of trade directly preceded a period of NZD outperformance against the Australian dollar. This makes long NZD/AUD positions, possibly through call options to limit risk, a logical strategy over the coming weeks. Given the magnitude of this economic surprise, we expect implied volatility on NZD options to rise. The forecast miss is one of the largest we have seen since the post-pandemic recovery period of 2023-2024. This presents an opportunity for traders to sell downside protection, such as out-of-the-money NZD/USD put options, to collect richer premiums while aligning with the bullish fundamental outlook.

Positioning And Volatility Implications

Create your live VT Markets account and start trading now.

Start trading now – Click here to create your real VT Markets account

Amid Middle East tensions, EUR/USD dips but rebounds from 1.1530 lows, trading 1.1618, down 0.63%

EUR/USD fell in the North American session and traded at 1.1618, down 0.63%. It touched a daily low of 1.1530 before rebounding. Rising Middle East tensions supported a safe-haven bid for the US Dollar. A report that Donald Trump ordered the DFC to provide political risk insurance and guarantees for maritime trade, especially energy through the Persian Gulf, pushed oil prices lower and lifted the euro.

Market Drivers And Safe Haven Flows

Trump also said the US Navy could escort tankers through the Strait of Hormuz. The US Dollar Index (DXY) was up 0.50% at 99.04. There was no major US data, but Fed officials spoke. John Williams said policy is “well positioned” and later rate cuts could be appropriate, while Jeffrey Schmid and Neel Kashkari said inflation remains too high and the neutral rate may be higher. Eurozone inflation rose in February but stayed below the 2% goal. HICP increased to 1.9% year on year from 1.7%, while underlying HICP rose to 2.4% from 2.2%. EUR/USD fell below the 200-day SMA at 1.1664, with RSI turning bearish. Resistance levels are 1.1664, 1.1668, 1.1700, and 1.1773; support is 1.1600, 1.1576, 1.1530, and 1.1500. Looking back at the sharp swings of 2025, we see a familiar pattern where geopolitical events create a flight to the US dollar. That dip to 1.1530 and subsequent rebound on a single political announcement serves as a key reminder of how headline risk can override economic data. Traders should position for similar volatility, as the underlying tension between inflation data and geopolitical safety-seeking remains.

Positioning And Volatility Outlook

The focus on the Strait of Hormuz last year has since shifted, but the core issue of maritime trade security persists. We are now seeing disruptions in the Red Sea, which have caused container shipping rates to more than double since December 2025, according to the Drewry World Container Index. This continues to support the US dollar as a safe-haven currency, suggesting that any EUR/USD strength may be short-lived. In the Eurozone, inflation remains a central concern, much like it was back in 2025. The latest flash estimate for February 2026 showed Harmonized Index of Consumer Prices (HICP) at 2.5%, which is down slightly but still stubbornly above the ECB’s 2% target. This puts the ECB in a difficult position, limiting its ability to cut rates and creating uncertainty that options traders can capitalize on. Similarly, the Federal Reserve continues to signal a hawkish stance, echoing the warnings we heard from officials like Jeffrey Schmid last year. With the latest US Consumer Price Index data for January 2026 showing inflation at 3.1%, market expectations for aggressive rate cuts have been significantly scaled back. This fundamental strength for the dollar suggests that selling rallies in EUR/USD could be a viable strategy in the coming weeks. Given this backdrop, we should anticipate continued choppiness, making long options strategies attractive. Implied volatility on EUR/USD options, as measured by the Cboe EuroCurrency Volatility Index (EVZ), has ticked up to 8.2, reflecting the market’s nervousness. Buying straddles or strangles ahead of upcoming central bank meetings or inflation data releases could prove profitable, regardless of the direction the pair moves. From a technical standpoint, the pair is trading well below the levels seen in 2025 and is currently finding resistance near the 1.0900 level. We are seeing significant open interest build up in put options with a 1.0750 strike for the April expiry, indicating that many traders are positioning for a potential downward move. Therefore, using this 1.0900 level to initiate bearish positions or buy protective puts could be a prudent approach for the near term. Create your live VT Markets account and start trading now.

Start trading now – Click here to create your real VT Markets account

Amid escalating Middle East tensions, the US Dollar attracts safe-haven demand as investors grow increasingly concerned

The US Dollar gained safe-haven demand as tensions rose in the Middle East, after remarks from US President Donald Trump and Secretary of State Marco Rubio about possible further action against Iran. Oil prices rose on inflation worries and fears of supply disruption via the Strait of Hormuz. The US Dollar Index traded near 99.10, down from 99.68, its highest level since November 2025. The US Dollar was strongest against the New Zealand Dollar.

Major Fx Pairs And Risk Sentiment

EUR/USD traded near 1.1600 after earlier falling to its lowest since November 2025. GBP/USD was near 1.3330 after falling and then recovering during the American session, following comments from Iran’s UN envoy and reports of sirens in Kuwait. USD/JPY rose to about 157.50 and later eased back. AUD/USD traded near 0.7050 after an earlier drop, with attention on Australia’s Services PMI, Q4 GDP, and China’s PMI data. Gold traded at $5,118 after touching $5,379 earlier, with higher US Treasury yields weighing on the metal. Central banks added 1,136 tonnes of gold worth about $70 billion in 2022, the highest annual purchase on record. Key releases span 4–6 March, including Australian Q4 GDP, Swiss CPI, Eurozone PPIs, US ADP jobs, ISM services data, the Fed Beige Book, US jobless claims, and US nonfarm payrolls.

Strategy Considerations And Hedging

Given the sharp escalation in Middle East tensions, we should anticipate continued safe-haven flows into the US Dollar. This environment makes holding long-dollar positions attractive, possibly through buying put options on pairs like EUR/USD and AUD/USD to hedge against sudden reversals. The US Dollar Index pulling back from its recent November 2025 highs offers a potentially better entry point for such strategies. The significant risk to oil supply through the Strait of Hormuz is a primary concern and a direct catalyst for higher crude prices. This situation is reminiscent of the market reactions we saw during similar regional flare-ups back in 2019 and early 2020, which caused short-term price spikes. Therefore, buying out-of-the-money call options on WTI or Brent crude futures could provide a cost-effective way to speculate on further supply disruptions. Gold’s position is complex, as its safe-haven appeal is being challenged by a strong dollar and rising Treasury yields. With the price already elevated above $5,100, much of the geopolitical risk may already be priced in. Traders could use options strategies like straddles or strangles to profit from the high volatility, regardless of whether the price breaks higher or corrects sharply. The market’s “fear gauge,” the CBOE Volatility Index (VIX), has likely jumped over 40% in the last week to trade above 28, making options premiums expensive but reflecting the high degree of uncertainty. This week is packed with crucial economic data, most importantly the US Nonfarm Payrolls report on Friday. After the unexpectedly strong +350,000 jobs print we saw in January’s report, another robust number could temporarily distract from geopolitics and cause sharp, unpredictable swings. This conflict adds fuel to an already inflationary environment, with recent US CPI data showing inflation holding stubbornly above 4.5% year-over-year. A sustained rise in oil prices would complicate matters for the Federal Reserve, potentially forcing it to remain hawkish even amid growing global instability. This backdrop supports strategies that benefit from continued market turbulence, as central bank policy and geopolitical events pull the market in opposing directions. Create your live VT Markets account and start trading now.

Start trading now – Click here to create your real VT Markets account

Amid Iran conflict, the US Dollar strengthens, lifting USD/JPY near 157.77, its highest since 23 January

USD/JPY rose on Tuesday as broad US Dollar strength put pressure on the Japanese Yen. The pair traded near 157.77, its highest level since 23 January. Tensions in the Middle East linked to the US-Iran conflict increased demand for the US Dollar as a safe-haven. The situation also raised inflation concerns as fears of supply disruption through the Strait of Hormuz lifted oil prices.

Middle East Tensions Drive Safe Haven Flows

Japan, a major energy importer, faces exposure to higher oil costs. Rising energy prices can add to inflation and weigh on economic activity. Traders are revising expectations for central bank policy as inflation risks increase. Reuters, citing three sources, reported it has become difficult for the Bank of Japan to raise rates as policymakers assess the new crisis. In the US, markets are fully pricing in the Federal Reserve to keep rates unchanged at the March and April meetings. The chance of a 25-basis-point cut in June fell to 28.1% from 42.8% a week earlier, according to the CME FedWatch Tool. Japanese officials said they are monitoring the Yen’s weakness. Finance Minister Satsuki Katayama said they are watching markets with an “extremely strong sense of urgency.”

Key Risks To The Bullish Dollar Yen View

Attention now turns to US data due this week, including ADP Employment Change and ISM Services PMI on Wednesday. Nonfarm Payrolls and Retail Sales are due on Friday. We are seeing the US Dollar strengthen against the Japanese Yen due to escalating conflict in the Middle East, pushing the pair toward 158.00. This rally is driven by the dollar’s safe-haven appeal and rising oil prices, which directly harm Japan’s economy. The ongoing tensions have pushed West Texas Intermediate crude oil prices up by over 12% in the last month to nearly $96 a barrel, a level not seen since late 2024. This sustained pressure on energy costs makes it very difficult for the Bank of Japan to consider raising interest rates. We believe this policy divergence between a hesitant BoJ and a Federal Reserve holding rates firm will be the primary driver of USD/JPY in the near term. The probability of a Fed rate cut by June has now fallen below 30%, showing how much market sentiment has shifted. For the next few weeks, buying call options on USD/JPY with strike prices targeting the 159.00 to 160.00 range seems like a prudent strategy. This approach allows us to capitalize on the clear upward momentum while defining our risk. Implied volatility has increased, but the underlying fundamental story supports paying a higher premium. However, we must watch for intervention from Japanese authorities as the yen weakens. We remember how they aggressively bought yen in the autumn of 2022 when USD/JPY crossed 150, and the current “strong sense of urgency” from officials suggests they could act again. A sudden intervention is the most significant risk to this bullish outlook. This week’s US jobs and retail sales data will be a critical test for the dollar’s strength. A surprisingly weak Nonfarm Payrolls report on Friday could reignite hopes for earlier Fed rate cuts and cause a sharp pullback in the pair. We should be prepared for heightened volatility around these key economic releases. The current market dynamic is a stark contrast to the sentiment we saw in mid-2025, when the Bank of Japan’s hawkish tone briefly strengthened the yen. At that time, global energy markets were stable, allowing the BoJ more policy flexibility. The recent conflict has completely erased that narrative, putting yen weakness back at the forefront. Create your live VT Markets account and start trading now.

Start trading now – Click here to create your real VT Markets account

S&P 500 digested weekend Middle East news premarket; initial selling gave way to immediate buyer dominance early on

The S&P 500 reacted to weekend developments in the Middle East, dropping early and then attempting to form a low in premarket trading. After the opening bell, sellers were expected to push prices lower, but buyers took control in the first minute and drove a reversal. Intraday positions were taken to benefit from the move higher, with gains managed near the session high. Later, the upward move faded, and the market moved down again, matching the premarket decline.

Market Reaction And Key Questions

The text raises the possibility of another rebound after the open, and questions whether Middle East news may be priced in for a longer period. Monica Kingsley is described as a trader and financial analyst who has served clients since February 2020. Given the market’s initial dip and sharp reversal on Middle East news, we see a battle between short-term algorithms buying the dip and more cautious investors selling into strength. This pattern suggests that intraday rallies are fragile and should not be trusted without confirmation. The euphoria is fading quickly, meaning any upside moves are prime opportunities to position for renewed weakness. This uncertainty is reflected in the market’s fear gauge, as the CBOE Volatility Index (VIX) just jumped over 25% last week to trade above 20, a level we haven’t seen since October 2025. At the same time, WTI crude oil has pushed past the key $90 per barrel mark, threatening to reignite inflation fears. These are not abstract risks; they represent real costs to the economy that the market is just beginning to process. The sudden spike in energy prices complicates the Federal Reserve’s position, as the market had been pricing in a potential rate cut by mid-year. We saw how sticky inflation proved throughout 2025, and this new variable makes the upcoming February CPI report incredibly important. Any sign that inflation is re-accelerating could put the Fed back in a hawkish stance, removing a key support for stock prices.

Possible Trading Responses And Risk Management

In response, traders should consider buying protection against further downside in the S&P 500. Purchasing SPY or SPX put options with expirations in late March or April offers a direct hedge against a market drop. For those expecting continued sharp swings in either direction, long straddles on volatile tech names could profit from the rising implied volatility itself. We must remember that the dip-buying strategy that worked so well through the second half of 2025 was driven by hopes of a soft landing and falling inflation. The current environment is fundamentally different, with tangible geopolitical risks now directly impacting energy and inflation data. Betting on another immediate and sustained rip higher seems far riskier now than it did just a month ago. Create your live VT Markets account and start trading now.

Start trading now – Click here to create your real VT Markets account

On Tuesday, gold falls over 4% as surging US Treasury yields pressure its safe-haven appeal

Gold fell over 4% on Tuesday as higher US Treasury yields and a firmer US Dollar weighed on the metal. XAU/USD traded at $5,104 after hitting an intraday low of $4,997. The conflict involving the US, Israel and Iran entered its fourth day, with reports of explosions in Tehran and Beirut. WTI rose 6.74% to $75.80 per barrel, supported by threats from the Iranian Revolutionary Guard to keep the Strait of Hormuz closed.

Dollar And Yields Pressure Gold

The US Dollar Index gained nearly 0.70% to 99.21, while the 10-year US Treasury yield rose to 4.059%, up almost three basis points. Markets priced 44 basis points of Federal Reserve easing by year-end. New York Fed President John Williams said policy is “well positioned” and that rate cuts may be warranted if inflation follows his expected path. Kansas City Fed President Jeffrey Schmid and Minneapolis Fed President Neel Kashkari said inflation remains too high, with Schmid citing a 2% goal. This week’s US data includes ISM Services PMI on Wednesday, jobless claims on Thursday, and Nonfarm Payrolls on Friday. Near-term chart levels include resistance at $5,100, $5,200, $5,249, $5,300, $5,379, and $5,419, with support at $5,000, $4,950, $4,841, and the 50-day SMA at $4,810. Central banks added 1,136 tonnes of gold worth about $70 billion in 2022, the highest annual purchase on record. Gold often moves opposite to the US Dollar and US Treasuries, and can respond to conflict, inflation concerns, and interest-rate expectations.

Lessons From Last Years Drop

We recall this time last year, in early March 2025, when gold experienced a sharp 4% drop despite escalating geopolitical tensions. The market was unusual, as a flight to safety strengthened the US Dollar and Treasury yields, which worked against the yellow metal. That dynamic, where the dollar rally overshadowed gold’s traditional safe-haven role, provides an important lesson for today. The current environment shows some key differences, although uncertainty remains. As of today, the US 10-year Treasury yield is trading around 3.85%, which is lower than the 4.059% level that pressured gold during the 2025 sell-off. This relatively lower yield should offer better underlying support for a non-yielding asset like gold in the weeks ahead. The conflict in the Middle East, which pushed WTI crude oil towards $76 a barrel last year, has evolved, but energy prices continue to be a factor. Current WTI prices are hovering near $79 per barrel, keeping inflation concerns alive and complicating the Federal Reserve’s path. This sustained price pressure means we cannot rule out a hawkish surprise from the Fed, similar to the sentiment expressed by some officials in 2025. Last year, the market was pricing in 44 basis points of Fed easing for the entire year. Today, after a series of cuts through late 2025 and early 2026, the debate is now about the timing and depth of the next move. This week’s Nonfarm Payrolls report will be critical, as any sign of persistent economic strength could delay further rate reductions and create headwinds for gold. For derivative traders, this suggests that implied volatility in gold options may rise heading into key data releases. Given the persistent geopolitical risks and the uncertain Fed path, using options to define risk, such as through bull call spreads or bear put spreads, could be a prudent approach. These strategies allow for participation in a potential price move while capping the maximum loss. We also have to consider the strong underlying demand from central banks, a powerful trend that has continued since the record-breaking purchases of 1,136 tonnes in 2022. The World Gold Council’s latest reports show that central banks globally added over 800 tonnes to reserves in 2025, with emerging markets leading the buying. This consistent institutional demand provides a strong floor for the price and should discourage overly aggressive short positions. Create your live VT Markets account and start trading now.

Start trading now – Click here to create your real VT Markets account

Back To Top
server

Hello there 👋

How can I help you?

Chat with our team instantly

Live Chat

Start a live conversation through...

  • Telegram
    hold On hold
  • Coming Soon...

Hello there 👋

How can I help you?

telegram

Scan the QR code with your smartphone to start a chat with us, or click here.

Don’t have the Telegram App or Desktop installed? Use Web Telegram instead.

QR code