Back

Gold edges down as reduced Middle East tensions lift the US Dollar, limiting safe-haven demand

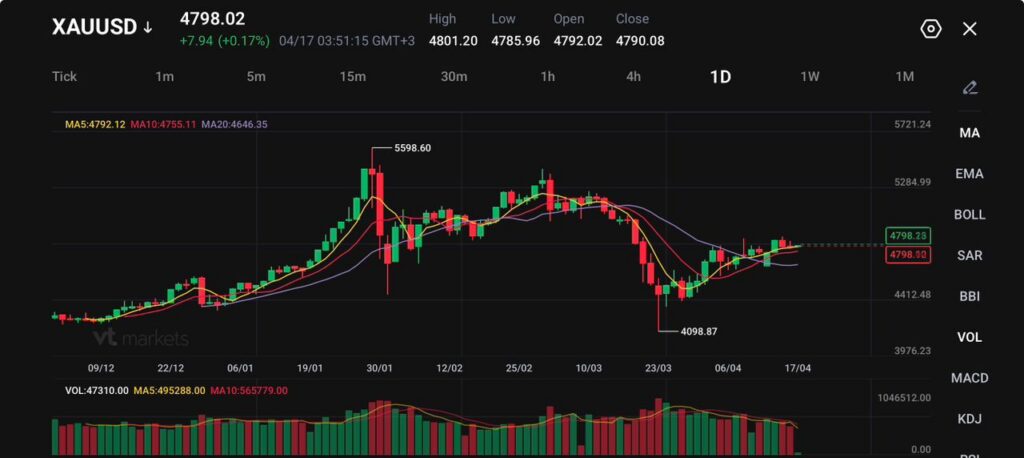
Gold edged down in the US session as Middle East tensions eased amid moves to restart US-Iran talks and a proposed Israel-Lebanon ceasefire. XAU/USD traded at $4,784, down 0.13%.

The US Dollar strengthened, with the US Dollar Index up 0.21% at 98.25, adding pressure to bullion. US equities rose as markets assessed the outlook for a Washington-Tehran deal.

Us Iran Talks Narrow Differences

Reports said the US and Iran are narrowing gaps, including on the Strait of Hormuz. Iran is seeking the release of frozen funds in exchange for allowing ships to transit via Omani waters, while the nuclear issue remains unresolved.

Donald Trump said Israel and Lebanon would begin a 10-day ceasefire at 5:00 PM EST (21:00 GMT). The pause aims to halt fighting between Israel and Hezbollah during the Iran conflict.

US Initial Jobless Claims fell to 207K for the week ending April 11, versus 215K expected and 218K prior. US Industrial Production slipped from 0.7% to -0.5% month-on-month in March, led by motor vehicles, parts, and utilities.

New York Fed President John Williams said the Iran conflict is pushing prices up and expects higher headline inflation. Governor Stephen Miran said he expects three rather than four rate cuts due to “less favorable” inflation.

April 2026 Gold Market Shift

We are looking at a much different picture now in April 2026 than we saw back in 2025 when Mideast de-escalation hopes briefly pushed gold down to the $4,780s. While those geopolitical tensions continue to simmer, providing a floor for prices, the primary driver has shifted. Gold is currently trading around $5,150, showing that underlying demand has overpowered the temporary risk-off sentiment we saw last year.

The Federal Reserve’s outlook, which hinted at three or four rate cuts in 2025, has since become more complex due to persistent inflation. Recent data for March 2026 showed the Consumer Price Index (CPI) remains elevated at 3.4% year-over-year, which is complicating the Fed’s path forward. This sticky inflation keeps gold attractive as a hedge, even if it means interest rates stay higher for longer.

A critical factor supporting this rally has been the relentless buying from central banks, a trend that accelerated significantly after 2022. According to the latest World Gold Council data, central banks collectively added over 1,037 tonnes in 2023, and reports indicate this aggressive purchasing continued through 2025 and into this year. This activity creates a strong institutional bid in the market, suggesting any significant price dips will likely be met with buying.

Despite gold’s strength, traders must watch the resilient US Dollar, which currently sits near 105 on the DXY. A strong dollar typically acts as a headwind for bullion, and the healthy US labor market, with initial jobless claims at a low 212,000 for the week ending April 11, 2026, supports the greenback. This creates a tense standoff between a strong dollar and powerful fundamental demand for gold.

For the coming weeks, this suggests a strategy of buying on weakness may be prudent, as the long-term bullish case from inflation and central bank demand remains intact. Traders could consider using options to define risk, such as buying call spreads to target a move toward the $5,250 resistance level while capping upfront costs. The $5,050 level now appears to be a key area of support to watch for entry points.

Create your live VT Markets account and start trading now.

Gold Steady as Softer Dollar Offsets Iran Truce

Key Points

  • XAUUSD trades at 4,798.02, up 7.94 (+0.17%), with spot gold holding near $4,841.76 and June futures at $4,866.50.
  • The US dollar remains near its weakest level in more than a month, which is keeping bullion supported.
  • Markets now see about a 30% to 33% chance of a 25 basis-point Fed cut this year, up from roughly 13% a week earlier.

Gold is holding steady because the market still has not received a clean answer on whether the latest diplomacy will produce a durable break in the conflict. Spot prices are sitting close to a one-week high, while futures remain near the upper end of the recent range.

That has kept bullion well supported even as broader risk appetite improved.

The market has moved out of panic mode, but it has not moved into full confidence either. Negotiation headlines have reduced the immediate war premium in oil, yet uncertainty around the Strait of Hormuz and the wider regional backdrop is still keeping a layer of caution under precious metals.

A cautious near-term view still favours support for gold while talks remain unresolved and the dollar stays soft.

Softer Dollar Carries Most of The Support

The dollar is doing most of the short-term heavy lifting for gold. With the greenback near its weakest level in over a month, bullion has become more affordable for non-dollar buyers. That has helped gold stay resilient even as oil eased and equities recovered.

That combination is important because gold is not rallying off a pure fear trade right now. It is getting support from currency weakness and from a market that is slowly rebuilding the possibility of easier policy later in the year. As long as those two factors stay in place, bullion can remain firm without needing a full risk-off backdrop.

Fed Not Off the Hook

The rates picture has shifted in gold’s favour, but only partially. Traders have lifted the chance of one Fed cut this year to around 30% to 33%, which is a clear improvement from around 13% last week. Even so, the market is still far less dovish than it was before the war shock.

That leaves gold in a balanced position. Lower yields and a softer dollar support the metal, but policymakers are still warning that energy costs are feeding into broader inflation. New York Fed President John Williams said the war is already pushing inflation higher through energy and other channels, with inflation likely to remain above 3% in the near term.

A cautious forecast still points to a supportive backdrop for gold, though a hotter inflation path would slow any upside extension.

XAUUSD Technical Outlook

XAUUSD is trading near 4798, holding steady after its recent recovery from the 4098 low, with price now moving sideways just below a short-term resistance zone.

The rebound has stabilised, but momentum has slowed, suggesting the market is entering a consolidation phase as it builds a base after the prior decline.

From a technical standpoint, the structure is neutral to slightly constructive in the near term. Price is sitting around the 5-day (4792) and 10-day (4755) moving averages, which are flattening and offering immediate support.

The 20-day (4646) remains below as a stronger base, indicating that while recovery is intact, upside momentum is not yet strong enough to break into a sustained trend.

Key levels to watch:

  • Support: 4790 → 4755 → 4645
  • Resistance: 4850 → 4900 → 5050

Gold is currently consolidating just below the 4850 resistance area. A firm break above this level could open the path toward 4900, with further upside potential toward 5050 if momentum builds.

On the downside, 4790 is acting as immediate support. A move below this level could trigger a pullback toward 4755 and potentially 4645 if selling pressure increases, though such a move would likely remain corrective within the broader structure.

Overall, XAUUSD is range-bound with a slight upward bias, as price compresses between support and resistance. The next move will likely depend on whether buyers can push through 4850 or if the market rolls back into deeper consolidation.

What Traders Should Watch Next

The next move depends on whether diplomacy with Iran produces anything durable and whether the Fed can stay patient without letting inflation expectations drift higher. A stable dollar pullback and steady progress in talks would keep gold supported near the current highs. A stronger inflation scare or a breakdown in negotiations would change the mix quickly, either by rebuilding safe-haven demand or by reviving higher-for-longer rate pressure.

Learn more about trading Precious Metals on VT Markets here.

Trader Questions

Why Is Gold Holding Near $4,800 Even As Ceasefire Hopes Improve?

Gold is staying firm because the softer US dollar and improved rate-cut expectations are offsetting some of the risk-on shift from the latest Iran diplomacy. Spot prices have remained near the recent $4,841.76 area even as oil pulled back.

Why Does A Weaker Dollar Support Gold Prices?

Gold is priced in dollars, so a weaker dollar makes bullion cheaper for buyers using other currencies. That usually improves demand and helps keep prices supported. The dollar has been trading near its weakest level in more than a month.

Why Has Gold Not Broken Higher More Aggressively?

The market is balancing support from the weaker dollar against reduced panic over the Middle East. Traders are no longer in full defensive mode, and ETF flows show some investors are still taking money off the table rather than chasing the rally. SPDR Gold Trust holdings fell 0.5% to 954.48 tonnes.

How Have Fed Rate Expectations Shifted For Gold?

Markets now see about a 30% to 33% chance of one 25 basis-point Fed cut this year, up from roughly 13% a week earlier. That is more supportive for gold than before, but it is still less dovish than the pre-war expectation for two cuts.

Why Do Rate-Cut Expectations Matter So Much For Gold?

Gold does not pay interest, so it tends to perform better when bond yields and rate expectations fall. If traders become more confident that the Fed can ease later in the year, the opportunity cost of holding gold falls.

Start trading now – Click here to create your real VT Markets account

Outside the White House, Trump told reporters the US was nearing an agreement with Iran amid tensions

US President Donald Trump spoke to reporters outside the White House on Thursday about the confrontation with Iran. He said the US was making a lot of progress with Iran and that a deal could be close.

Trump said he was not sure a ceasefire needed to be extended. He said Iran was willing to do things they previously were not prepared to do.

Deal Signals And Geopolitical Risk

He said that if there was no deal with Iran, fighting would resume. He also said Iran had agreed it would not have a nuclear weapon.

Trump said Iran had agreed to give back “the nuclear dust”. He added that Iran had agreed to almost everything.

He said that if an Iran deal was signed in Islamabad, he might go to China.

These statements signal that a deal with Iran is being presented as highly probable, which suggests a coming drop in market volatility. The primary risk is a sudden reversal if talks collapse, as the alternative is a return to fighting. Derivative traders should position for a significant decline in geopolitical risk premium over the next few weeks.

Oil Market And Volatility Trades

We see the most direct impact on oil prices, which are currently trading at $87 for a barrel of WTI. The potential return of over 1.3 million barrels of Iranian oil per day to the market would create significant downward pressure. We should consider buying June puts on WTI or selling call spreads to capitalize on a potential price drop towards the low $80s.

This de-escalation would also crush implied volatility across asset classes. The VIX index, which has been hovering around 18 due to these tensions, could quickly fall back toward its 15-point average. Selling VIX futures or out-of-the-money calls expiring in May seems like a prudent strategy.

Lower energy costs and reduced global tension would be a tailwind for the broader stock market. This suggests a bullish stance on equity indices like the S&P 500. We believe buying call options on SPY with a June expiration could provide upside exposure to a relief rally.

However, we must remember the tensions from last fall in 2025, which showed how quickly the situation can deteriorate. The comment that fighting will resume if there is no deal is a clear warning. A small allocation to cheap, long-dated put options on equities can serve as an effective hedge if this optimism proves misplaced.

A peace dividend would likely pressure the defense sector, which rallied throughout the confrontations in 2025. We could see a rotation out of these names as the threat of a major conflict subsides. Buying puts on defense ETFs or major contractors could be a profitable contrarian play against the recent run-up.

Create your live VT Markets account and start trading now.

Standard Chartered economists Madhur Jha and Ethan Lester evaluate how Middle East conflict risks may influence global remittance flows

Standard Chartered economists assess how the Middle East conflict could affect global remittances. They say Gulf Cooperation Council (GCC) economies are major sources of remittances to Egypt, Pakistan, the Philippines, Bangladesh and Sri Lanka.

They describe an energy price shock as a key risk to the global economy, with the possibility of recession if it lasts. They also point to physical disruption to oil and gas supply and wider effects on economies, especially in Asia.

Risks To Trade And Supply Chains

They note that other goods moving through the Strait of Hormuz could also face disruption. This could threaten downstream production activity in multiple sectors.

The note says GCC economies host many expats who send personal remittances that support balance of payments positions in recipient countries. It also states the Middle East has become both a destination and a source for international travel and tourism.

On remittances, they say the effect of the conflict is not clear-cut. During COVID-19, early estimates expected remittances to fall by 20–40%, but they declined by 2.4% year on year in 2020.

They state the non-oil economic impact is unlikely to match COVID-19. They add that evidence so far shows limited expat withdrawal, but a prolonged conflict could increase relocation and reduce remittance flows.

Market Hedging And Volatility Signals

The primary risk we see is the energy price shock, which threatens to push the global economy into a downturn. Recent reports from last week indicate a breakdown in ceasefire negotiations, and Brent crude futures just topped $95 a barrel for the first time this year. This suggests traders should consider buying call options on WTI or Brent to hedge against further supply disruptions through the Strait of Hormuz.

We are also watching for broader impacts, especially on the currencies of countries heavily reliant on remittances from the Gulf, like Egypt and Pakistan. While there isn’t a mass exodus of workers yet, the World Bank’s latest report noted a 3% dip in remittance flows to South Asia for Q1 2026, flagging it as a growing concern. Derivative traders could look at purchasing put options on currencies like the Philippine peso (PHP) or the Pakistani rupee (PKR) as a hedge against a worsening conflict.

When we look back at the 2020 pandemic, we remember that initial fears of a remittance collapse were surprisingly overblown as flows only dipped globally by 2.4%. However, this situation is different; a persistent conflict creates physical risk, raising the chances of worker relocation in a way the global pandemic did not. This underlying risk of people actually leaving the region is not yet fully priced into the market.

The uncertainty of a prolonged conflict is already causing jitters in the broader market. We’ve seen the VIX, the market’s fear gauge, climb by 5 points in the last two weeks alone. Traders should consider long positions on volatility indices as a direct play on this escalating tension, which also impacts sectors like international travel and tourism.

Create your live VT Markets account and start trading now.

Gold stays range-bound as traders await clearer US-Iran talks, with oil-led inflation limiting upside gains

Gold fell back on Thursday but stayed in a multi-week range. XAU/USD traded near $4,790 after a high of $4,838, with a firmer US Dollar weighing on it.

Talks to end the US-Iran war remained in focus after Donald Trump said negotiations could resume this week following talks in Islamabad that failed to bring a breakthrough. Gulf and European officials told Bloomberg a deal could take up to six months and called for a ceasefire extension and the reopening of the Strait of Hormuz.

Geopolitical Risk And Hormuz Uncertainty

Iran moved to formalise control over the Strait of Hormuz, with state media saying any transit tolls would be paid via Iranian banks. Pakistan-led diplomacy continued, with an Iranian official citing narrower differences in some areas, but ongoing disputes over nuclear issues.

Gold traded about 10% below its post-war peak as oil-related inflation risks kept rate expectations elevated. St. Louis Fed President Alberto Musalem said supply shocks threaten inflation and employment goals, and said core inflation could stay near 3% through year-end.

Technically, gold was below the 50-day SMA near $4,897, with support at the 100-day SMA near $4,708. RSI was around 51 and ADX near 24.

We are looking at a gold market that remains range-bound, a direct consequence of the oil price shock from the US-Iran conflict in 2025. The ongoing, slow-moving peace talks create persistent uncertainty, making strong directional bets risky. For now, gold is consolidating as it awaits a clearer catalyst for its next major move.

Options Strategies For A Range Bound Market

Although Brent crude has fallen from its peak of over $150 a barrel last year, it has settled near a stubborn $95, keeping inflation concerns alive. The most recent March 2026 CPI report confirmed this, with core inflation holding at a sticky 2.8%. This reinforces the Federal Reserve’s decision to keep interest rates unchanged for the time being.

Given this environment, a long straddle or strangle options strategy on gold futures appears sensible for the coming weeks. This involves buying both a call and a put option, positioning to profit from a significant price breakout in either direction. The strategy benefits from the rising volatility expected if peace talks succeed or suddenly collapse.

For those betting on continued stagnation, selling volatility through an iron condor could be a viable approach. This strategy defines a clear profit range, capitalizing on the market staying between key support and resistance levels. It profits from time decay as long as gold does not make a sharp move before the options expire.

The key technical levels from last year remain critical, with support near the $4,700 mark and significant resistance just under $4,900. A decisive break of this channel, likely triggered by news from the upcoming Geneva talks or a surprise inflation report, should be the signal to act. Until then, implied volatility in gold options remains relatively low, making these strategies more affordable.

Create your live VT Markets account and start trading now.

Deutsche Bank economists warn Middle East conflict-driven oil and gas price rises threaten Germany’s economic recovery

Deutsche Bank economists said higher oil and gas prices linked to the Middle East conflict are weighing on the German economy. They kept their 2026 GDP forecast at 1.0%, citing expansionary fiscal policy and momentum in Q1.

They said private consumption, inflation, and quarterly GDP in 2026–2027 are exposed if energy disruption lasts longer. They expect weaker purchasing power and higher uncertainty to curb spending.

Energy Prices And German Growth

They projected Q2 growth at near stagnation, down from a prior 0.2% quarter-on-quarter. They said fiscal policy support underpins their baseline quarterly GDP profile.

Under a worse energy shock, they estimated 2026 growth could fall to roughly 0.5%, with 2027 at 1.0%. In that case, they said annual average consumer price inflation could be well above 3.0% in both 2026 and 2027.

The article stated it was created with the help of an AI tool and reviewed by an editor. It was published via FXStreet Insights, which compiles selected market commentary from external and internal analysts.

We are currently facing a split outlook for the German economy, where strong government spending is battling against the drag from high energy prices. Given the wide range of potential outcomes for GDP this year, a primary strategy should be to position for increased market volatility. Traders could consider buying straddles or strangles on the DAX index, or purchasing call options on the VDAX-NEW volatility index.

Positioning For Higher Volatility

The risk of a significant slowdown is growing, especially as we head into the second quarter. The latest ZEW Economic Sentiment survey for April fell sharply to -5.2, reflecting pessimism about the next six months, and with tensions in the Middle East pushing Brent crude back over $95 a barrel last week, the downside scenario looks increasingly plausible. This environment warrants considering protective put options on the DAX to hedge against weakening private consumption.

Inflation remains a critical factor that could complicate the picture and pressure the euro. The most recent flash estimate for German CPI in March 2026 showed a rise to 2.9%, and if the adverse energy scenario unfolds, inflation could get stuck well above 3.0%. This stagflationary environment would make it difficult for the ECB to act, suggesting short positions on the EUR/USD could be an effective trade.

The direct trigger for this economic pressure remains the energy markets. European TTF natural gas prices have also climbed as German gas storage levels, reported this week at 68%, are running slightly below the five-year average for mid-April. For those convinced the geopolitical situation will not de-escalate soon, call options on energy ETFs or oil futures offer a direct way to trade this view.

Conversely, any sign of easing energy prices could allow the underlying economic momentum to resurface, powered by the fiscal support measures we saw enacted in the second half of 2025. A significant drop in oil prices would be a strong signal to unwind bearish positions and re-establish long exposure to German equities. This makes call options on German industrial sector leaders a viable strategy for a potential rebound.

Create your live VT Markets account and start trading now.

Traders monitor PepsiCo’s earnings, watching two resistance levels, as its household snack and beverage brands dominate

PepsiCo shares are trading near $157.55 on an earnings day, with attention on technical price levels. The stock rallied from about $137 in mid-January to a high of $171.46 in early February.

After that rise, the price pulled back and has traded in a $152 to $160 range for several weeks. Earnings can move the price up or down, while chart levels are used to map possible resistance and support areas.

The first overhead resistance level is a gap fill at $163.97, created during the early March sell-off. At $157.55, the share price is about $6 below $163.97.

If the price moves higher after earnings, $163.97 is the first area where selling pressure may appear. A further resistance level is the prior peak at $171.46 from early February.

On the downside, a daily close below the $153 to $154 area would shift focus to support near $150. The main levels tracked are $163.97 and $171.46 above, and $153 to $154 and $150 below.

The article also notes the use of risk management.

Last year in 2025, we were watching PepsiCo consolidate in the $152 to $160 range, with our eyes on key resistance levels at $163.97 and $171.46. The stock eventually broke through those levels in the second half of the year, rewarding those who were patient. Now, in April 2026, the technical picture has evolved significantly.

As of today, PEP is trading around $185, having recently reported mixed Q1 earnings where profits beat expectations but revenue guidance was cautious. Recent government data shows consumer spending on at-home food and beverages is up 3.2% year-over-year, which provides a tailwind for the company. However, the stock is struggling to break past the all-time high of $192 set back in March.

For traders looking for upside, a bullish call spread could be a measured approach to target a move toward that $192 resistance. One might consider buying the May $187.50 call and selling the May $192.50 call to define risk and lower the cost of the trade. This strategy profits if PEP grinds higher in the coming weeks but limits the potential gain if it surges unexpectedly.

On the other hand, if the cautious guidance weighs on the stock and it breaks below the 50-day moving average near $180, a bearish position could be warranted. Buying May $180 put options would offer a direct way to play the downside, especially as the stock’s forward P/E ratio of 24 is near the top of its historical range. This makes it vulnerable to a pullback if the broader market shows any weakness.

Implied volatility for PEP options is currently around 22%, which is slightly elevated, suggesting the market is pricing in some movement. This makes selling premium an interesting, though risky, strategy for those who believe the stock will remain range-bound between support at $180 and resistance at $192. An iron condor is a strategy that could take advantage of this sideways action.

Regardless of the direction, the setup requires careful attention to key levels. How the stock behaves around the $180 support on any weakness will tell us if sellers are taking control. As always, these derivative strategies should be paired with clearly defined risk management.

GBP/USD slips 0.17% as strong US jobs data outweighs UK GDP, despite upbeat risk sentiment

GBP/USD fell by 0.17% on Thursday after US jobs data outweighed UK GDP figures released during the European session. The pair traded at 1.3534 after earlier rising to just below 1.36, while expectations of a US–Iran peace deal supported risk appetite.

In European trading on Thursday, GBP/USD was about 0.1% lower near 1.3545 and struggled to break above 1.3600, which aligns with the 61.8% Fibonacci retracement level. The US Dollar firmed after recovering early losses, even as market sentiment stayed risk-on.

Market Reaction And Key Levels

On Wednesday, GBP/USD stalled and held around 1.3570 as optimism over renewed US–Iran talks cooled. US equities extended gains, and the US Dollar appeared to stabilise after touching a six-week low.

We remember how the pound struggled to break the 1.3600 barrier back in 2025, where a strong US jobs report was enough to halt any rally despite a positive mood. That dynamic of a resilient dollar overpowering other factors has become a more dominant theme since then. The market is now trading significantly lower, showing that the resistance we saw last year was a critical turning point.

The present situation in April 2026 echoes that period, as the most recent US Non-Farm Payrolls report for March added a solid 255,000 jobs, comfortably beating expectations. This strong labor market data has cemented expectations that the Federal Reserve will not be cutting interest rates any time soon. As a result, the dollar continues to attract capital, putting a ceiling on any potential GBP/USD gains.

Meanwhile, the UK’s own economic picture is less clear, with March 2026 inflation data showing consumer prices remain sticky at 3.1%, keeping pressure on the Bank of England. However, this is offset by sluggish Q1 growth forecasts, creating a conflict for policymakers and uncertainty for the pound. This divergence in economic momentum between a robust US and a hesitating UK continues to favor the dollar.

Derivative Trading Approach

For the coming weeks, derivative traders should consider strategies that position for limited upside in GBP/USD. Buying put options with a strike price below the current 1.2800 support could offer protection against another leg down driven by US data. Selling out-of-the-money call options above the 1.2950 resistance level may also be a viable strategy to collect premium from the expected range-bound movement.

Create your live VT Markets account and start trading now.

The DJIA rose 90 points, topping 48,500, as ceasefire optimism boosted Wall Street’s weekly rally

The Dow Jones Industrial Average rose about 90 points, or 0.20%, to above 48,500 on Thursday. The S&P 500 gained 0.30% to above 7,000, and the Nasdaq Composite added 0.40% to a new high.

The Dow moved between about 48,275 and the close. For the week, the S&P 500 is up more than 3%, the Nasdaq is up more than 5%, and the Dow is up more than 1%.

Ceasefire Headlines Lift Markets

Donald Trump said he spoke with Lebanese President Joseph Aoun and Israeli Prime Minister Benjamin Netanyahu, and announced a 10-day ceasefire starting at 21:00 GMT. Iran’s parliament speaker linked a pause in Israeli operations in Lebanon to formal US-Iran talks, with a second round of talks reportedly under discussion.

Initial jobless claims fell by 11K to 207K in the week ended April 11, and the prior week was revised down by 1K to 218K. Continuing claims rose by 31K to 1.818 million in the week ended April 4.

Abbott fell about 4% after cutting guidance linked to a $23 billion acquisition, and Charles Schwab dropped nearly 4% despite record Q1 profit. PepsiCo rose 0.3% and Bank of New York Mellon gained 1.3%.

TSMC posted Q1 net profit of T$572.5 billion, up 58% year on year, with revenue up 35%. It guided 2026 capex towards the upper end of its $52 billion to $56 billion range.

After hours, DJIA futures traded near 48,760, while S&P 500 and Nasdaq 100 futures were up about 0.1%. Netflix reports after the bell, with Friday’s focus also on Middle East updates.

Options Hedging And Rotation

Given the market’s rally on fragile ceasefire hopes, we should consider buying protection against a sudden reversal. The Volatility Index (VIX) has fallen below 14 on this news, making put options on the SPX or QQQ relatively cheap insurance in case the deal falls apart. We saw last year in 2025 how similar geopolitical scares sent the VIX spiking above 20 overnight, and any sign of trouble from Israeli officials could trigger a repeat performance.

The strong labor market, with initial jobless claims at a low 207,000, reinforces the idea that the Federal Reserve will not be cutting rates soon. This resilience means the economy can withstand current rates, but it also puts a cap on how high the overall market can go. Therefore, we should be cautious with long-dated call options on broad market indices like the SPY and instead focus on sector-specific opportunities.

We are seeing a clear split between the lagging Dow and the high-flying Nasdaq, which is up over 5% this week compared to the Dow’s 1% gain. This divergence suggests a pairs trade, such as buying calls on the QQQ ETF while buying puts on the DIA ETF, to play the ongoing rotation into tech and away from some traditional industrial and financial names. The weak guidance from companies like Abbott Labs and Charles Schwab validates this defensive posture on older-economy stocks.

The AI trade received a massive boost from TSMC’s blowout earnings and strong capital expenditure guidance for 2026. This confirms the infrastructure spending cycle is not slowing down, making bullish bets on semiconductor ETFs like the SMH a priority for the coming weeks. With megacap tech continuing to lead, buying call spreads on names like NVIDIA or Microsoft ahead of their earnings looks like a solid strategy to capture further upside.

Create your live VT Markets account and start trading now.

GBP/USD falls 0.17% as robust US employment figures eclipse UK GDP, despite upbeat peace-deal optimism

GBP/USD fell 0.17% on Thursday after US jobs data beat the UK GDP release. It traded near 1.3534 after hitting a two-month high of 1.3594 earlier in the session.

US Initial Jobless Claims dropped to 207K from 218K for the week ending April 11, below the 215K forecast. US Industrial Production fell from 0.7% to -0.5% month-on-month in March, with motor vehicles, parts, and utilities posting the largest declines.

Fed Policy And Inflation Risks

Federal Reserve messaging indicated no change in stance, while officials referred to inflation risks linked to Middle East tensions. Stephen Miran said he expects three rate cuts rather than four due to less favourable inflation developments.

UK GDP rose by 0.5% month-on-month in February, above the 0.1% estimate. Sterling had fallen 1.9% in March amid Middle East conflict and the closure of the Strait of Hormuz, then rebounded as peace-deal hopes lifted the pair back above 1.3500.

Reports also pointed to rising expectations of two Bank of England rate hikes in 2026. Donald Trump said Israel and Lebanon agreed to a 10-day ceasefire starting Thursday at 5:00 PM EDT, alongside talks linked to reopening the Strait of Hormuz.

Technically, GBP/USD remained above 50-, 100- and 200-day simple moving averages near 1.3427, with support around 1.3490–1.3492. A break below 1.3427 would weaken the near-term setup.

Trading View And Risk Factors

The current strength in the GBP/USD is built on fragile optimism, so we should be cautious. While the price has rallied on hopes for a Middle East peace deal and expectations for Bank of England rate hikes, the fundamental vulnerability of the UK as a net energy importer remains. This suggests the recent move above 1.3500 could reverse quickly if sentiment sours.

We should consider the divergence in central bank policy as a key driver for the coming weeks. Looking back, we saw UK inflation remain stubbornly high through much of 2025, which is why the market is now pricing in a 70% chance of two BoE rate hikes in 2026. In contrast, the US Federal Reserve is still talking about rate cuts, creating a policy path that favors Sterling strength and makes long positions in GBP/USD futures or buying call options attractive.

However, the US economy is sending mixed signals that warrant attention. While the strong initial jobless claims data, which fell to 207,000, points to a robust labor market, the sharp 0.5% contraction in industrial production shows significant weakness in manufacturing. This uncertainty creates an environment for heightened volatility, making a long straddle strategy, which profits from a large move in either direction, a prudent approach.

Geopolitical risks are the most immediate threat to the pound’s rally. We remember how the initial closure of the Strait of Hormuz in March 2025 caused Sterling to drop 1.9% in a month due to soaring energy prices. A breakdown in the current ceasefire talks or peace negotiations with Iran would likely trigger a similar sell-off, making out-of-the-money put options a cost-effective hedge against our long positions.

The technical picture provides clear levels to watch for any change in momentum. The support trend line around 1.3490 is the first critical test for the current uptrend. A decisive break below the cluster of moving averages near 1.3427 would signal that the upward momentum has failed and should be seen as a trigger to exit long positions.

Create your live VT Markets account and start trading now.

Back To Top
server

Hello there 👋

How can I help you?

Chat with our team instantly

Live Chat

Start a live conversation through...

  • Telegram
    hold On hold
  • Coming Soon...

Hello there 👋

How can I help you?

telegram

Scan the QR code with your smartphone to start a chat with us, or click here.

Don’t have the Telegram App or Desktop installed? Use Web Telegram instead.

QR code