EUR/USD option expiries at 1.1650 and 1.1700 may impact dollar price movement this week
The EU plans to impose €21 billion in tariffs on the US if negotiations break down.
Tariffs on the EU and Mexico overshadow trade discussions as US economic data captures attention
US Economic Data
Attention is now on key US economic reports. The Consumer Price Index (CPI) report will be released tomorrow. The chance of a Federal Reserve (Fed) rate cut this month seems low, but the September meeting is significant, with a 67% likelihood of a 25 basis points rate cut, according to Fed funds futures. Inflation data will be important in shaping expectations after recent dovish Fed statements. Later in the week, we can expect the Producer Price Index on Wednesday, along with retail sales and weekly jobless claims on Thursday. These reports will have a major impact on financial markets and economic forecasts. The US is clearly taking a firmer stance on tariffs, extending them to the EU and Mexico. This 30% tariff, effective August 1, increases trade pressure from Washington. Brussels is trying to avoid deteriorating trade relations by delaying any retaliatory actions for now. Mexico, while dissatisfied, is still willing to engage in discussions, keeping communication open despite its displeasure. This situation indicates that while the risk of a retaliatory trade spiral has decreased, it has not disappeared completely. Trade tensions can influence global pricing, inflation expectations, growth, and supply chains. As we approach mid-August, any prolonged stalemate or breakthrough—even slight changes in tariff language—could impact equity and fixed income volatility, especially in the short term.Market Alignment
Markets are closely tracking US economic indicators, especially the upcoming inflation data. This week, Fed funds futures suggest a low chance of action at the next meeting but a higher likelihood of a rate cut in September. Therefore, tomorrow’s CPI report is crucial. The Fed has leaned toward more accommodating policies recently, but any unexpected rise in CPI could complicate that approach. We should focus not only on the headline number but also on core figures, which are less volatile and provide insight into underlying inflation. Surprises here could change expectations for the September meeting and affect money market curves that influence short-term interest rates. It’s also important to watch how shelter inflation behaves, as its inconsistencies may change. Later in the week, we’ll see producer price data—often less impactful but useful for tracking margin pressures in earlier stages of production. Then on Thursday, we have retail sales and jobless claims reports. The latter serves as a current indicator of labor market health, affecting household spending. Low jobless claims combined with strong retail sales could challenge current assumptions about economic stability and policy easing. Conversely, weak data could support a dovish Fed stance without additional commentary. Looking ahead, determining the direction of inflation and the stability of the labor market are our main priorities. Volatility may return—not necessarily from the events themselves but from their implications for short-term interest rates and market consensus for the rest of Q3. We will adjust our implied volatility curves accordingly, monitor calendar spreads around September, and be aware of potential risks around data releases with significant impacts. We aim to remain flexible. The broader risk appetite relies on clear information, which is currently limited. We should reevaluate spreads, durations, and strike positions due to the event-driven, time-sensitive nature of upcoming catalysts. In short, stay alert during the CPI release. Create your live VT Markets account and start trading now.Sources indicate that the Bank of Japan may raise its inflation outlook in the upcoming meeting.
Asia-Pacific markets mixed after Trump announces new tariffs, Bitcoin hits record highs
Asia Pacific Equity Markets
Asia-Pacific equity markets had mixed results. Australia’s S&P/ASX 200 remained flat, Hong Kong’s Hang Seng fell by 0.1%, Japan’s Nikkei 225 declined by 0.25%, and the Shanghai Composite rose by 0.4%. U.S. equity index futures were lower throughout the session, raising investor concerns. Bitcoin reached a new all-time high, exceeding $120,000. French President Macron called for increased defense spending due to perceived threats in Europe. At the same time, there are reports that Trump is preparing a new, more assertive weapons plan for Ukraine, which could change current defense policies. What we see now is a direct market reaction to political signals and unexpected economic changes, especially from Washington. Trump’s newly announced tariffs are not just mere talk; they have caused real shifts in currencies and futures markets. By imposing a broad import levy on EU and Mexican goods, pressure is building on both industrial supply chains and expectations for capital flows in the medium term.Currency And Trade Dynamics
With the Dollar Index hitting its highest point in three weeks, many investors are leaning towards safety or yield. Bonds have not attracted the same safety appeal, suggesting that institutions prefer holding dollars rather than retreating into fixed income. This shift is subtle but noteworthy. The strength of the yen seems to hide more significant risk appetite issues. While Japan’s machinery orders were better than expected, this doesn’t ensure continued economic momentum in the third quarter. China’s trade balance remains strongly positive, even with the impact of extensive U.S. tariffs. This suggests that exporters are either pre-loading orders or adjusting invoices to continue attracting foreign demand. The surplus, over $115 billion, implies a complicated adjustment going forward, especially if the U.S. tightens trade policies further. From our view, this creates more opportunities for currency divergence in the region. Equity markets did not converge around a single narrative: the Shanghai Composite’s strength did not extend to nearby indexes. Australia’s market remained mostly still, indicating that investors were uncertain and waiting to see how commodities would react to trade news. Hong Kong saw a small dip, a reminder of how cautious investors are about tech-sensitive or China-exposed assets. Japan dipped slightly as well, following trends in other developed markets. Each percentage change in these indices, seen against the backdrop of policy shifts and uncertain fiscal situations, offers insights rather than definitive conclusions. Futures on U.S. stock indices are lower, indicating general unease about not only tariffs but also unpredictable signals from the White House. This cautious sentiment suggests the market has already anticipated not just tariffs but some geopolitical pushback as well. However, the stability in volatility shows that positioning remains careful rather than reactive. In the realm of cryptocurrency, Bitcoin’s rise above $120,000 points to capital moving into alternative investments. This may serve two purposes: a hedge against policy instability and a preference for politically neutral stores of value. While record highs typically see pullbacks, the extent of movement this week indicates a more fundamental repricing of digital assets compared to fiat currencies. Macron’s push for increased defense spending comes as traditional diplomacy weakens. Redirecting national budgets towards military readiness will, over time, change financial exposures in both equity and fixed income sectors. His remarks align with reports from Washington about a shift in military support for Ukraine. If true, this signals a return to a doctrine favoring rapid, unrestricted arms deployment, which is more aggressive than recent strategies. Overall, the interconnected aspects of currencies, equities, and commodities highlight a market environment that requires clear execution. The upcoming days call for balance: acknowledging that while some asset classes are embracing risk, others remain cautiously waiting. Create your live VT Markets account and start trading now.China’s exports increased by 5.8% in June, with a trade balance of US$114.77 billion.
The NZD/USD pair faces selling pressure, falling below 0.6000 in Asia for a second consecutive day.
Nzdusd Support And Resistance Levels
The NZD/USD is now around the 0.5980-0.5975 support level. If it drops below the 61.8% Fibonacci retracement, it could fall further to 0.5935 and possibly reach 0.5900. Resistance might appear at 0.6025. If the pair breaks past 0.6025, it could rise to 0.6060 and even attempt to reclaim 0.6100. Any further movement may test 0.6120, shifting the outlook to favor buyers. The US Dollar has shown strength against various currencies this past week, especially the Yen. A visual heat map highlights percentage changes and reveals currency movements based on specific base and quote pairs. Building on the earlier analysis, the recent strength of the US Dollar is tied to changing interest rate expectations in the United States. With decreased expectations for rate cuts and heightened trade tensions following Trump’s tariff announcement, riskier currencies like the New Zealand Dollar have been affected. This isn’t just a reaction to headlines; it reflects a broader market adjustment as traders rethink future yields. Traders who focus on price momentum and short-term interest rates might want to reevaluate their positions around the current levels of 0.5980-0.5975. This area has shown strong interim support, but recent price actions are raising doubts about its stability. If sellers maintain pressure and break below this level along with the 61.8% Fibonacci retracement, it would likely lead to a decline toward 0.5935, with 0.5900 following closely. These numbers reflect the market’s reaction to moving below key technical points that previously served as balance zones.The Broader Us Dollar Strength
Resistance is clearly visible around 0.6025. This level is not just a number; it corresponds to recent highs where sellers have consistently reentered. If buyers can push through this barrier, a quick jump to 0.6060 is possible, with more interest likely near 0.6100 and 0.6120. However, as long as the pair stays below 0.6025, the trend remains downward. The heat map indicates that the US Dollar’s strength is widespread. Its strong performance against the Yen has been notable, but this resilience extends to other pairings. The Dollar’s firmness across various currencies suggests a reevaluation of interest expectations rather than being driven by specific country changes. In addition, we’ve noticed reduced volatility among some commodity-linked currencies. External risks, like tariffs on EU and Mexican goods, could continue to affect market sentiment, making risk-sensitive currencies struggle. Traders involved in derivatives should be cautious and manage their exposure carefully, especially around identified breakout levels. In the upcoming sessions, market participants should pay attention to any changes in tone from Federal Reserve officials. Even subtle comments can influence market pricing, especially when traders are more sensitive to a lack of dovishness than any hawkish moves. Moreover, reactions to economic data will be particularly significant, as every figure will be assessed in terms of ‘how long until easing?’ With the technical situation, hawkish re-evaluations, and negative risk sentiment aligning, conditions favor positions that align with current Dollar strength until we see a break in momentum. Not all support levels will hold when the fundamentals are supporting one side. Create your live VT Markets account and start trading now.China’s yuan exports to the US fell by 9.9%, while imports decreased by 7.7% year-on-year.
Gold prices increased today in Saudi Arabia, according to data sources.
Week Ahead: Washington’s Crypto Gamble

Ethereum kicked off the week on the front foot, having soared past the $3,000 mark thanks to a surge in ETF inflows. But ahead lies a delicate balancing act, with inflation data and political developments in Washington poised to shape the near-term outlook.
At the heart of this rally is BlackRock’s iShares Ethereum Trust (ETHA), which recorded an all-time high of $300 million in inflows last Thursday, its most substantial single-day haul to date. This boosted ETHA’s assets under management to $5.6 billion, cementing its status as the leading spot Ethereum ETF in the United States. Across all Ethereum-linked ETFs, roughly $703 million was channelled in last week, their third-largest weekly intake since inception.
Momentum has been gathering for some time. The 30-day average trading volume for ETHA has climbed to 18.83 million shares, up from about 13 million in early June. Trading hit a fever pitch last Wednesday, with 43 million ETHA shares changing hands, the highest daily volume since launch. And this isn’t just short-term capital on the move. Since early June, ETHA has seen net inflows exceeding $1.2 billion, including $159 million on Tuesday alone, its biggest single-day tally since 11 June.
Options Market Echoes The Optimism
The options market is singing the same tune. Bullish positioning dominates, with call options heavily outweighing puts across several expiries. ETHA’s open interest has reached a one-year high, reflecting widespread expectations of continued gains. For options expiring 18 July, traders are clustering around the $22 strike (roughly $3,000 ETH), with noticeable interest building at $23 and $24, a signal that traders aren’t just expecting Ethereum to hold ground, but to push toward $3,200.
This optimism extends into later expiries. For 25 July, call options at $23 and $24 remain dominant, while lighter interest at $25 and $26 implies some traders are eyeing a move as high as $3,300. The same trend can be seen in the 1 and 8 August expiries, where calls outweigh puts right up to $26. With little downside protection evident, traders expect ETH to remain above $3,000, with room to climb further if momentum holds.
‘Crypto Week’ In Washington Poses Pivotal Test
Ethereum’s bullish run doesn’t exist in isolation. It comes during a crucial week in Washington, as US lawmakers embark on what’s been dubbed ‘Crypto Week’. The House is reviewing three landmark bills that could dramatically reshape the nation’s crypto regulatory framework.
Top of the list is the Digital Asset Market Clarity Act, which seeks to distinguish between securities and commodities. The bill would give the CFTC oversight of crypto markets and provide regulatory exemptions for mature decentralised networks, a long-standing request from the industry.
More immediately impactful is the GENIUS Act, designed to create a proper framework for stablecoins. The legislation, which already enjoys bipartisan backing and Senate approval, mandates full 1:1 reserve backing, licensing, and regular disclosures. It also brings stablecoin issuers under the Bank Secrecy Act. President Trump has signalled support, which could speed up passage. Stablecoins underpin crypto liquidity, and regulatory clarity here could pave the way for larger institutional flows into Ethereum and similar assets.
Meanwhile, the Anti-CBDC Surveillance State Act aims to prevent the Federal Reserve from launching a central bank digital currency without explicit Congressional consent. Although politically charged, the bill aligns with pro-crypto sentiment, advocating for open networks over centralised control.
Even if not all three bills pass this week, their progress is already influencing sentiment. The very act of bringing them to the table signals a step closer to regulatory clarity, and markets are responding.
Strong Momentum, But Not Without Risks
That said, caution is warranted. Analysts at Citi have reiterated that digital assets remain far from earning their place as conventional safe-haven investments like gold. Ethereum’s pace of ascent, though underpinned by strong inflows, could trigger a bout of profit-taking or exhaustion, especially among leveraged long holders or deep-in-the-money options traders.
At present, Ethereum’s upward move appears to be backed by real capital and shifting regulation. Retail and institutional players are responding accordingly. Provided ETF flows remain steady and legislative momentum continues, the recovery remains on solid footing. But as always in crypto, volatility is never far behind.
Market Movements Of The Week
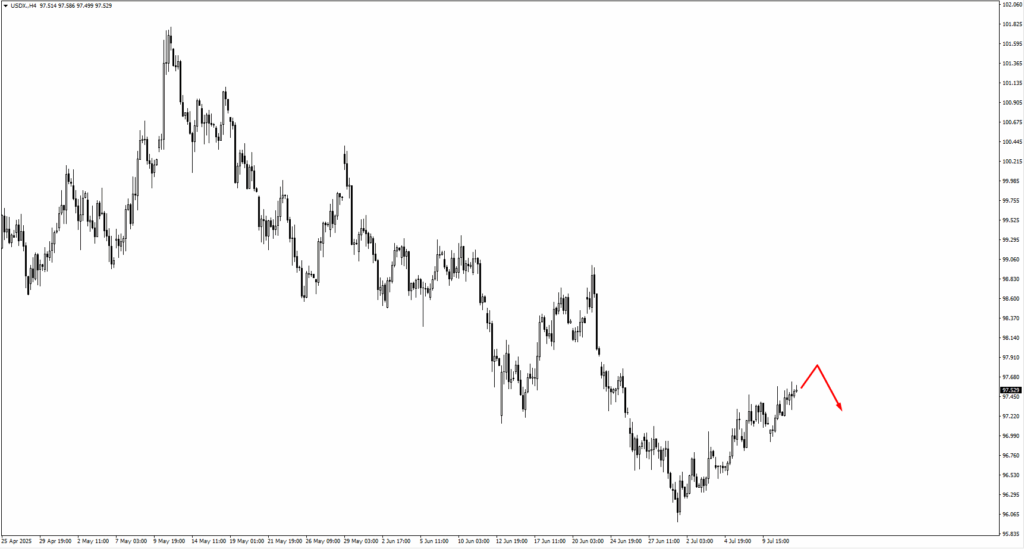
The US dollar index (USDX) is slowly grinding higher, but it’s approaching a key test. Price action near the 97.70 zone may act as a turning point. If USD strength pushes beyond that level, bears are eyeing the next resistance around 98.10. A breakout here could reshape short-term expectations for FX pairs, especially if Tuesday’s US CPI surprises to the upside.
EURUSD is drifting lower, with traders now watching for signs of bullish reversal at 1.1660 or 1.1605. These levels represent key structure zones, and a CPI beat could keep the euro on the defensive. However, any softness in inflation could ignite a retracement rally, particularly if European sentiment stabilises.
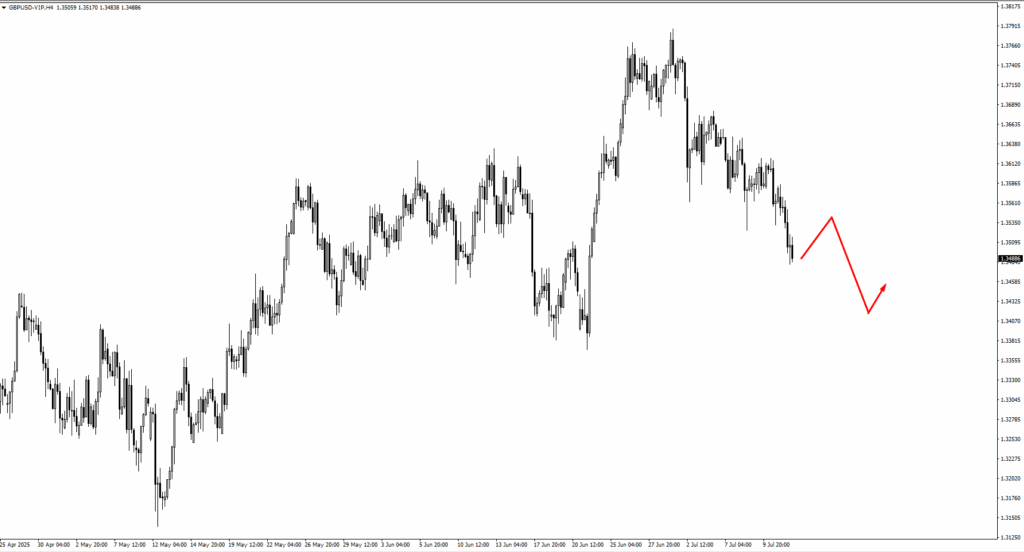
GBPUSD has entered a slower consolidation phase. With UK CPI due Wednesday, bulls are looking for a bounce near 1.3415. That zone could offer a tactical long setup if inflation surprises are mild. But if broader USD strength continues, any upside may remain capped under 1.3535–1.3570 resistance.
USDJPY has already rejected from the 147.75 zone and is now consolidating. If the pair breaks higher on fresh inflation momentum, 148.05 becomes the next upside magnet. However, traders should be cautious, since any rejection near these levels could signal a short-term top.
USDCHF continues to inch upward, heading toward 0.8050. With little data from Switzerland this week, USD direction will likely dictate where this pair goes next. Traders should watch closely how the price behaves once it reaches that resistance.
In the commodity currencies, AUDUSD is holding above its consolidation zone. If price remains stable around 0.6550, bulls may step in ahead of Thursday’s Australian jobs report. A move higher would put 0.6665 back on the radar. Similarly, NZDUSD has traded down from the 0.6050 level and may print a new swing low before finding support. Watch for base-building before considering long positions.
USDCAD is testing the 1.3715 resistance area. If price breaks through with conviction, especially post-CPI, it could quickly move to test the 1.37587 high. The tug-of-war between Canadian inflation and US macro signals will be central here.
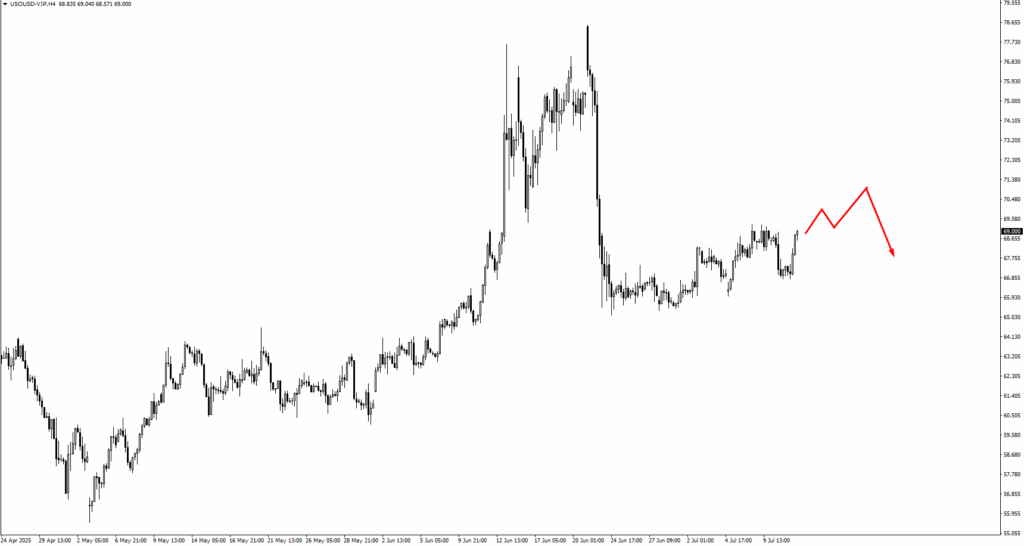
Commodities remain on a knife’s edge. USOIL has rallied slightly but faces resistance at 71.80 and 73.40. These zones are likely to draw selling interest unless supply-side headlines extend the bounce. On the downside, 63.35 and 61.00 remain key supports to watch for reversal setups.
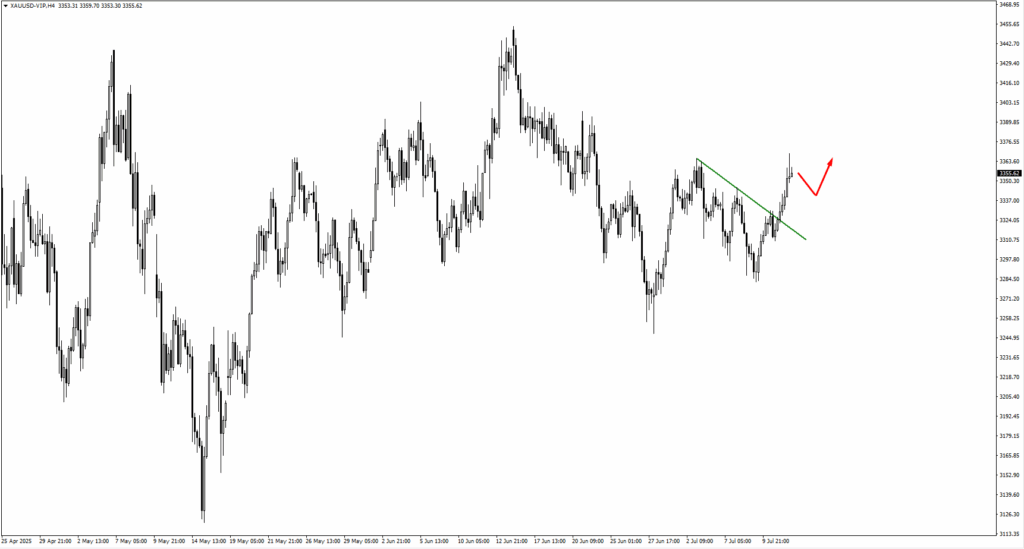
Gold has finally broken above its trendline, suggesting bullish momentum is beginning to return. If prices consolidate cleanly above the breakout zone, bulls will likely aim for 3340 next. However, any renewed dollar strength could limit upside, especially as traders reassess inflation and rate cut timelines in the US.
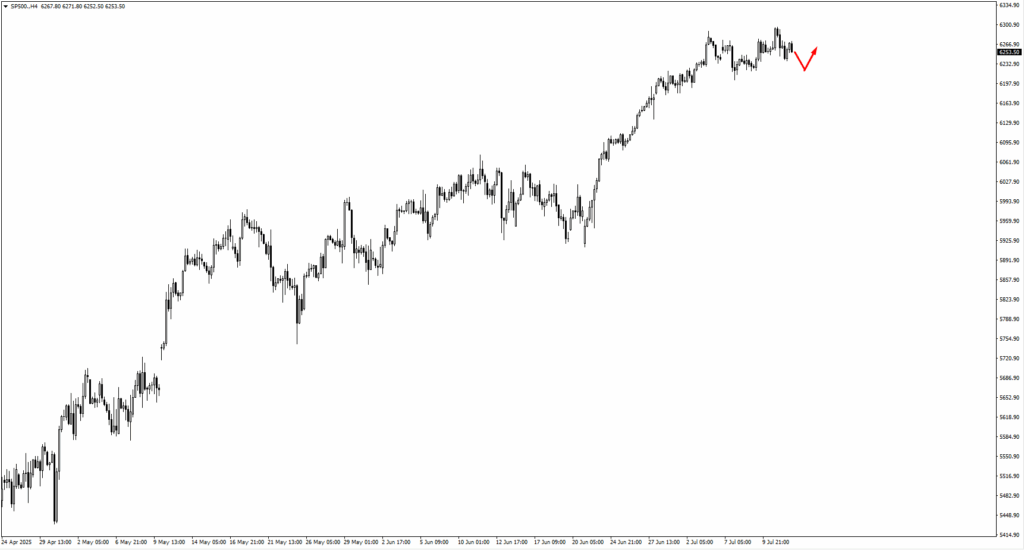
The SP500 is walking a tightrope. Trump’s renewed tariff threats against Mexico and Europe are clouding what was a strong trend higher. Price has support around 6230, with deeper downside capped at 6170. If bulls recover control, 6400 and 6630 are the next upside levels to monitor.
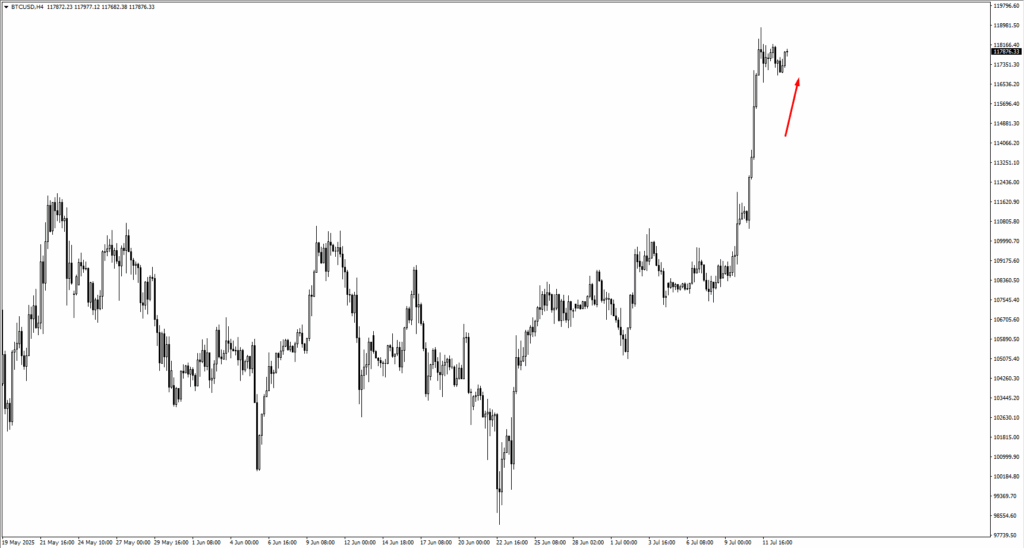
Bitcoin is back on the rise after a shallow consolidation. Price is approaching the 122,100 to 124,720 zone, a key area where profit-taking could occur. Still, momentum remains constructive, and the broader crypto environment continues to benefit from ETF flows and the regulatory optimism spilling over from Ethereum.
Natural Gas (NG) is still dancing around the 3.35 zone. If it pushes higher, 3.40 is the next resistance level to watch. Volatility remains high here as seasonal shifts and supply dynamics continue to affect trader sentiment.
This week’s price action is less about chasing breakouts and more about timing entries at known technical zones. Many major pairs are sitting near decision points. Patience and precision will be key as traders wait for the next macro catalyst to tip the scales.
Key Events of the Week
After a relatively quiet start to the month, this week swings the spotlight back onto macro data. Traders won’t have to guess where market sentiment might shift next with the calendar loaded with reports that could redefine interest rate expectations across major currencies.
All eyes are first on Tuesday, 15 July, where both Canada and the United States drop their latest inflation readings. For Canada, the CPI y/y is forecast at 3.60%, down from the previous 3.85%. A softer print could reignite dovish bets for the Bank of Canada, particularly if USD strength persists. However, the crosscurrents from ongoing US tariff issues may muddy CAD’s reaction, especially if broader risk appetite begins to falter.
The US print could steal the show. Headline CPI y/y is forecast to rise to 2.60%, up from 2.40%. This is not the direction markets nor the Trump administration want to see. A hotter inflation number here could stall any discussion of near-term rate cuts from the Fed. The result? A stronger dollar and potentially sharp downside in risk-sensitive FX pairs like AUDUSD and NZDUSD. Even equities may pause if markets begin re-pricing the Fed’s glidepath.
On Wednesday, 16 July, the UK delivers its CPI data, forecast flat at 3.40% y/y. With no change expected, the report may take a back seat unless there’s a surprise. But traders should still watch price action around this release, as GBPUSD sits near key resistance and could break either way on deviation.
Thursday, 17 July, kicks off with Australia’s Employment Change report, where the forecast stands at +21.0K, a rebound from last month’s -2.5K. If AUDUSD is truly building a base as recent price action suggests, this report could provide the fuel for a breakout toward 0.6665. Strong numbers here would also help anchor RBA rate expectations and calm recent concerns about domestic demand.
Later that day, the US Retail Sales m/m lands, with a forecast of 0.20%, following last month’s -0.90%. A bounce here would paint a picture of improving consumer strength, giving the Fed even more reason to delay any easing cycle. Traders should watch how the USD behaves into this print. If the number beats expectations, we could see US yields firm up again, putting pressure on gold, AUD, and equities.


