Gold fell to near $5,085 in early Asian trading on Friday. The move came as the US Dollar strengthened ahead of the US February employment report due later on Friday.
Oil and gas prices rose amid Middle East conflict, raising inflation concerns. Traders reduced expectations of further Federal Reserve easing, which supported the Dollar and pressured dollar-priced gold.
Dollar Strength And Liquidity Shift
Market moves were also linked to the stronger Dollar and a shift towards liquidity. At the same time, Middle East tensions remained elevated after Iran launched missile and drone strikes across the Gulf on Thursday, with attacks reported in the United Arab Emirates, Bahrain, Qatar, and Kuwait.
Iran’s Foreign Minister Abbas Araghchi said Tehran had not asked for a ceasefire and did not plan to negotiate. Iran’s Islamic Revolutionary Guard Corps said retaliatory attacks would intensify in the coming days.
Gold is commonly used as a store of value and is often sought during market turbulence, inflation risks, or currency weakness. Central banks are the largest holders, adding 1,136 tonnes worth about $70 billion in 2022, the highest annual total on record.
We are seeing gold dip to near $5,085, mainly because a strong US Dollar is putting pressure on it. The market is caught between this dollar strength and rising tensions in the Middle East. For traders, this conflict between opposing forces signals that significant price swings are likely in the coming weeks.
Given this uncertainty, focusing on volatility is the most logical play. Options strategies like straddles or strangles, which profit from a large price move in either direction, should be considered. This allows us to benefit from the expected turbulence without betting on a specific outcome.
Fed Policy And Inflation Backdrop
The stronger dollar is a direct result of stubborn inflation, which prevents the Fed from easing policy. After we saw inflation metrics prove sticky through 2025, the latest CPI print for January 2026 came in at 4.5%, well above the Fed’s target. This data point solidifies the case for a stronger-for-longer dollar, capping gold’s upside for now.
On the other hand, the geopolitical risk premium is rising and cannot be ignored. The situation with Iran mirrors the uncertainty we saw during the Red Sea shipping disruptions in late 2023 and early 2024, which caused sharp, albeit temporary, spikes in safe-haven assets. A serious escalation could easily overwhelm the strong dollar narrative and send gold soaring.
This tension is reflected in broader market fear gauges, with the CBOE Volatility Index (VIX) now elevated at 22. We also know that central bank demand remains a supportive long-term factor, as the aggressive buying trend we tracked in 2022 and 2023 has continued through 2025. This provides a fundamental floor that could limit the depth of any sell-off.
For those trading futures contracts, this environment demands careful position sizing and diligent risk management. The high probability of sharp reversals means traders should be prepared for increased margin requirements. Using options to hedge futures positions could be a prudent way to define risk in the coming weeks.
Create your live VT Markets account and start trading now.
Start trading now – Click here to create your real VT Markets account
South Korea’s consumer price index rose 2.0% year on year in February. This was below the forecast of 2.1%.
The February reading shows inflation slowed compared with expectations. The difference between the actual figure and the forecast was 0.1 percentage points.
Dovish Shift And Policy Implications
With February’s inflation coming in at 2.0%, below the 2.1% forecast, pressure on the Bank of Korea to maintain its restrictive stance has eased significantly. This surprise dip pushes the narrative firmly towards a dovish pivot, increasing the probability of a rate cut later this year. We must now adjust our positions to reflect a lower interest rate environment for longer.
For equity derivatives, this is a clear bullish signal for the KOSPI 200. We should consider increasing long positions through index futures or buying call options, as lower borrowing costs typically boost corporate earnings and equity valuations. Given the index has been consolidating around the 2,850 level, this data could provide the catalyst for a breakout.
This development will likely weigh on the Korean Won, as lower potential interest rates make the currency less attractive for yield-seeking investors. We should anticipate the USD/KRW exchange rate, currently near 1,360, to test higher levels. Positioning for this can be done by buying USD/KRW futures or call options.
In the rates market, this data reinforces the case for lower bond yields. We should look at buying Korean Treasury Bond (KTB) futures, as their prices will rise if yields fall as expected. Looking back from our 2025 perspective, the aggressive rate hiking cycle we saw post-pandemic appears to be definitively over.
Cross Market Positioning Considerations
Considering the Bank of Korea has held its policy rate steady at 3.50% for over a year, this consistent undershooting of inflation targets gives it the justification to act. Global context matters, as the U.S. Federal Reserve is also expected to begin its easing cycle in the second half of the year. This alignment strengthens the case for a dovish BOK, suggesting these trends may persist in the coming months.
Create your live VT Markets account and start trading now.
Start trading now – Click here to create your real VT Markets account
South Korea recorded a current account surplus of 13.26B in January.
This compares with a surplus of 18.7B in the previous period.
The January current account surplus came in much lower at 13.26 billion compared to the strong 18.7 billion figure we saw in December 2025. This significant drop suggests that the flow of foreign currency into South Korea is slowing down. This is a bearish signal for the Korean Won (KRW).
This weaker surplus aligns with recent data showing a slowdown in key export sectors. For instance, preliminary trade figures for February 2026 indicated semiconductor exports fell 4.5% year-over-year, their first decline in over a year. This confirms the cooling trend and suggests the January number was not an anomaly.
Given this, we should consider strategies that benefit from a weaker Won in the coming weeks. Buying USD/KRW call options or selling KRW futures could be effective ways to position for further currency depreciation. The market is already reflecting this, with the USD/KRW exchange rate moving from around 1,310 to 1,345 over the past month.
Slowing exports will also likely weigh on the KOSPI 200 index, which is heavy with major exporters. We could look at buying put options on KOSPI 200 futures or on ETFs tracking the index. This would provide a hedge against a potential equity market downturn driven by weakening global demand.
We remember a similar export slump back in mid-2025, which preceded a nearly 10% correction in the KOSPI over the following two months. During that period, implied volatility rose sharply, making option-based hedges more expensive later on. It is better to position for that increase in volatility now.
The Bank of Korea is also in a difficult position, adding to the uncertainty. With inflation still persistent at 2.9% as of February, they have limited ability to cut interest rates to support the economy. This policy deadlock could put further pressure on both the currency and equities.
Start trading now – Click here to create your real VT Markets account
South Korea’s consumer price index rose by 0.3% month on month in February.
This was below the expected 0.4% increase.
Implications For Monetary Policy
The February inflation figure coming in below forecasts at 0.3% is a significant signal for us. This data eases pressure on the Bank of Korea, which has been holding its policy rate firm at 3.50% for well over a year. A softer inflation print increases the probability of an earlier-than-expected interest rate cut in the second half of the year.
We should remember the persistent inflation that lingered around 3% for much of 2025, which kept the central bank on edge. This new, lower reading suggests that the disinflationary trend is gaining traction, a sharp contrast to the price pressures we faced previously. The central bank’s focus may now shift more towards supporting economic growth, especially with recent reports showing a slight slowdown in semiconductor exports in the last quarter.
Given this outlook, we should anticipate a weaker Korean Won against the U.S. dollar. The potential for lower interest rates makes the Won less attractive to hold. Traders should consider buying call options on the USD/KRW pair, targeting a move from its current level of around 1,335 towards the 1,360-1,370 range seen in late 2025.
This environment is bullish for government bonds, as expectations of rate cuts will push yields down and prices up. We should look at increasing long positions in Korea Treasury Bond (KTB) futures. The yield on the 3-year KTB has already dipped below 3.30% on this news, and we could see it test the 3.15% level in the coming weeks.
Equity Market Positioning
For equity markets, a more dovish central bank is a positive catalyst. Lower borrowing costs benefit companies, making equities more attractive. We can express this view by buying KOSPI 200 index call options or selling out-of-the-money put options to collect premium on the expectation of limited downside from here.
Create your live VT Markets account and start trading now.
Start trading now – Click here to create your real VT Markets account
GBP/USD fell 0.2% on Thursday to near 1.3350, staying close to three-month lows. It briefly rose on reports of Iran signalling openness to talks with the CIA, but the move faded after Israeli officials reportedly urged Washington to ignore it.
The pair has traded in a tight range around key daily moving averages. Recent small-bodied daily candles follow a drop from the late-January high near 1.3870.
Uk Outlook And Central Bank Signals
In the UK, the Office for Budget Responsibility cut its 2026 growth forecast to 1.1% from 1.4%. It also raised the expected peak unemployment rate to 5.3% from 4.9% later this year.
The Bank of England kept rates at 3.75% in February by a 5-4 vote. Markets now price a 20% chance of a cut at the March 19 meeting, down from about 75% a week ago, and expect one 25 basis point cut for the year.
In the US, attention turns to Friday’s Non-farm Payrolls, with consensus at about 60K for February after 130K in January. On the chart, price is at 1.3351, with resistance at 1.3400–1.3500 and support near 1.3360, then 1.3300 and 1.32.
Looking back to early March 2025, we saw the market grappling with high oil prices and a divided Bank of England. The geopolitical tensions at the time crushed expectations for rate cuts, and the Office for Budget Responsibility issued a notably downbeat forecast for UK growth. That period set the stage for a challenging year for Sterling as the economy struggled under the weight of restrictive policy.
Today, the situation has evolved as those pressures have eased, with inflation now showing clear signs of cooling. The latest data from the Office for National Statistics showed the UK Consumer Price Index (CPI) fell to 2.2% in January 2026, a sharp drop from the highs seen a year ago and much closer to the Bank’s target. This reinforces expectations that the Bank of England will be one of the first major central banks to cut interest rates in the coming months.
Policy Divergence And Trade Positioning
In contrast, the United States economy has remained more robust, maintaining a key divergence. The most recent non-farm payrolls report for January 2026 showed a solid gain of 185,000 jobs, and with US core inflation holding firmer near 2.7%, the Federal Reserve has justification to remain patient. This fundamental mismatch continues to weigh on the GBP/USD exchange rate, which has since broken below the key 1.3300 support level discussed last year.
For the coming weeks, we should consider strategies that benefit from this policy divergence. Buying GBP/USD put options offers a clear way to position for further weakness, especially ahead of the next Bank of England meeting where dovish commentary is expected. Alternatively, selling out-of-the-money call options or implementing a bear call spread could be an effective way to generate income, capitalizing on the view that any rallies in Sterling will likely be limited and short-lived.
Create your live VT Markets account and start trading now.
Start trading now – Click here to create your real VT Markets account
US natural gas futures fell to around $2.98 per MMBtu on Friday, yet prices still point to a weekly gain of more than 4%.
LNG supply risk stays elevated as QatarEnergy’s Ras Laffan faces a slow restart, while the Strait of Hormuz remains shut.
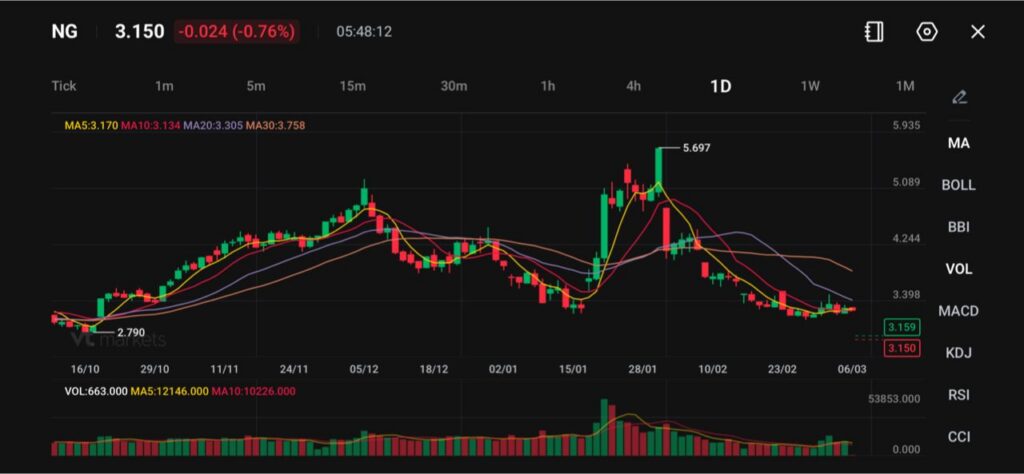
On the chart, NG trades at 3.150, down 0.024 (-0.76%), with MA5 3.170 and MA10 3.134 acting as near-term markers.
US natural gas futures eased to around $2.98 per MMBtu on Friday, trimming the prior session’s gains. Even with the dip, the market still holds onto a weekly gain of more than 4%, which tells you traders have not fully let go of the risk premium tied to the Middle East conflict and LNG supply concerns.
This is a two-speed market. US gas trades on domestic storage and weather, but global LNG stress can still lift sentiment through headline risk and global price signals. That mix often produces choppy sessions where price falls on policy headlines, then stabilises as supply fears return.
Natural gas wholesale prices jumped nearly 50% since the start of the week after Qatar halted exports and the Strait of Hormuz was blocked. Michael Browne from Franklin Templeton says the inflation shock could push the ECB and the Bank of England to raise rates again pic.twitter.com/dLbSzkbE0O
If the news flow stays tense and storage remains tight versus expectations, the weekly bid can persist even if daily pullbacks continue. If traders gain confidence that supply routes and LNG operations normalise, the market may give back part of the weekly gain as it refocuses on domestic fundamentals.
Washington Talks Relief While Markets Price Supply Risk
The Trump administration said it is considering measures to combat rising energy prices tied to the conflict. Traders read that as a near-term cap on runaway energy moves, especially if the US uses financial, logistical, or security levers to reduce shipping and insurance friction in key routes.
US-sanctioned Russian liquefied natural gas vessels are redirecting away from the Mediterranean Sea after one was allegedly attacked by Ukrainian drone boats https://t.co/UMKAr2Ox4D
Even so, policy tools often work best on oil and shipping bottlenecks first. Natural gas can still hold firm if LNG supply looks constrained, because the market worries about replacement cargoes and regional shortages, even when US domestic gas cannot immediately fill the gap.
If Washington announces practical measures that reduce shipping risk quickly, gas may stay range-bound and struggle to extend gains. If measures land slowly, or markets doubt execution, the risk premium can linger.
Ras Laffan Uncertainty Keeps LNG Anxiety Alive
The market keeps circling back to Qatar. Uncertainty around restoring full operations at QatarEnergy’s Ras Laffan plant, the world’s largest LNG export hub, has kept supply fears elevated, especially with the Strait of Hormuz closed. Reuters reporting points to a restart that may take at least two weeks, then at least another two weeks to reach full capacity once liquefaction restarts.
QatarEnergy ceased liquefied natural gas production after military attacks on its Ras Laffan complex, the company said in a statement https://t.co/U2gh1izv9L
This matters because LNG is a timing game. Even a short shutdown can tighten prompt cargo availability, lift freight rates, and force buyers to compete for alternatives. The longer the outage lasts, the more it can ripple into European and Asian pricing, which can then feed back into global energy risk sentiment.
If Ras Laffan restarts along the early timeline and Hormuz reopens, LNG panic may cool and remove a layer of support under US gas. If the closure drags on and restarts slip, traders may keep pricing higher volatility and stronger support levels even if US supply remains ample.
Storage Draw and Weather Reprice Near-Term Demand
Domestic fundamentals still matter most for US pricing. A bigger-than-expected storage withdrawal has supported prices, and warmer weather forecasts have also pointed to demand surprises in the near term. The EIA reported a 132 billion cubic feet (bcf) withdrawal for the week ending February 27, which exceeded analyst expectations in Reuters reporting.
The market now has to balance two forces that often fight each other. Storage draws tighten the near-term cushion, but warmer forecasts can reduce heating demand and soften the next set of withdrawals. That tension often compresses follow-through and increases the odds of mean-reverting price action.
If fresh EIA reports keep printing draws near the high end of expectations, gas can stay supported even with warmer spells. If the weather turns decisively mild and withdrawals shrink fast, the market may drift lower as it prices a looser end-of-season balance.
Natural Gas Chart Shows Stabilisation After a Sharp Reset
Natural gas (NG) is trading near 3.15, down roughly 0.76%, as prices continue to stabilise after the sharp sell-off that followed the spike to 5.70 earlier in the year.
The daily chart shows that the explosive rally in January has fully retraced, with the market now entering a prolonged consolidation phase near the 3.10–3.20 region.
Technically, the market is showing weak momentum. Price is hovering around the 10-day moving average (3.13) and slightly below the 20-day average (3.30), while the 30-day moving average (3.76) remains significantly higher and trending downward.
The 5-day moving average (3.17) is flattening, suggesting that bearish momentum may be fading but has not yet transitioned into a clear bullish reversal.
Immediate support sits around 3.00–3.10, a zone where prices have begun to stabilise following the February decline. A break below this level could expose further downside toward the 2.80–2.90 region, which previously acted as a base earlier in the trend.
On the upside, the first resistance area appears near 3.30–3.40, followed by stronger resistance around 3.70–3.80, where the 30-day moving average currently resides.
Overall, natural gas appears to be range-bound in the near term, with the market attempting to build a base after the sharp correction from the January peak. A sustained move above 3.40 would be needed to signal a potential recovery, while failure to hold above 3.00 could invite renewed selling pressure.
What Traders Should Watch Next
Watch for any concrete announcement from the administration on energy price measures, because it can shift sentiment quickly. Then track updates on Hormuz shipping risk and Ras Laffan restart timing, because those decide whether LNG stress fades or deepens.
Finally, keep the next EIA storage print in focus after the 132 bcf withdrawal, because another upside surprise can change the week’s tone even if the front month keeps wobbling around $2.98 per MMBtu.
Learn more about trading Energies on VT Markets here.
FAQs
Why Can US Natural Gas Fall on the Day but Still Gain Over the Week? Daily moves often react to headlines and positioning, while the weekly move reflects the bigger narrative. Here, prices dipped to around $2.98 per MMBtu on Friday, yet the market still held a weekly gain of more than 4%. Traders can take profit on spikes without abandoning the wider supply-risk theme.
How Does a Middle East Conflict Influence US Natural Gas if the US Produces Its Own Gas? US pricing still reacts to global LNG stress. If overseas supply tightens, international buyers may bid up cargoes and reshuffle flows. That can lift energy risk premiums across markets, even if the US remains well supplied domestically.
Why Does Qatar’s Ras Laffan Plant Matter for Gas Traders Outside the Region? Ras Laffan sits at the centre of global LNG supply. If the timeline for restoring full operations stays unclear, buyers worry about a shortfall. That fear tends to lift volatility and support prices, especially when the Strait of Hormuz stays closed and traders price a longer disruption window.
What Does “Measures to Combat Rising Energy Prices” Usually Mean for Markets? It usually means the government may use policy or logistical tools to reduce price pressure, such as actions that ease shipping frictions or improve supply flow. Even the discussion can cool momentum buying because traders expect some form of response when energy costs rise.
How Do Storage Withdrawals Move Natural Gas Prices? Storage tells the market how tight supply is versus demand. A bigger-than-expected withdrawal signals stronger consumption, weaker supply, or both. That can support prices even if the market pulls back intraday, because it changes how traders model the end-of-season balance.
Why Do Weather Forecasts Matter So Much for Natural Gas? Weather drives demand fast, especially for heating and power. Warmer forecasts can reduce heating demand and soften future withdrawals. Colder forecasts can do the opposite. That is why price can swing even when the broader macro story stays the same.
Start trading now – Click here to create your real VT Markets account
NZD/USD fell over 0.7% on Thursday, ending near 0.5900 and hitting its lowest level since late January. It has retraced most February gains after topping near 0.6090 in early February and breaking support around 0.5920.
The RBNZ kept the Official Cash Rate at 2.25% in February. It signalled no hike until late 2026, with overnight index swaps down about eight basis points and September hike odds falling to about 40% from 68%.
Monetary Policy Divergence
The policy gap with Australia widened after the RBA lifted rates to 3.85% in February and is weighing another move for May. This has added pressure on the New Zealand Dollar.
Safe-haven demand supported the US Dollar as the Strait of Hormuz was described as effectively closed. US crude oil rose above $80 per barrel for the first time since mid-2024, raising New Zealand’s oil import costs.
The Federal Reserve held rates at 3.50% to 3.75% in January, with minutes showing a hawkish tilt. US Non-Farm Payrolls are forecast at around 60K for February, down from 130K in January.
NZD/USD traded at 0.5898, with support near 0.5890–0.5900, then 0.5850 and 0.5800. Resistance sits at 0.5950, then 0.6000 and 0.6050.
Trade Bias And Key Risks
The current market environment strongly favors short positions on the NZD/USD pair. Geopolitical tension from the Strait of Hormuz crisis is driving a classic flight to safety, strengthening the US Dollar and punishing risk-sensitive currencies like the Kiwi. We see this trend continuing as long as global risk aversion is the dominant theme.
The monetary policy divergence between the central banks provides a powerful fundamental reason for this bearish view. The RBNZ’s dovish stance, keeping rates at 2.25%, contrasts sharply with the Federal Reserve’s hawkish tilt and rates above 3.50%. This interest rate differential, which is the widest we have seen since late 2024, makes holding US Dollars more profitable than holding New Zealand Dollars.
New Zealand’s specific economic vulnerabilities are also coming into focus. With US Crude Oil prices holding above $80 a barrel, the country’s status as a net energy importer becomes a significant drag on its economy. Furthermore, we saw prices in this week’s Global Dairy Trade auction slip another 1.4%, signaling weakness in New Zealand’s most important export sector.
Given the strong downward momentum, we should consider buying NZD/USD put options with a strike price at or below 0.5850. Using options allows us to define our maximum risk, which is prudent ahead of today’s highly anticipated US Non-Farm Payrolls report. A confirmed daily close below the 0.5900 support level would be the signal to initiate or add to these positions.
The NFP release is the main event risk, with a weak forecast of 60K that could cause a temporary spike. However, we recall periods in 2025 when the market looked past soft labor data because the broader inflation narrative was more compelling. A surprisingly strong NFP number would likely accelerate the sell-off, while a miss might only provide a better level to establish new shorts once the dust settles.
Create your live VT Markets account and start trading now.
Start trading now – Click here to create your real VT Markets account
The Australian Dollar fell as risk-off flows linked to the Middle East supported the US Dollar. AUD/USD dropped about 1% on Thursday to near 0.7010 after dipping below 0.7000, and it remains in a roughly 150-pip range between 0.7000 and about 0.7150.
Australia’s Q4 GDP rose 0.8% quarter-on-quarter, with annual growth at 2.6%, the fastest pace since early 2023. The RBA lifted rates to 3.85% in February, and markets price around a 30% chance of a March hike, while a move to 4.10% in May is fully priced.
Inflation And Energy Shock
Rising crude oil prices, linked to an effective Strait of Hormuz shutdown and the Iran conflict entering its sixth day, are affecting inflation expectations. The RBA’s inflation target is 2–3%.
US February nonfarm payrolls are forecast near 60K versus 130K in January, with unemployment seen at 4.3%. Fed officials continue to debate rates while still indicating cuts remain on track this year.
Technically, AUD/USD traded at 0.7009, with support at 0.6960, 0.6920, and 0.6890, and resistance at 0.7045, 0.7085, and 0.7120. Iron ore is Australia’s largest export, worth $118 billion a year (2021 data), and China is the main destination.
The Australian Dollar is currently caught between conflicting forces, with risk-off sentiment from the Middle East pushing it down while a strong domestic economy suggests it should be higher. Surging crude oil prices, with Brent crude futures now holding above $115 per barrel, are fueling global inflation fears and supporting the safe-haven US Dollar. This complicated picture makes directional bets on the Aussie risky in the immediate term.
RBA Meeting Risk
We are now looking toward the Reserve Bank of Australia’s meeting on March 16-17 with uncertainty. While the strong Q4 2025 GDP figures and the RBA’s hawkish talk suggest a rate hike is possible, market pricing and this week’s surprise 0.2% contraction in January retail sales show the economy may be cooling. This divergence between hawkish central bank commentary and weakening consumer data creates a difficult trading environment.
All eyes are now on the US Nonfarm Payrolls report due later today, which is expected to show a significant slowdown in job creation. A weaker-than-expected number could dampen the US Dollar’s recent strength, but the ongoing conflict in Iran continues to provide a strong underlying bid for the currency as a safe haven. We see this as a pivotal event that could either break the AUD/USD below key support or provide a much-needed bounce.
Adding to the pressure on the Aussie, recent data from China showed its Caixin Manufacturing PMI dipped to 49.8, indicating a slight contraction in the manufacturing sector of Australia’s largest trading partner. Consequently, we’ve seen iron ore futures pull back below $120 per tonne, weakening a key pillar of support for the currency. This raises concerns about the sustainability of Australia’s export growth in the first quarter of 2026.
Given the AUD/USD is trapped in a range and facing major event risk, derivative traders should consider strategies that profit from a spike in volatility. Implied volatility on one-month options has already climbed above 12%, and purchasing a strangle using out-of-the-money puts and calls could position for a breakout without needing to predict the direction. This allows us to capitalize on a decisive move out of the 0.7000 to 0.7150 consolidation band.
For those with a bearish bias, buying short-dated put options with a strike price just below the psychological 0.7000 level offers a low-cost way to position for a breakdown. If today’s US jobs data comes in strong or geopolitical tensions escalate further, the pair could quickly break its recent support. This strategy provides defined risk ahead of the volatile RBA meeting in just over a week’s time.
Create your live VT Markets account and start trading now.
Start trading now – Click here to create your real VT Markets account
EUR/USD fell 0.21% on Thursday, moving towards 1.1600 as risk-averse trading continued amid the conflict in the Middle East. US equity markets ended the session lower, and firm US economic data supported the US Dollar.
Initial Jobless Claims for the week ending 28 February came in at 213K versus 215K expected. Challenger, Gray & Christmas reported announced layoffs of 48,300 in February, down 55% from 108,435 in January.
Dollar Strength And Risk Aversion
Richmond Fed President Thomas Barkin referred to sticky inflation and said recent jobs figures show a solid labour market. He also said the balance of risks could change as inflation remains a concern.
European Central Bank accounts showed policymakers kept interest rates unchanged and discussed inflation possibly moving further below the 2% target. The meeting occurred before tensions between the United States and Iran escalated, which has affected the outlook for energy-importing Europe.
Friday’s Eurozone calendar includes employment data and GDP for the last quarter of 2025, alongside comments from ECB President Christine Lagarde. In the US, January retail sales and February Nonfarm Payrolls are due, with payrolls expected at 59K and unemployment seen at 4.3%.
EUR/USD traded at 1.1609, with RSI at 33 and resistance at 1.1700/1.1720 then 1.1820. Support levels are 1.1615 and 1.1570/1.1550.
The immediate outlook for EUR/USD is bearish, with the pair pressing towards the 1.1600 level as solid US economic data and global risk aversion strengthen the dollar. This environment suggests that we should consider strategies that benefit from a falling euro. We believe this downward pressure will continue in the coming weeks.
Strategy And Event Risks
The recent strength in the US labor market, reminiscent of the surprisingly resilient job reports we saw throughout 2025, gives the Federal Reserve little reason to soften its stance. With the latest Consumer Price Index data showing core inflation stubbornly holding above 3%, policymakers will likely remain concerned about sticky prices. This policy divergence strongly favors the dollar over the euro for the foreseeable future.
On the other side, the European Central Bank has signaled concerns that inflation could fall below its target, a stark contrast to the Fed’s position. This policy difference is reflected in the US-German 2-year yield spread, which has widened to over 180 basis points, making the dollar more attractive to hold. The region’s dependence on energy imports also makes it more vulnerable to the escalating US-Iran conflict, weighing heavily on the euro.
Given this outlook, we believe buying EUR/USD put options is a prudent strategy to position for further downside, targeting a move toward the 1.1550 support band. For those with a more neutral-to-bearish view, selling call spreads with a ceiling around the formidable 1.1700 resistance could be an effective way to collect premium while defining risk. These positions allow for profit from either a continued slide or sideways consolidation.
The upcoming US Nonfarm Payrolls report is the key event risk we are watching this week. While the consensus is a weak 59,000, any number significantly above 150,000 would likely validate the Fed’s cautious stance and could accelerate the EUR/USD decline. We should therefore be prepared for heightened volatility around the release and manage positions accordingly.
Create your live VT Markets account and start trading now.
Start trading now – Click here to create your real VT Markets account
USD/JPY rose during Thursday’s North American session by nearly 0.30% and traded at 157.50. It held above 157.00 as the US Dollar gained support from weaker risk appetite, strong US jobs data, and hawkish remarks from Richmond Fed President Thomas Barkin.
On the daily chart, a bullish engulfing pattern suggests buyers are in control near current levels. The move may be limited near 158.00 due to the risk of action by Japanese authorities.
Momentum And Key Technical Levels
Momentum remains positive, with the Relative Strength Index above its neutral line and still below overbought territory. Further upside would require a break above the March 3 high at 157.97.
If 157.97 is cleared, the next levels are 158.50 and 159.00. Above that, targets include the January 23 high at 159.22 and then 160.00.
The Yen is influenced by Japan’s economic performance, Bank of Japan policy, US–Japan bond yield differences, and market risk sentiment. The BoJ ran ultra-loose policy from 2013 to 2024, weakening the Yen, and began unwinding it in 2024, which has narrowed the 10-year US–Japan yield gap.
Looking back at analysis from last year, we can see the strong bullish momentum that pushed USD/JPY toward 157.50. At the time, solid US jobs data and a hawkish Fed were the primary drivers for dollar strength. Now, in March 2026, the situation has evolved, and the pair trades closer to 150.50 as different factors take priority.
Rates Policy Divergence And Intervention Risk
The interest rate differential between US and Japanese bonds, a key factor mentioned in 2025, continues to steer the currency pair. Currently, the US 10-year Treasury yield sits at around 4.1%, while the 10-year Japanese Government Bond yield has risen to 0.75%, slightly narrowing the gap that previously favored the dollar so heavily. This narrowing trend is what we are focused on for the coming weeks.
We have seen the Bank of Japan follow through on its policy shift, having exited negative interest rates late last year and signaling a potential for another small hike. This is happening just as the Federal Reserve is now projecting rate cuts for later in 2026, with recent US core PCE inflation data easing to 2.8%. The divergence in central bank policy that drove the dollar up is now beginning to reverse course.
The threat of intervention by Japanese authorities, which was a concern near 158.00 in 2025, remains a critical ceiling for the market. We only have to remember the direct interventions seen in late 2022 when the pair pushed past 151.00, a level that is once again psychologically important. Any sudden spike in USD/JPY will likely be met with aggressive verbal warnings from Tokyo, capping upside.
Given this backdrop, buying long-dated call options on USD/JPY appears to be a high-risk strategy. We believe traders should consider selling call spreads or outright selling out-of-the-money calls with strike prices above 152.50 to take advantage of the strong resistance and collect premium. This strategy positions for a range-bound or slightly lower movement in the pair over the next few weeks.
Create your live VT Markets account and start trading now.
Start trading now – Click here to create your real VT Markets account