FXStreet data shows gold prices in the Philippines rose as the precious metal gained in local markets today
Gold prices in the Philippines rose on Monday, according to FXStreet data. Gold cost PHP 9,580.69 per gram, up from PHP 9,460.40 on Friday.
Gold also rose to PHP 111,747.30 per tola from PHP 110,344.30 per tola. Other listed prices were PHP 95,806.70 for 10 grams and PHP 297,994.10 per troy ounce.
Singapore’s year-on-year Consumer Price Index rises to 1.4% in January, up from 1.2% previously
Singapore’s consumer price index (CPI) rose 1.4% year on year in January, up from 1.2% in the previous month.
That means inflation increased by 0.2 percentage points versus the prior reading. No additional breakdown was provided.
Implications For Mas Policy
January’s rise in inflation to 1.4% year over year suggests that disinflation may be losing momentum. We have been positioned for a neutral Monetary Authority of Singapore (MAS) for weeks, but this print requires a rethink. The market is now starting to reduce expectations for any policy easing at the April 2026 meeting. We see the clearest reaction in interest rate derivatives—specifically by selling 3-month SORA futures contracts. This position benefits if short-term rates move higher, which is a likely outcome if MAS turns more hawkish. We saw a similar move in 2025, when a surprise inflation print in Q3 triggered a sharp sell-off in these contracts. This inflation reading also supports our bullish view on the Singapore Dollar, since MAS uses the exchange-rate band as its main policy tool. We are looking to buy SGD call options versus the USD, expecting the central bank to prefer a stronger currency to limit import-price pressures. During the 2022–2023 tightening cycle, SGD strengthened by more than 5% against the dollar as MAS adjusted its policy band five times in a row. In equities, steady inflation and the risk of tighter policy are headwinds for the Straits Times Index (STI). Higher interest rates can weigh on corporate earnings and growth, which helped cap the index through much of 2025. We are considering buying put options on the STI as a hedge against a potential decline into the second quarter.Equity Market Risk Considerations
Create your live VT Markets account and start trading now.FXStreet data shows gold prices in the United Arab Emirates rose overall today, with bullion trading higher.
Gold prices in the United Arab Emirates rose on Monday, according to data compiled by FXStreet. Gold traded at AED 609.17 per gram, up from AED 601.89 on Friday.
Gold also climbed to AED 7,105.25 per tola, from AED 7,020.34 on Friday. Other listed prices were AED 6,091.71 per 10 grams and AED 18,947.43 per troy ounce.
Uae Gold Price Snapshot
FXStreet calculates local gold prices by converting global prices using the USD/AED exchange rate and local units. Prices are updated daily at the time of publication and are meant as a guide, as local rates may vary slightly. Central banks are the largest holders of gold. World Gold Council data shows central banks added 1,136 tonnes of gold—worth about $70 billion—to their reserves in 2022. That was the biggest annual purchase since record-keeping began. Gold prices move with several factors, including the US Dollar, US Treasury yields, interest rates, investor risk appetite, geopolitical tension, and recession fears. Since gold is priced in US dollars (XAU/USD), a weaker Dollar often supports higher gold prices. Gold has posted a modest but clear rise, with prices now above AED 609 per gram. This increase follows a recent drop in the US Dollar Index, which fell below 101.5 last week for the first time this year. Because gold often moves opposite the Dollar, traders should keep a close eye on currency markets for signs of further Dollar weakness.Market Outlook And Trading Ideas
Markets are focusing on the Federal Reserve’s next steps. Futures markets now price in a 65% chance of a rate cut by the third quarter of 2026. Because gold does not pay interest, it tends to look more attractive when rates are expected to fall. In contrast, the steady rate environment through 2025 limited gold’s upside, so any shift in policy could matter. With this setup, implied volatility in gold options may rise in the coming weeks. Traders may consider buying call options or using bull call spreads to seek upside while clearly limiting risk. These strategies can benefit from a rally driven by geopolitical concerns or a more dovish turn from central banks. Central bank demand also remains an important support. Central banks added another 950 tonnes to reserves in 2025, extending the trend seen in recent years. This ongoing institutional buying helps create a strong floor under prices. Any escalation in maritime disputes or trade tensions could further strengthen gold’s safe-haven appeal. Record highs in equities also strengthen the case for hedging with gold. The S&P 500 price-to-earnings ratio is near 24, a level that has often been linked to market pullbacks. Using gold futures as a hedge may help protect portfolios if risk assets decline. Create your live VT Markets account and start trading now.FXStreet data shows that gold prices in Pakistan climbed as the metal gained value across local markets
Gold prices rose in Pakistan on Monday, based on FXStreet-compiled data. Gold was priced at PKR 46,138.03 per gram, up from PKR 45,568.61 on Friday.
Per tola, gold increased to PKR 538,144.90 from PKR 531,503.40 on Friday. Listed prices were PKR 461,380.30 for 10 grams and PKR 1,435,053.00 per troy ounce.
Pakistan Gold Pricing Method
FXStreet calculates Pakistan gold prices by converting global gold rates into PKR using the USD/PKR exchange rate and local weight units. Prices are updated daily using market rates at the time of publication, but local prices may differ slightly. Central banks hold more gold than any other group. They often use it to diversify their reserves. According to the World Gold Council, they bought 1,136 tonnes of gold worth about $70 billion in 2022. That was the highest annual total since records began. Gold is often said to move in the opposite direction of the US Dollar and US Treasury yields. It can also move opposite to risk assets. Key drivers include geopolitical tension, recession worries, interest rates, and the strength of the US Dollar, since gold is priced in dollars (XAU/USD). Gold’s safe-haven role is important in today’s market. Central banks are still buying heavily. Official sector purchases topped 1,000 tonnes again in 2025, showing a clear push to diversify away from the dollar. This steady institutional demand is helping to support prices.Interest Rate Outlook
In the weeks ahead, the main focus is interest rates. With the Federal Reserve keeping rates steady around 3.75%, traders now expect at least two more cuts before year-end. Gold does not pay interest, so it becomes more attractive when the cost of holding it falls. These rate-cut expectations are also weighing on the US Dollar. A weaker dollar often lifts gold prices. The dollar index (DXY) has already eased from its 2025 highs. This currency trend is supporting the wider precious metals market. Because the timing of the next rate cut is unclear, we expect volatility to rise. Derivatives traders may consider call options or call spreads to position for a potential move above recent resistance. These trades can capture upside while limiting risk if prices stay range-bound. We also remember the sharp rate hikes that started in 2022 to fight high inflation. Gold held up well then, but the market focus has changed. Now, investors are watching when and how fast central banks will start easing. Create your live VT Markets account and start trading now.Despite falling near 109.05, AUD/JPY stays above the 100-day EMA as the yen gains on rising tensions
AUD/JPY slipped to around 109.05 in early European trading on Monday. Trade-war fears, Middle East tensions, and broad uncertainty boosted demand for the Japanese Yen. This kept the pair near 109.00, as investors moved into safer currencies.
The Australian Dollar held up better than usual because traders expect the Reserve Bank of Australia (RBA) to stay firm. Strong Australian data has strengthened the view that the RBA will keep a tightening bias to deal with stubborn inflation.
Daily Chart Technical Overview
On the daily chart, AUD/JPY is still above the 100-day EMA, which sits at 104.35. Price is slightly above the 20-day middle Bollinger Band, and the wide bands suggest high volatility. The RSI is 56.29, showing neutral momentum after easing from earlier overbought levels. Support sits at 108.82, with the next level lower at 106.98. Resistance is at 110.65, which is also the upper Bollinger Band. A daily close above 110.65 could signal more upside. The Yen is driven by Japan’s economic outlook, Bank of Japan (BoJ) policy, bond yield spreads, and overall risk appetite. The BoJ’s very loose policy from 2013 to 2024 weakened the Yen, while policy changes in 2024 have helped support it.Strategy Implications And Risk Management
AUD/JPY is pulling back near 109.00, which creates a key decision point for our strategies. The bigger trend is still bullish, but short-term safe-haven demand for the Yen is pressuring the pair. This demand is being fueled by renewed US–China trade tensions, especially around technology tariffs. We see this dip as a test of the Australian Dollar’s underlying strength. The argument for a stronger AUD is still solid, which supports buying into weakness. The RBA remains hawkish, backed by the latest official Q4 2025 data showing annual inflation at 3.9%, well above target. Unemployment is also low at 3.7%. With these conditions, the RBA has little reason to cut its 4.85% cash rate, and that continues to attract yield-focused investors to the Aussie. At the same time, we need to respect the rising demand for the Yen as a safe haven. Risk sentiment has weakened, with the VIX climbing from 14 to 18 over the past two weeks, which tends to support JPY. For traders, this means long AUD/JPY positions should be protected. Put options with strikes below the 108.82 support level can be a practical hedge against further geopolitical shocks. We are also watching the BoJ closely. Since the BoJ ended its negative interest rate policy in late 2024, the slow unwind of its ultra-loose stance has helped put a floor under the Yen. Even if normalization remains gradual, it is starting to reduce the large rate gap that has supported the AUD for years. With volatility elevated (as shown by the wide Bollinger Bands), option premiums are expensive. So, rather than buying options outright, we may prefer structures like bull call spreads. These can target a move toward the 110.65 resistance while limiting the upfront cost, even though they also cap upside. The goal is to manage the high cost of volatility while staying positioned for the longer-term uptrend to resume. Create your live VT Markets account and start trading now.Compiled data in India shows gold prices rose during Monday’s trading session, reflecting an upward move
Gold prices in India rose on Monday, according to FXStreet data. Gold was priced at INR 15,084.29 per gram, up from INR 14,895.78 on Friday.
Gold rose to INR 175,940.20 per tola from INR 173,741.40 per tola. Other listed prices were INR 150,842.90 for 10 grams and INR 469,174.20 per troy ounce.
How Fxstreet Calculates Indian Gold Prices
FXStreet calculates Indian gold prices by converting international gold prices using the USD/INR exchange rate and local units. Prices are updated daily at the time of publication and are for reference only, since local rates may differ slightly. Central banks hold the largest gold reserves. They added 1,136 tonnes of gold worth about $70 billion in 2022, according to the World Gold Council. This was the highest yearly total since records began. Gold often moves in the opposite direction to the US Dollar and US Treasuries. Prices can also change with geopolitical tension, recession fears, interest rates, and shifts in the XAU/USD exchange rate. Many investors see gold as a key safe-haven asset during uncertain times. Because gold does not pay interest, it tends to look more attractive when interest rates are expected to fall. Recent price action suggests markets expect the Federal Reserve to move toward easier policy later this year.Rates Inflation And What Traders Are Watching
High interest rates shaped monetary policy throughout 2025, as inflation stayed above target. By late January 2026, U.S. inflation was just under 3%. That makes the Fed’s next rate decision the key issue for markets. Derivatives traders are watching closely for signs of rate cuts, which could weaken the dollar and lift gold prices. Another major support for gold has been steady buying by central banks. After the record purchases in 2022 and 2023, World Gold Council data shows central banks added more than 800 tonnes in 2025. This ongoing demand, especially from emerging economies, has helped put a firm floor under gold prices and limited sharp declines. The inverse link between gold and the US Dollar remains important. The US Dollar Index (DXY) has started to soften this year after a strong 2025. If the dollar keeps falling on expectations of Fed rate cuts, it would likely support higher gold prices. Geopolitical risk also matters, keeping gold’s safe-haven appeal in focus. Ongoing tensions and uncertainty about global growth are pushing some investors toward safer assets. This risk-off mood often helps gold and can weigh on equities. With these forces coming together, derivatives traders may look at strategies that could benefit from higher prices and greater volatility. Buying call options or using bull call spreads can provide upside exposure with defined risk. Selling out-of-the-money put options is another approach for traders who believe central-bank buying will continue to support prices. Create your live VT Markets account and start trading now.Week Ahead: Shifting Fed Cut Expectations Following US CPI

This week’s macro landscape is defined by a tension between easing headline inflation and persistent core price pressures.
US CPI for January slowed to 2.4% year on year, coming in below the 2.5% forecast and down from 2.7% in December. Softer energy costs, particularly lower petrol prices, contributed to the decline in the headline figure.
Beneath the surface, however, inflation remains less reassuring. The Federal Reserve’s preferred measure, December’s PCE index, stands at 2.9% year on year, with core PCE at 3.0%. Services inflation and other essential costs continue to run firm, keeping policymakers cautious about easing policy prematurely.
Labour market data paints a similarly mixed picture. January Non-Farm Payrolls rose by 130,000, comfortably above expectations of around 70,000 and significantly higher than December’s revised 48,000 reading.
At the same time, earlier benchmark revisions showed that employment figures throughout 2025 had been overstated, aligning with VT Markets’ research highlighting a gradual softening in the jobs market.
Minutes from the Fed and recent official commentary underscore a guarded approach. Policymakers describe progress towards the 2% inflation target as uneven and emphasise that any rate reductions will remain data-dependent, while some still point to the possibility of further tightening should inflation stall.
Fed funds futures and FedWatch indicators now imply a strong likelihood of rates remaining unchanged through the March meeting, with markets increasingly anticipating the first cut around mid-2026 rather than earlier in the year.
The Tariff Twist
A significant development followed the US Supreme Court’s ruling that the authority to impose broad-based tariffs lies with Congress rather than the President.
The judgment removes a key executive policy instrument and could result in approximately $160 billion in refunds to importers.
For financial markets, this development carries two primary implications:
1. USDX impact: The unwinding of tariff-related inflows may weigh on the dollar if importers reverse earlier currency hedges.
2. S&P 500 effect: Reduced effective import costs could help stabilise corporate margins and support forward earnings expectations.
Nonetheless, the White House is reportedly considering a 150-day Emergency Surcharge as an interim measure. Market participants will be monitoring whether such a proposal withstands legal scrutiny.
Escalating US–Iran Tensions And The Geneva Deadline
Washington has issued a 48-hour ultimatum to Iran, demanding agreement to a revised framework ahead of Thursday’s meeting in Geneva.
The US has deployed carrier groups to the region. Although Iran has stated it will not capitulate, diplomatic discussions have not formally collapsed.
This development carries direct implications for XAUUSD and crude markets:
1. Heightened geopolitical risk tends to bolster safe-haven demand, supporting XAUUSD above the 5,000 level.
2. A breakdown in negotiations could prompt traders to price in a spike in oil and generate short-term strength in USDX.
Market Movements Of The Week
Gold (XAUUSD)
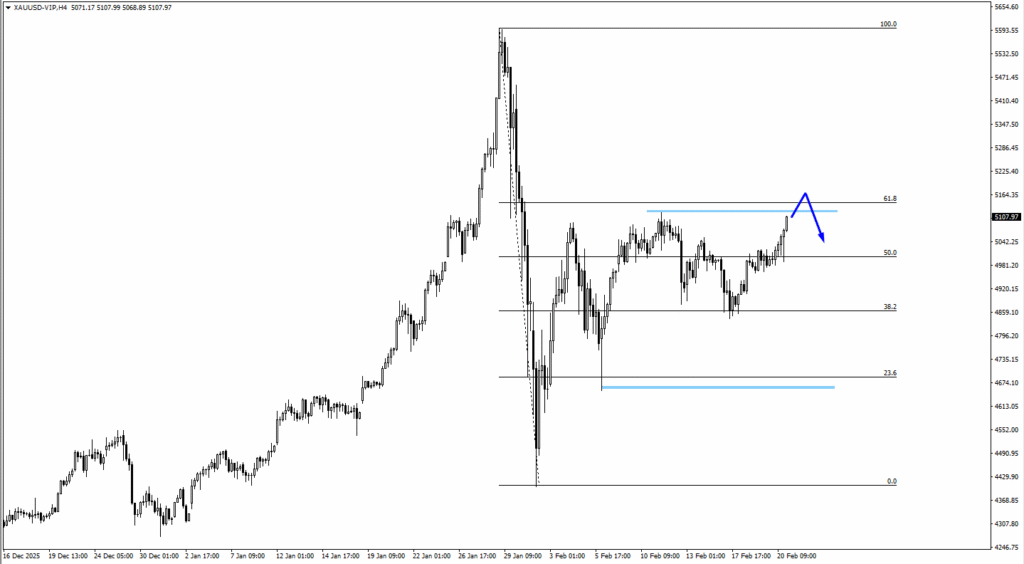
– XAUUSD climbed to around $5,170 in early Asian trading on Monday, approaching 61.8% Fibonacci resistance at 5164.35.
– 5164.35 remains a key rejection zone, with 4981.20 acting as 50% support.
– Catalyst: Fed rate cut expectations and upcoming US inflation data.
Bitcoin (BTCUSD)
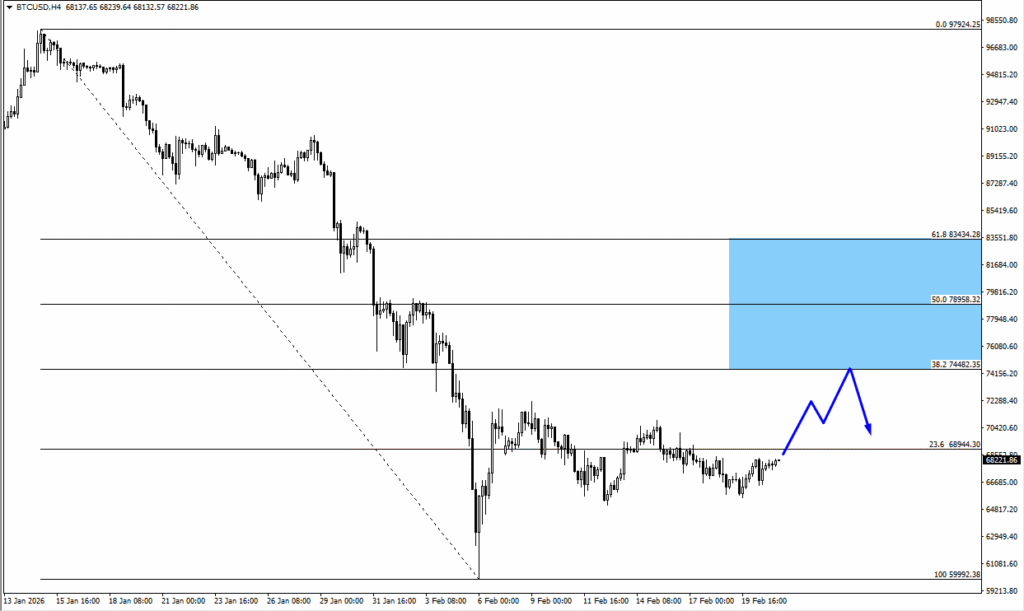
– BTCUSD rejected $65,000 and stabilised near $62,000.
– $59,500 support is critical for the structure.
– Catalyst: US inflation and SP500 reaction.
US Dollar Index (USDX)
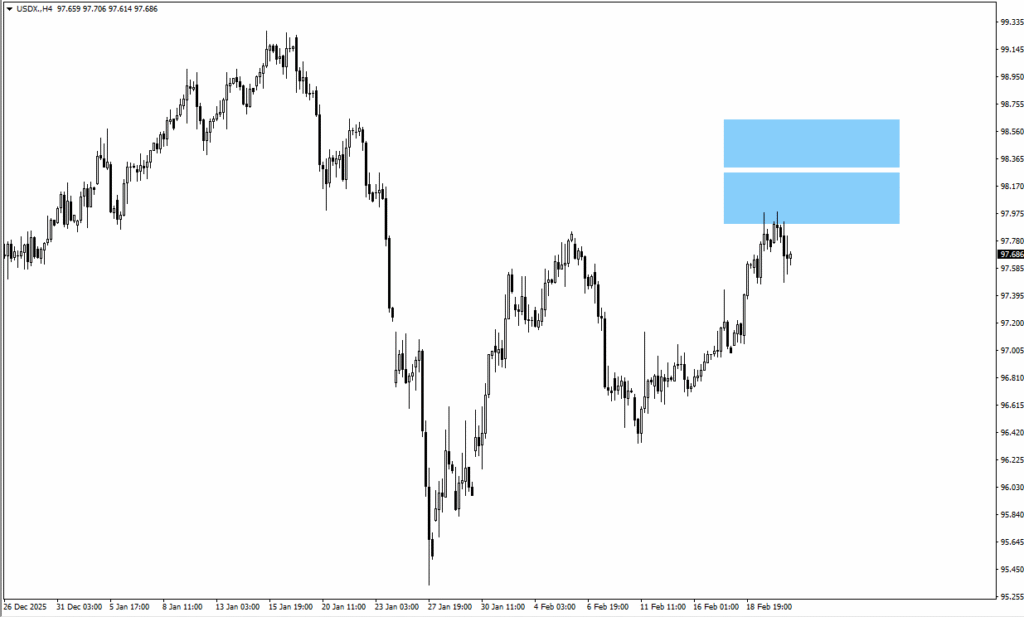
– USDX testing 98.10 resistance zone.
– 98.65 breakout shifts momentum bullish.
– Catalyst: Fed rate cut expectations and PPI.
SP500
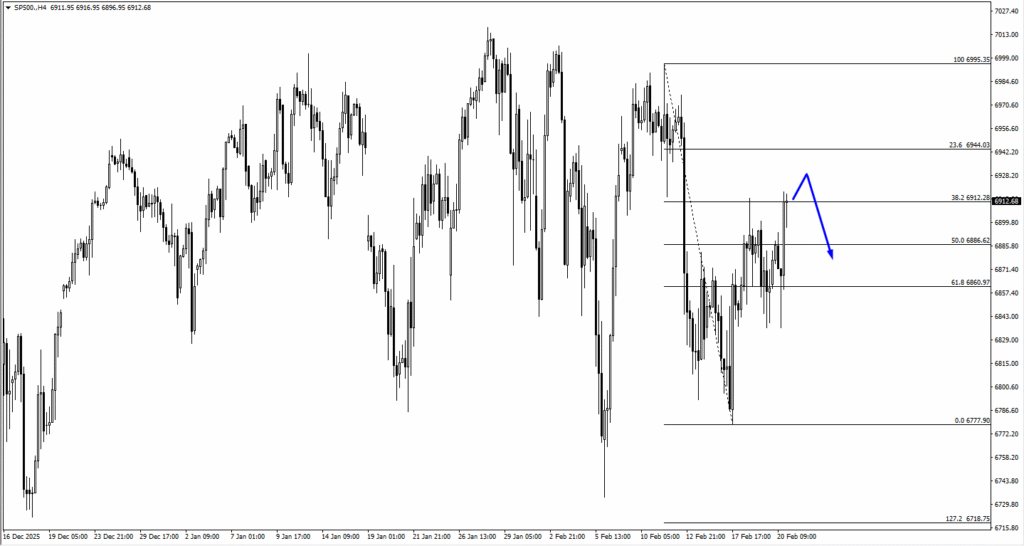
– SP500 is trading around 6,912, which aligns exactly with the 38.2% retracement.
– Immediate resistance sits at 6,944 at the 23.6% retracement, where sellers may react.
– Deeper support sits at 6,860, which is the 61.8% retracement zone.
Key Events This Week
26 February 2026
1. US – Iran Talks Geneva
Expect gold and oil volatility.
27 February 2026
1. US PPI m/m, Forecast: 0.30%, Previous: 0.50%
Direct input for Fed rate cut expectations.
Bottom Line
Gold begins the week pressing against the 61.8% Fibonacci resistance level at 5164.35, with XAUUSD trading just below this critical threshold. The next directional move is likely to hinge on evolving expectations around Fed rate cuts and incoming US inflation data.
With US PPI figures and additional labour data due, markets are reassessing the timing of the initial Fed rate reduction. Should inflation continue to moderate, XAUUSD may extend its rebound.
Conversely, if price pressures re-emerge, the dollar could strengthen and restrain further gains in gold. The coming week will centre on whether conviction builds around rate cut expectations or whether the narrative undergoes another adjustment.
During Asian trading, EUR/USD edges up near 1.1820, holding above the nine-day EMA as RSI at 51 signals stabilising momentum
EUR/USD rose for a second session and traded near 1.1820 during Asian hours on Monday. The 14-day RSI is 51, which is neutral, after moving back above the midpoint.
If the RSI rises into the mid-50s, upside momentum may strengthen. If it drops below 50, downside risk may increase and shift focus to support levels.
Daily Chart Trend Context
On the daily chart, the pair is still above the 50-day EMA, which supports the broader bullish bias. The nine-day EMA is flat near the current price, which may cap near-term follow-through. EUR/USD is trading around the nine-day EMA at 1.1820. A daily close above this level could strengthen the bullish bias and open the way toward 1.2082, the highest level since June 2021. A close below the nine-day EMA could bring the 50-day EMA at 1.1775 into focus. A break below the 50-day EMA could add downside pressure toward 1.1578, the two-month low set on 19 January. EUR/USD is also stuck in a tight range around 1.1820, right on the nine-day moving average. This key technical level comes as the ECB and the Fed send mixed signals in early 2026. The lack of direction suggests the market is waiting for a clear catalyst before choosing a trend.Options Strategy For Breakout Risk
The RSI stabilizing near 51 and the flat moving average suggest the recent low-volatility phase may be nearing its end. In 2025, similar consolidations often led to sharp breakouts. Current data points the same way: the Deutsche Bank Euro Currency Volatility Index (EUVIX) has risen to 8.5, its highest level in three months. With uncertainty rising, buying options can be an effective way to prepare for a larger move. One approach is a long strangle, where you buy an out-of-the-money call and an out-of-the-money put. This strategy can profit from a breakout in either direction, without needing to correctly predict which way the pair will move. For bullish traders, the latest Eurozone flash CPI for January 2026 came in at 2.1%, which may push the ECB to keep a hawkish tone. Buying call options with a strike near 1.1850 could be a direct way to position for a move toward the 1.2082 resistance. The aim is to enter before market conviction builds and option premiums rise. If the pair closes back below 1.1820, a bearish view becomes more likely. The latest US jobs report showed 195,000 jobs added, but wage growth slowed, sending mixed signals that could still support the dollar. Buying put options with a strike near 1.1775 could target a move toward 1.1578, the two-month low. Create your live VT Markets account and start trading now.FXStreet’s compiled figures show Malaysian gold prices rose, with bullion moving higher in Monday’s session.
Gold prices rose in Malaysia on Monday, according to FXStreet data. Gold climbed to MYR 645.59 per gram, up from MYR 637.61 on Friday.
Gold also increased to MYR 7,530.01 per tola, from MYR 7,437.01 per tola on Friday. Other prices listed were MYR 6,455.96 for 10 grams and MYR 20,080.03 per troy ounce.
How FXStreet Calculates Local Gold Prices
FXStreet converts global gold prices into Malaysian Ringgits using the USD/MYR exchange rate and local units. Prices are updated daily at the time of publication and are meant as a reference. Local market prices may differ slightly. Central banks hold more gold than any other group. World Gold Council data shows they bought 1,136 tonnes of gold in 2022, worth about $70 billion. This was the largest annual total since records began. Gold often moves in the opposite direction of the US Dollar and US Treasury yields. It can also move against risk assets like stocks. Prices can change due to geopolitics, recession concerns, and interest rates. The US Dollar also matters because gold is priced in dollars (XAU/USD). Gold has been strong in recent sessions, with prices rising. This supports its role as a safe-haven asset during periods of economic uncertainty. We are watching this move closely, as it may point to a broader trend in the coming weeks.Outlook Drivers And Key Risks
This move is mainly linked to a weaker US Dollar and changing expectations for interest rates. After the rate hikes seen through 2025, recent US jobs data showed modest cooling. This has led many to expect the central bank to pause its tightening cycle. A pause is often positive for gold because it reduces the cost of holding an asset that does not pay interest. Central banks also continue to buy gold, which helped support prices last year. New reports suggest that central banks, especially in Asia, added more than 800 tonnes to their reserves in 2025. This continued official demand may help limit major declines. In the weeks ahead, we may consider using options to take a bullish position while controlling risk. For example, buying call spreads can provide exposure to further gains with a clearly defined maximum loss. Implied volatility has risen to about 18% from last month’s lows, so these strategies may offer a measured way to take part in the rally. The biggest risk to this view would be a sudden rebound in risk assets, such as stocks. If inflation data is hotter than expected, investors may again price in more rate hikes. That could strengthen the dollar and weigh on gold. We will be watching the next Consumer Price Index release closely. Create your live VT Markets account and start trading now.Trade war worries lift the yen, while USD/JPY remains under pressure near 154.35 despite a slight rebound
USD/JPY slid during Asian trading on Monday. It fell toward 154.00 before recovering slightly to around 154.35. The pair was still down more than 0.45% on the day and remained vulnerable to further losses.
Sentiment weakened after US President Donald Trump announced a new 15% global levy. This followed a Supreme Court ruling on Friday that went against his broader tariff plan. The announcement raised concerns about retaliation and supply-chain disruption. That helped the Japanese Yen and pressured the US Dollar.


