The NZD/USD keeps falling for the second day as the market gets anxious. The US Dollar is gaining strength because of trade tensions and lower hopes for an immediate interest rate cut by the Federal Reserve, which is hurting the NZD.
Donald Trump has announced a 30% tariff on EU and Mexican products starting August 1. This move lowers demand for riskier assets. Technical analysis shows a bearish trend, as failing to break the 100-period Simple Moving Average indicates more declines ahead.
Nzdusd Support And Resistance Levels
The NZD/USD is now around the 0.5980-0.5975 support level. If it drops below the 61.8% Fibonacci retracement, it could fall further to 0.5935 and possibly reach 0.5900. Resistance might appear at 0.6025.
If the pair breaks past 0.6025, it could rise to 0.6060 and even attempt to reclaim 0.6100. Any further movement may test 0.6120, shifting the outlook to favor buyers.
The US Dollar has shown strength against various currencies this past week, especially the Yen. A visual heat map highlights percentage changes and reveals currency movements based on specific base and quote pairs.
Building on the earlier analysis, the recent strength of the US Dollar is tied to changing interest rate expectations in the United States. With decreased expectations for rate cuts and heightened trade tensions following Trump’s tariff announcement, riskier currencies like the New Zealand Dollar have been affected. This isn’t just a reaction to headlines; it reflects a broader market adjustment as traders rethink future yields.
Traders who focus on price momentum and short-term interest rates might want to reevaluate their positions around the current levels of 0.5980-0.5975. This area has shown strong interim support, but recent price actions are raising doubts about its stability. If sellers maintain pressure and break below this level along with the 61.8% Fibonacci retracement, it would likely lead to a decline toward 0.5935, with 0.5900 following closely. These numbers reflect the market’s reaction to moving below key technical points that previously served as balance zones.
The Broader Us Dollar Strength
Resistance is clearly visible around 0.6025. This level is not just a number; it corresponds to recent highs where sellers have consistently reentered. If buyers can push through this barrier, a quick jump to 0.6060 is possible, with more interest likely near 0.6100 and 0.6120. However, as long as the pair stays below 0.6025, the trend remains downward.
The heat map indicates that the US Dollar’s strength is widespread. Its strong performance against the Yen has been notable, but this resilience extends to other pairings. The Dollar’s firmness across various currencies suggests a reevaluation of interest expectations rather than being driven by specific country changes.
In addition, we’ve noticed reduced volatility among some commodity-linked currencies. External risks, like tariffs on EU and Mexican goods, could continue to affect market sentiment, making risk-sensitive currencies struggle. Traders involved in derivatives should be cautious and manage their exposure carefully, especially around identified breakout levels.
In the upcoming sessions, market participants should pay attention to any changes in tone from Federal Reserve officials. Even subtle comments can influence market pricing, especially when traders are more sensitive to a lack of dovishness than any hawkish moves. Moreover, reactions to economic data will be particularly significant, as every figure will be assessed in terms of ‘how long until easing?’
With the technical situation, hawkish re-evaluations, and negative risk sentiment aligning, conditions favor positions that align with current Dollar strength until we see a break in momentum. Not all support levels will hold when the fundamentals are supporting one side.
Create your live VT Markets account and start trading now.
China US Trade Recovery
Both China and the US are working to speed up the results from the London framework. There’s a strong push for cooperation in their trade relations.
It’s also recognized that tactics like extortion and coercion do not help. Instead, dialogue and collaboration are recommended for future trade.
Early Signs of Stability
In the first half of the year, China’s trade with the US has decreased significantly in yuan terms. Exports from China to the US fell by almost ten percent, and imports from the US declined by just under eight percent. Overall, the total trade volume dropped about nine percent compared to the same period last year. Recent comments suggest that commercial ties may be stabilizing.
Efforts to follow through on the London discussions indicate some level of policy coordination continues behind the scenes. Both countries have publicly supported stronger engagement and rejected the tougher, confrontational strategies of the past. Rather than using threats or retaliatory actions, there is a focus on calm discussions aimed at enhancing trade channels in a balanced manner.
When we consider the broader economic conditions and currency movements, several key points emerge. The renminbi is facing pressure, mainly due to ongoing capital outflows and differing interest rates compared to major trading partners. This creates real pricing impacts on yuan-based contracts, especially for shorter trade cycles.
In the coming two weeks, traders should pay attention to both bilateral flows and comments from monetary authorities. These could provide insights into potential changes in capital controls or interest rates. It’s wise to take a cautious approach to leveraged foreign exchange plays involving the renminbi, particularly when there are long positions in USD, unless there’s clear communication from central banks or improvements in trade balances.
Some may consider a relative-forward strategy, comparing volume declines with price stability metrics. Despite the overall contraction in numbers, the shift in tone from authorities, emphasizing steady cooperation, indicates that sudden interventions or unexpected tariff changes are unlikely in the short term.
Historically, volatility often follows diplomatic tensions. However, with both countries supporting ongoing engagement, short sellers betting on panic-driven market shifts may end up at risk. Contract structuring should focus on rollable, low-theta instruments linked closely to fixed trade route indices, rather than speculative bets on cross-currency movements.
Currently, trends in trade flows and a shared message suggest a pause on harsher tactics. Position entries should reflect this pace and aim at gradually increasing volumes rather than anticipating further disruptions.
Create your live VT Markets account and start trading now.
**Gold Prices and Market Dynamics**
Gold is a stable asset, often seen as a safe option during uncertain times. It is also viewed as a safeguard against inflation since it doesn’t rely on any government or issuer.
In 2022, central banks bought a record 1,136 tonnes of gold, with countries like China, India, and Turkey rapidly increasing their reserves.
Gold’s price often moves in the opposite direction of the US Dollar and Treasuries. When the Dollar is weak or during political instability, gold prices generally rise. Lower interest rates can also boost gold prices.
Remember, engaging in financial markets involves risks. Always conduct thorough research before investing. The information here is for your reference and is not financial advice.
**Recent Upticks and Analysis**
Gold prices have risen slightly to start the week. While this isn’t a major surge, it’s noteworthy given the usual factors that influence bullion in different directions. The price shift from 404.62 to 405.10 SAR per gram might seem small, but when you consider tola prices rising to 4,725.01 SAR, it reveals deeper insights into market feelings.
Prices in Saudi Arabia usually mirror global trends. While we convert USD to SAR for local pricing, actual transactions might vary due to timing and dealer costs. Nonetheless, the current steady prices indicate that outside influences, rather than local demand, are driving the market.
For those watching derivatives, especially options and futures, this recent rise requires careful adjustment. Gold is a sign of uncertainty. Even small gains usually reflect growing concerns—be it economic, monetary, or political. It’s not just about the Dollar; it’s what the Dollar represents.
The current atmosphere is one of unease and risk management. Inflation is still present in major markets, not at alarming levels, but consistently high enough to worry authorities. Gold often attracts investments when other options falter. This isn’t new, but when central banks in places like China, India, and Turkey increase their gold purchases, it shows a growing distrust in other assets.
The record purchase of 1,136 tonnes by central banks in 2022 didn’t happen by accident. These banks operate thoughtfully, often ahead of market trends. This buying behavior signals a strategic shift in reserve management that may stabilize prices over time.
**Geopolitical Tensions and Gold’s Role**
Geopolitical tensions have not eased much lately. While they may not make headlines daily, the tension remains. Gold typically rises when diplomatic efforts fail. Meanwhile, US Treasuries have shown fluctuations, making gold more appealing as a defensive asset.
We should closely examine implied volatility levels for both short-term and long-term contracts. Any gap between historical and implied volatility could create opportunities for protective actions or profit-taking. Keep an eye on futures prices; their structure and term spreads can indicate rising risk premiums or unexpected market shifts.
With recent fluctuations in rate expectations and assertive gold buying from non-Western central banks, we need to reassess quickly if yields, particularly US real rates, change. Lower real yields often cause gold prices to rise sharply. When this coincides with a weak Dollar, gold tends to perform best. Monitoring these correlations is crucial.
Current positioning also tells us a lot. Although speculative interest in gold isn’t overly heated, a gradual increase in positions calls for attention. The option skew is now leaning towards higher price protection, indicating hedging against upward price movements—which is subtle but often warranted.
In the coming weeks, we’ll focus on key economic events—especially inflation data, guidance from central banks, and overall reserve movements. These will clarify gold’s price direction and help us determine when and how to adjust our trades. Derivatives, especially with significant payoffs, work best when timed correctly.
Stay alert to market signals, avoid overcommitting to any direction, and be prepared to adapt your perspective—whether you’re viewing gold as a stable asset, a market signal, or a trading opportunity.
Create your live VT Markets account and start trading now.
Ethereum kicked off the week on the front foot, having soared past the $3,000 mark thanks to a surge in ETF inflows. But ahead lies a delicate balancing act, with inflation data and political developments in Washington poised to shape the near-term outlook.
At the heart of this rally is BlackRock’s iShares Ethereum Trust (ETHA), which recorded an all-time high of $300 million in inflows last Thursday, its most substantial single-day haul to date. This boosted ETHA’s assets under management to $5.6 billion, cementing its status as the leading spot Ethereum ETF in the United States. Across all Ethereum-linked ETFs, roughly $703 million was channelled in last week, their third-largest weekly intake since inception.
Momentum has been gathering for some time. The 30-day average trading volume for ETHA has climbed to 18.83 million shares, up from about 13 million in early June. Trading hit a fever pitch last Wednesday, with 43 million ETHA shares changing hands, the highest daily volume since launch. And this isn’t just short-term capital on the move. Since early June, ETHA has seen net inflows exceeding $1.2 billion, including $159 million on Tuesday alone, its biggest single-day tally since 11 June.
It was a big year for crypto, and not just in terms of returns. The SEC's approval of spot bitcoin and ethereum ETFs — in January and July respectively — ushered in a new era of cryptocurrency trading. https://t.co/HSX7Ce2x3Vpic.twitter.com/bOwJr3Rg2k
The options market is singing the same tune. Bullish positioning dominates, with call options heavily outweighing puts across several expiries. ETHA’s open interest has reached a one-year high, reflecting widespread expectations of continued gains. For options expiring 18 July, traders are clustering around the $22 strike (roughly $3,000 ETH), with noticeable interest building at $23 and $24, a signal that traders aren’t just expecting Ethereum to hold ground, but to push toward $3,200.
This optimism extends into later expiries. For 25 July, call options at $23 and $24 remain dominant, while lighter interest at $25 and $26 implies some traders are eyeing a move as high as $3,300. The same trend can be seen in the 1 and 8 August expiries, where calls outweigh puts right up to $26. With little downside protection evident, traders expect ETH to remain above $3,000, with room to climb further if momentum holds.
‘Crypto Week’ In Washington Poses Pivotal Test
Ethereum’s bullish run doesn’t exist in isolation. It comes during a crucial week in Washington, as US lawmakers embark on what’s been dubbed ‘Crypto Week’. The House is reviewing three landmark bills that could dramatically reshape the nation’s crypto regulatory framework.
Top of the list is the Digital Asset Market Clarity Act, which seeks to distinguish between securities and commodities. The bill would give the CFTC oversight of crypto markets and provide regulatory exemptions for mature decentralised networks, a long-standing request from the industry.
More immediately impactful is the GENIUS Act, designed to create a proper framework for stablecoins. The legislation, which already enjoys bipartisan backing and Senate approval, mandates full 1:1 reserve backing, licensing, and regular disclosures. It also brings stablecoin issuers under the Bank Secrecy Act. President Trump has signalled support, which could speed up passage. Stablecoins underpin crypto liquidity, and regulatory clarity here could pave the way for larger institutional flows into Ethereum and similar assets.
Meanwhile, the Anti-CBDC Surveillance State Act aims to prevent the Federal Reserve from launching a central bank digital currency without explicit Congressional consent. Although politically charged, the bill aligns with pro-crypto sentiment, advocating for open networks over centralised control.
Even if not all three bills pass this week, their progress is already influencing sentiment. The very act of bringing them to the table signals a step closer to regulatory clarity, and markets are responding.
Strong Momentum, But Not Without Risks
That said, caution is warranted. Analysts at Citi have reiterated that digital assets remain far from earning their place as conventional safe-haven investments like gold. Ethereum’s pace of ascent, though underpinned by strong inflows, could trigger a bout of profit-taking or exhaustion, especially among leveraged long holders or deep-in-the-money options traders.
At present, Ethereum’s upward move appears to be backed by real capital and shifting regulation. Retail and institutional players are responding accordingly. Provided ETF flows remain steady and legislative momentum continues, the recovery remains on solid footing. But as always in crypto, volatility is never far behind.
Market Movements Of The Week
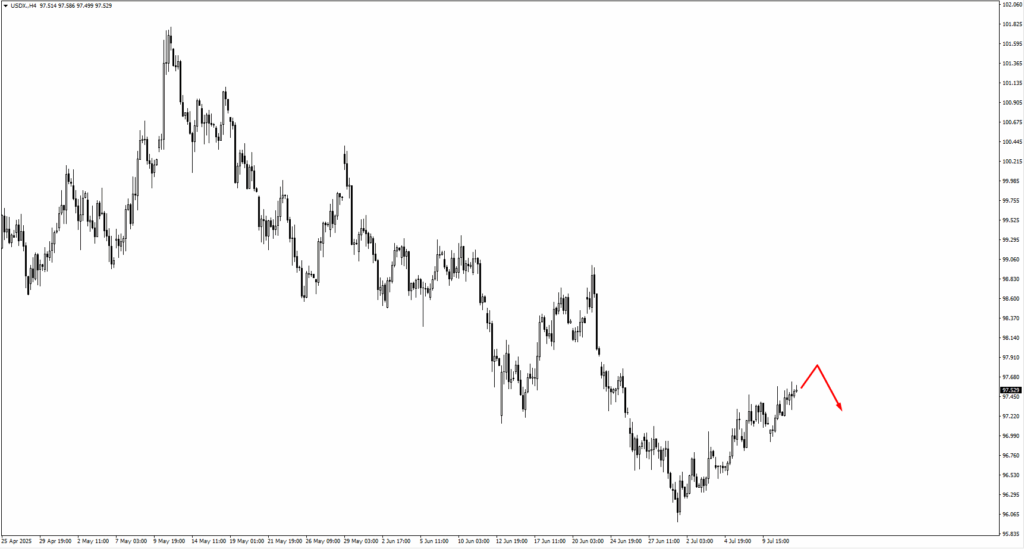
The US dollar index (USDX) is slowly grinding higher, but it’s approaching a key test. Price action near the 97.70 zone may act as a turning point. If USD strength pushes beyond that level, bears are eyeing the next resistance around 98.10. A breakout here could reshape short-term expectations for FX pairs, especially if Tuesday’s US CPI surprises to the upside.
EURUSD is drifting lower, with traders now watching for signs of bullish reversal at 1.1660 or 1.1605. These levels represent key structure zones, and a CPI beat could keep the euro on the defensive. However, any softness in inflation could ignite a retracement rally, particularly if European sentiment stabilises.
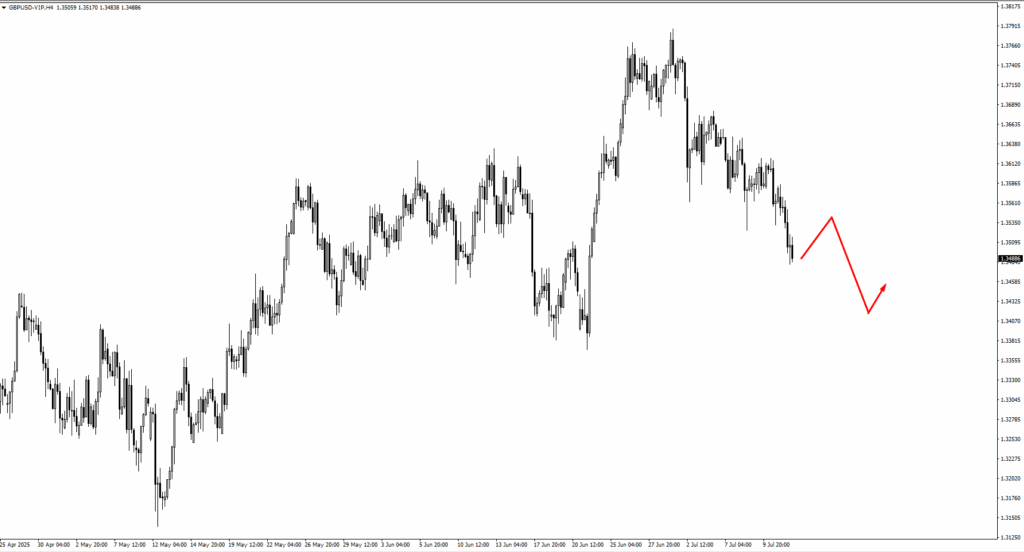
GBPUSD has entered a slower consolidation phase. With UK CPI due Wednesday, bulls are looking for a bounce near 1.3415. That zone could offer a tactical long setup if inflation surprises are mild. But if broader USD strength continues, any upside may remain capped under 1.3535–1.3570 resistance.
USDJPY has already rejected from the 147.75 zone and is now consolidating. If the pair breaks higher on fresh inflation momentum, 148.05 becomes the next upside magnet. However, traders should be cautious, since any rejection near these levels could signal a short-term top.
USDCHF continues to inch upward, heading toward 0.8050. With little data from Switzerland this week, USD direction will likely dictate where this pair goes next. Traders should watch closely how the price behaves once it reaches that resistance.
In the commodity currencies, AUDUSD is holding above its consolidation zone. If price remains stable around 0.6550, bulls may step in ahead of Thursday’s Australian jobs report. A move higher would put 0.6665 back on the radar. Similarly, NZDUSD has traded down from the 0.6050 level and may print a new swing low before finding support. Watch for base-building before considering long positions.
USDCAD is testing the 1.3715 resistance area. If price breaks through with conviction, especially post-CPI, it could quickly move to test the 1.37587 high. The tug-of-war between Canadian inflation and US macro signals will be central here.
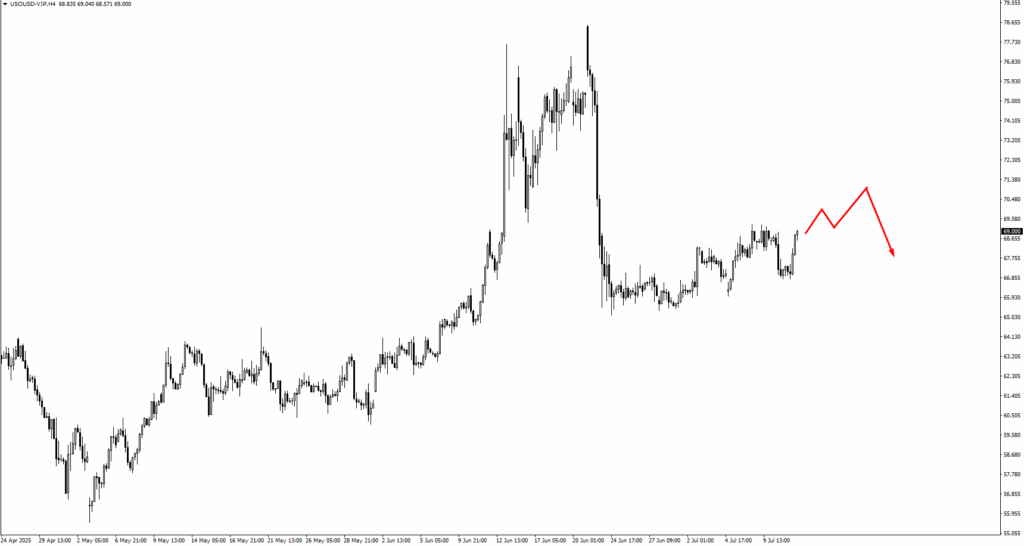
Commodities remain on a knife’s edge. USOIL has rallied slightly but faces resistance at 71.80 and 73.40. These zones are likely to draw selling interest unless supply-side headlines extend the bounce. On the downside, 63.35 and 61.00 remain key supports to watch for reversal setups.
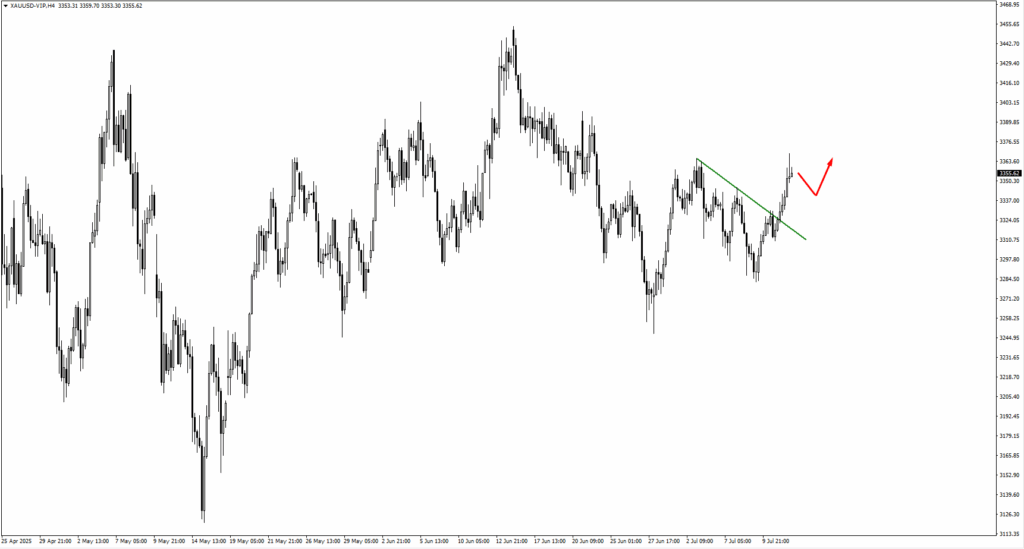
Gold has finally broken above its trendline, suggesting bullish momentum is beginning to return. If prices consolidate cleanly above the breakout zone, bulls will likely aim for 3340 next. However, any renewed dollar strength could limit upside, especially as traders reassess inflation and rate cut timelines in the US.
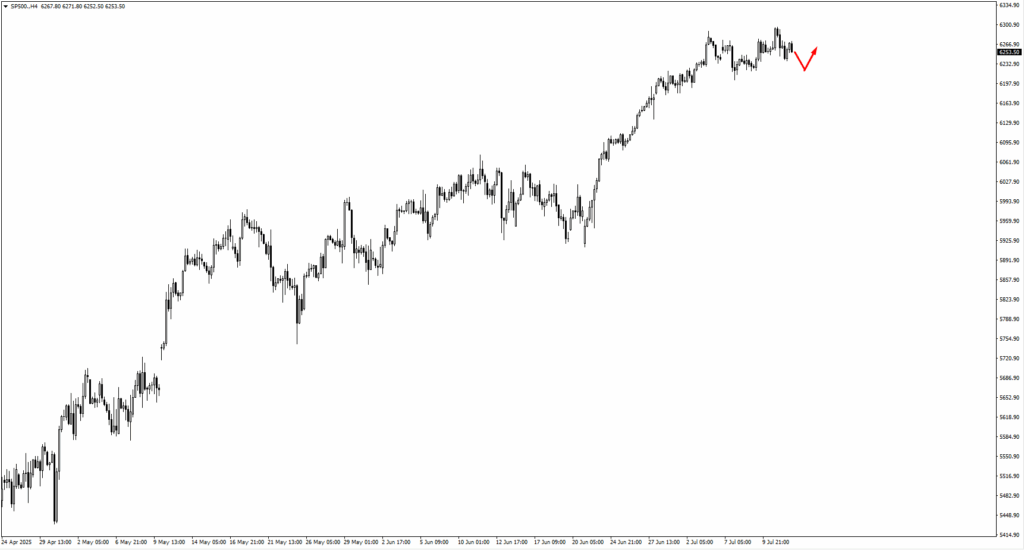
The SP500 is walking a tightrope. Trump’s renewed tariff threats against Mexico and Europe are clouding what was a strong trend higher. Price has support around 6230, with deeper downside capped at 6170. If bulls recover control, 6400 and 6630 are the next upside levels to monitor.
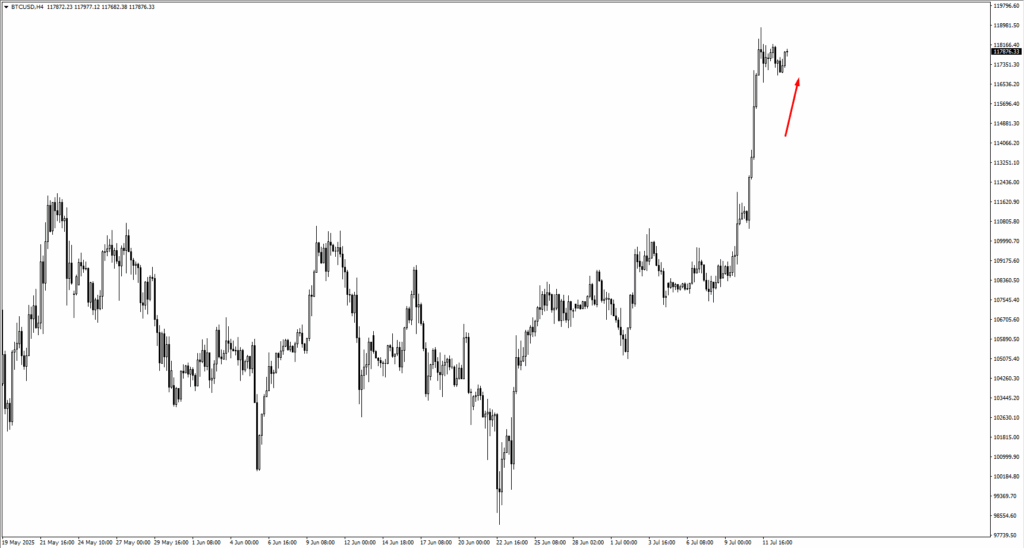
Bitcoin is back on the rise after a shallow consolidation. Price is approaching the 122,100 to 124,720 zone, a key area where profit-taking could occur. Still, momentum remains constructive, and the broader crypto environment continues to benefit from ETF flows and the regulatory optimism spilling over from Ethereum.
Natural Gas (NG) is still dancing around the 3.35 zone. If it pushes higher, 3.40 is the next resistance level to watch. Volatility remains high here as seasonal shifts and supply dynamics continue to affect trader sentiment.
This week’s price action is less about chasing breakouts and more about timing entries at known technical zones. Many major pairs are sitting near decision points. Patience and precision will be key as traders wait for the next macro catalyst to tip the scales.
Key Events of the Week
After a relatively quiet start to the month, this week swings the spotlight back onto macro data. Traders won’t have to guess where market sentiment might shift next with the calendar loaded with reports that could redefine interest rate expectations across major currencies.
All eyes are first on Tuesday, 15 July, where both Canada and the United States drop their latest inflation readings. For Canada, the CPI y/y is forecast at 3.60%, down from the previous 3.85%. A softer print could reignite dovish bets for the Bank of Canada, particularly if USD strength persists. However, the crosscurrents from ongoing US tariff issues may muddy CAD’s reaction, especially if broader risk appetite begins to falter.
The US print could steal the show. Headline CPI y/y is forecast to rise to 2.60%, up from 2.40%. This is not the direction markets nor the Trump administration want to see. A hotter inflation number here could stall any discussion of near-term rate cuts from the Fed. The result? A stronger dollar and potentially sharp downside in risk-sensitive FX pairs like AUDUSD and NZDUSD. Even equities may pause if markets begin re-pricing the Fed’s glidepath.
On Wednesday, 16 July, the UK delivers its CPI data, forecast flat at 3.40% y/y. With no change expected, the report may take a back seat unless there’s a surprise. But traders should still watch price action around this release, as GBPUSD sits near key resistance and could break either way on deviation.
Thursday, 17 July, kicks off with Australia’s Employment Change report, where the forecast stands at +21.0K, a rebound from last month’s -2.5K. If AUDUSD is truly building a base as recent price action suggests, this report could provide the fuel for a breakout toward 0.6665. Strong numbers here would also help anchor RBA rate expectations and calm recent concerns about domestic demand.
Later that day, the US Retail Sales m/m lands, with a forecast of 0.20%, following last month’s -0.90%. A bounce here would paint a picture of improving consumer strength, giving the Fed even more reason to delay any easing cycle. Traders should watch how the USD behaves into this print. If the number beats expectations, we could see US yields firm up again, putting pressure on gold, AUD, and equities.
In June 2025, China’s exports measured in yuan increased by 7.2% compared to last year, up from 6.3%. Imports also grew, rising by 2.3% year-on-year, recovering from a previous decline of 2.1%.
The trade balance for June was 743.5 billion yuan, the same as the previous month. From January to June, exports in yuan consistently grew by 7.2% on a year-over-year basis.
So far, this article provides a clear picture of China’s external trade momentum in the first half of 2025. The steady export growth of 7.2% is a notable improvement, especially with rising overseas demand and improved price competitiveness. On the other hand, import figures show a modest recovery—moving from a decrease in May to an increase in June—indicating stronger domestic spending or targeted inventory restocking by manufacturers.
Li’s data reflects that China’s trade activity is stable, though it’s not accelerating broadly. The unchanged trade surplus of 743.5 billion yuan for June suggests that demand and supply are relatively balanced in external accounts, at least for now.
For those analyzing market trends through contracts and price variations, the steady growth in exports is significant. This consistency over six months could lead to expectations of sustained foreign currency inflows. For those holding hedged positions tied to yuan movements or Asian manufacturing, this stability offers reassurance and indicates a lower risk of major export disruptions in the third quarter.
Zhao’s comments hinted at a potential stop-start recovery for imports, but June’s improvements seem to counter that view. If factories are importing more intermediate goods, it supports higher utilization rates in the future. This could benefit futures linked to iron ore, industrial metals, or soft commodities, especially with China as a primary importer, providing opportunities for long strategies as long as external factors don’t undermine them.
From our perspective, while a bounce back in domestic demand might not be evident yet, the situation likely stabilized in the second quarter. This provides more confidence in input pricing. Seasonal factors will soon decline, but the consistency seen in June may lead to less volatility, particularly in producer hedging against margins or fluctuations.
There’s also a currency aspect. Steady foreign receipts for exporters boost conversions to yuan, especially if the currency basket remains stable or experiences slight downward pressure from the dollar. For those managing exposure in offshore renminbi contracts, a strategy leaning towards neutrality or yield-cushioned carries makes sense until new data changes the landscape. Current liquidity levels have not tightened significantly, reducing the risk of sudden increases in margin requirements for long yuan trades.
Looking ahead, the organized pace of trade data, both exports and imports, supports bracketed positions. High reactions to single-month data may not be reasonable unless accompanied by unexpected movements in policy or declines in external demand. It’s essential to closely monitor volumes for confirmation. Those using spreads to assess market sentiment might focus on ratios that show relative resilience, especially if major US or European data triggers a quick shift in risk attitude.
In conclusion, the stable trade gap suggests a steady contribution of trade to the currency’s overall value. If monetary or fiscal policies align with these flows, positions related to shifts in interest rates should be balanced by considerations of commodity prices as they continue to affect imports in the third quarter.
…
China’s exports from January to June increased by 7.2% compared to last year. However, imports dropped by 2.7% during the same time.
The General Administration of Customs reports that total trade value for the first half of 2025 exceeded 20 trillion yuan, marking a 2.9% rise compared to the same period last year.
Trade Trends and Implications
These numbers indicate stronger foreign demand for Chinese products, while imports are struggling. The 7.2% increase in exports from January to June shows that Chinese manufacturing supply chains are stable and competitive, especially in electronics, consumer goods, and machinery. The 2.7% decrease in imports points to weak domestic demand, likely due to low consumption or delays in manufacturing supplies.
The total trade volume exceeded 20 trillion yuan for the first half of the year, reflecting a 2.9% growth compared to last year. Though the trade surplus is increasing, it does so unevenly, benefiting from strong exports rather than balanced trade. This difference reveals where growth is happening and where there are still concerns.
These changes affect how we predict price volatility in commodities and specific sectors. Industries focused on exports may enjoy favorable conditions in the short term. However, the drop in imports—especially for raw materials—calls for a reevaluation of hedging strategies, particularly regarding manufacturing output or domestic consumption.
Impact on Trade and Finance
Strong external demand and softening domestic intake may further shift the yield curve for contracts related to ocean freight, container shipping, and materials like copper or iron. We should remain vigilant for unexpected changes in trade policies or shipping costs, as these can lag behind shifts in trade volume.
As the yuan experiences pressure from the trade surplus and differing global interest rate expectations, short-term strategies involving currency pairs may require tighter controls or frequent adjustments. Liu’s data clearly shows that exports are rising while imports are lagging. Traders linked to East Asian production trends and consumer demand must adjust their strategies accordingly.
Historical trends during similar trade environments suggest a widening gap between the prices of industrial inputs and finished goods. This can increase basis risk and lead to discrepancies between hedging payouts and expectations, especially close to settlement.
It’s important to look beyond the headline figures and examine the underlying details. For example, electronic components and crude oil will have different impacts on transport and input costs. What seems like simple growth may hide deeper instabilities in certain categories.
Moving forward, our strategy should focus on contracts that align clearly with export-oriented sectors, while being more cautious about assets tied to domestic consumption or dependent on high-volume imports.
We view Chen’s figures not just as standalone numbers but as indicators of a broader shift between external and domestic factors. Systems that rely on stable trade flows may become less reliable under current conditions.
Create your live VT Markets account and start trading now.
Australian mining company BHP has signed a memorandum of understanding with Chinese battery manufacturer CATL. This partnership aims to explore battery technology for mining equipment and trains, with a focus on fast-charging infrastructure.
BHP and CATL will also look into energy storage systems and battery recycling solutions to support BHP’s mining operations.
This agreement shows a commitment to modernizing mining with battery technology in heavy machinery and transport. The companies plan to examine rapid recharging systems, implying possible upgrades in mining site infrastructure. This may impact logistics and planning regarding routes and resource allocation.
They also aim to explore energy storage and recycling, which suggests a strategy to protect mining activities from energy price changes and supply chain issues. By integrating storage and recycling, energy costs can become more predictable, especially where diesel or grid reliance has been a major expense.
What stands out is the potential to reduce costs and gain better control over energy use. These advancements might ease pressure on energy-related expenses, but the details will depend on how quickly the technology is implemented and if this leads to a shift in capital spending.
In the short term, this partnership could lead to a reevaluation of medium-term forecasts related to industrial metals demand. If battery integration reduces inefficiencies, mining could become more cost-effective and efficient than previously expected. Thus, it’s worth revisiting assumptions based on traditional diesel usage and typical delays in transportation cycles.
Demand for materials and power doesn’t change overnight, but the partnership indicates a clear commercial aim. It’s wise to monitor quarterly reports from both companies for signs of progress, especially regarding investments in battery plants or pilot projects at mining sites.
For weekly assessments, keep an eye on volatility in mining stocks or energy cost hedges. If the execution is faster than anticipated—sometimes it is when both parties benefit—short-term disruptions in battery metal supply or usage could occur.
Mining cost structures usually change slowly, but if battery-powered equipment reduces downtime, some productivity models may need updating. Tracking small improvements in transportation costs or route efficiency may provide consistent benefits that influence larger market trends.
The mention of recycling suggests an interest in closed-loop systems for materials. If CATL develops technology for such systems in high-usage areas, refiners and processors could seek early access. Pricing in these markets can fluctuate with small changes in supply or input length, so teams monitoring battery metal spreads should be prepared to make adjustments.
While volatility spikes don’t often start with memorandums, deals like this can create subtle expectations. It’s important to set alerts not just for major partnerships but also for updates on utility and usage from both companies. Once these plans move to the implementation phase, forecasts for throughput, energy use, or mineral quantities could start to shift.
Catalysts may not happen right away, but if energy cost dependencies begin to change, even locally, pricing models typically adjust quickly. Pay attention to the numbers rather than just the headlines; that’s where the opportunities may arise.
Trump has announced a 30% tariff on the European Union, effective August 1. Germany’s Merz plans to collaborate with Macron and von der Leyen to address trade issues before this takes effect. The EU has decided to hold off on any retaliatory actions to allow for further discussions.
In the aftermath, the USD initially gained strength but soon dropped again. US equity index futures opened lower, with no signs of recovery. The EUR has risen, reaching around 1.1695 against the USD, while USD/JPY has fallen to about 147.00. Both the AUD and NZD are also declining.
Trade Data Expectations
Aside from these developments, there’s no major news. China’s trade data for June is still awaited and is scheduled for release on July 14.
This situation showcases how news-driven trading can lead to quick changes in currency and equity markets. The tariff announcement put immediate upward pressure on the US dollar, which typically happens during international trade tensions. However, the fact that this initial strength didn’t last indicates that traders are uncertain if this move alone justifies a significant shift in US assets.
Merz’s prompt collaboration with French and EU leaders aims to maintain internal unity before the August deadline. Timing is crucial here: markets rarely account for long-term risks until they have to. The EU’s choice to delay retaliatory actions isn’t a lack of intention but a strategic decision—a pause that gives market participants some breathing space. However, this breathing room can come with a cost, allowing currency markets to react quickly and potentially shift expectations permanently.
This explains why EUR/USD climbed despite broader risk-off signals. It’s not often we see such a clear example of relative policy actions driving gains. The decline in Asia-linked currencies like the AUD and NZD also highlights the situation. It’s no surprise these pairs were affected—both are closely tied to global trade, and speculative positions were already heavily weighted long.
Volatility Adjustments And Strategic Anticipations
We have adjusted our short-term volatility expectations for dollar-yen and euro-dollar, leading to wider pricing spreads on all contracts expiring after July 15. The JPY’s decline against the dollar to around 147.00 may lead to revisiting April’s intervention zone. While we don’t see an urgent need for a directional bias yet, we are preparing for possible policy responses from Tokyo, depending on this month’s inflation data.
US equity futures drifting lower fits the trend. The absence of a rebound shows that no one is expecting a supportive policy change from Washington soon. Technical indicators are slowly degrading, making any future price adjustments more costly week by week. In such conditions, responsiveness is more valuable than simply having a directional bias.
Looking ahead to July 14, the upcoming Chinese trade figures could reveal more lingering supply-chain issues. We have observed a decline in export figures since April. If this trend continues, it might intensify existing short positions in Asia FX and encourage defensive moves into the euro and, to a lesser degree, sterling.
We have reduced our exposure to beta-sensitive currency pairs and widened our hedging thresholds on volatility strategies extending beyond July. Pricing isn’t broken, but spreads are tighter than what might be expected given the realized risks. If you’re modeling decay curves, apply a longer lag for political risks, especially since the EU and US are on completely different response timelines.
Create your live VT Markets account and start trading now.
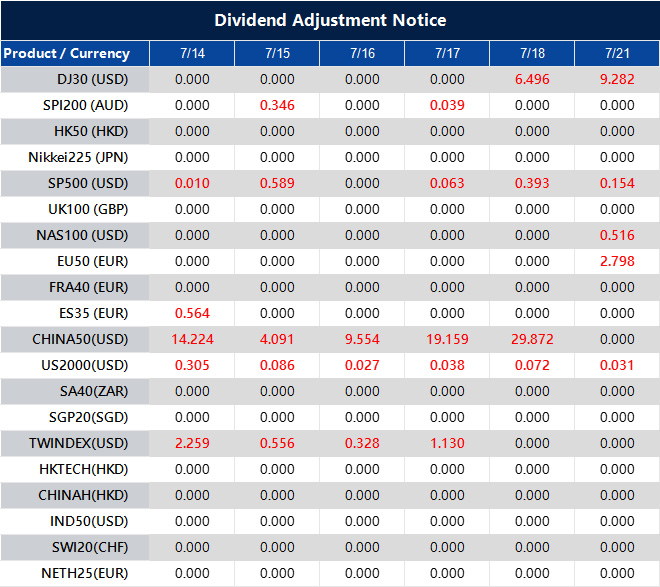
Please note that the dividends of the following products will be adjusted accordingly. Index dividends will be executed separately through a balance statement directly to your trading account, and the comment will be in the following format “Div & Product Name & Net Volume”.
Please refer to the table below for more details:
The above data is for reference only, please refer to the MT4/MT5 software for specific data.
If you’d like more information, please don’t hesitate to contact [email protected].
Oil prices in early Asian trading are rising due to fresh worries about possible supply disruptions. These disruptions are linked to potential U.S. sanctions on Russia.
Analysts at ANZ Research note that U.S. President Trump has recently criticized Russian President Vladimir Putin more openly. Trump is frustrated with the slow progress in resolving the conflict in Ukraine. He has been vocal about his discontent with Putin and is expected to make an announcement about Russia later this week. This information comes from the Wall Street Journal citing ANZ.
Brent crude oil prices have stayed stable despite these developments. The market is closely watching for any changes.
This situation shows how energy markets are responding to geopolitical tensions, focusing on the U.S. government’s actions and comments towards Russia. There is an increasing expectation that more restrictions could be put in place, which traders know may affect Russian oil supply and production. If global energy output is limited, prices are likely to remain high or rise, especially for benchmarks like Brent crude.
Market participants are ready for a shift in supply and demand dynamics. This is not due to a sudden increase in demand but rather because supply sources may face new challenges. ANZ points out that Washington’s tougher stance suggests upcoming policies may be less lenient towards Moscow. Even though specific details have not been provided, the anticipation alone is influencing pricing expectations.
In the coming days, we should expect price sensitivity to public statements. If Washington’s rhetoric becomes more aggressive, or if actual policy changes occur, quick reactions in the futures market are likely. Traders who don’t consider these external factors risk poor positioning, particularly if volatility increases.
It’s important to note how responsive commodity markets are to political signals. Even without any formal changes, just the hint of a shift can stabilize prices that might otherwise decline. This is crucial when physical demand indicators are unclear in the short term.
The best strategy now is to keep a close eye on scheduled policy announcements. Focus on confirmed news and how it impacts physical supplies, especially tanker tracking data and shipping routes for Russian crude. Instead of general speculation, we should prioritize measurable impacts on the supply chain, as these factors will directly affect contracts.
We are seeing more sudden market reactions to news. This urgency requires tighter management of intraday risk profiles, using tighter stops and more responsive hedging. Price movements at the short end of the curve may exceed current implied volatility, which can strain directional exposures unless adjustments are actively made. Medium-term positions are particularly vulnerable unless pricing includes an extra premium for disruption risk.
While the broader trend is driven by political concerns, the real impact will be seen in spread behaviors and arbitrage opportunities when clarity replaces speculation. Given this, we are moving away from outright directional bets and focusing more on calendar spreads and crack margins, where mispricing often arises during geopolitical turmoil. There is potential for inefficiencies to reveal themselves before they correct.
Now is not the time for sweeping conclusions. We are in a pressure window characterized not by strong demand, but by the supply’s ability to adjust quickly under stress. We monitor that readiness, recognize where market tightness develops, and act when spreads or curve structures display misalignments that can be exploited with proper risk management.