WTI trades near $63, easing to $62.80 as cautious traders await further geopolitical developments in Asia
WTI traded near $62.80 a barrel during Asian hours on Monday. It opened above the prior close, then slipped slightly. US markets were closed for Presidents’ Day. Trading in Asia was also slow as China, South Korea, and Taiwan observed Lunar New Year holidays.
A second round of US-Iran talks is set for Tuesday in Geneva. Tehran has signaled it may offer nuclear concessions if the US addresses sanctions. The US has warned it could strike if talks fail and has increased its military presence in the region.
Dividend Adjustment Notice – Feb 16 ,2026
Dear Client,
Please note that the dividends of the following products will be adjusted accordingly. Index dividends will be executed separately through a balance statement directly to your trading account, and the comment will be in the following format “Div & Product Name & Net Volume”.
Please refer to the table below for more details:
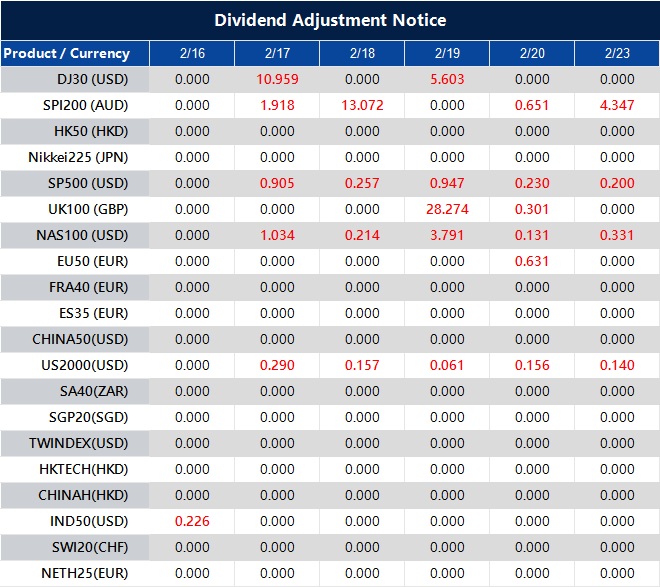
The above data is for reference only, please refer to the MT4/MT5 software for specific data.
If you’d like more information, please don’t hesitate to contact [email protected].
DBS’s Philip Wee cuts dollar forecast against major and Asian peers amid Fed uncertainty and political risks
DBS Group Research cut its US Dollar forecasts against most major and Asian currencies. It pointed to rising uncertainty around Federal Reserve leadership and independence, ongoing de-dollarisation, and US political risks ahead of the November midterm elections.
The note said the Dollar is getting less support from interest rate gaps and from the US economy outperforming other countries. It added that institutional credibility and politics are now driving currency moves.
DBS expects two Federal Reserve rate cuts in the second half of 2026. It also expects de-dollarisation to continue.
The report was attributed to DBS Group Research’s Philip Wee. FXStreet said the item was produced using an AI tool and reviewed by an editor, and that its Insights Team selects market observations and adds analysis.
The dollar is no longer being held up by high interest rates or a uniquely strong US economy. Instead, the market is focusing on the credibility of US institutions and on political risk. This shift suggests positioning for possible dollar weakness in the coming weeks.
Recent data has strengthened the view that the Fed could cut rates twice in the second half of 2026, after January inflation cooled to 2.8%. For traders, this makes strategies like buying put options on the U.S. Dollar Index (DXY) more appealing. A move down toward 100 on the index now looks more realistic.
As the November midterm elections get closer, political noise and uncertainty around government spending may rise. Early polling points to a tight race for Congress, which often increases market volatility. Strategies such as buying option straddles on major pairs like EUR/USD could benefit from large moves in either direction.
The gradual shift away from the dollar is another factor. Central bank reserve data for the end of 2025 showed the dollar’s share of global reserves falling to 58.1%. This long-term trend supports holding assets that tend to do well when the dollar weakens. That includes being long other currencies such as the Swiss franc, or using futures to gain exposure to gold.
The debt-ceiling standoff in 2023 showed how political gridlock can limit dollar strength. Today’s setup feels similar. That suggests any dollar rallies may be brief and could offer chances to build short positions. It also fits the view that the period of US exceptionalism may be pausing.
India’s wholesale inflation rose to 1.81% in January, above forecasts of 1.25% and market expectations
India’s wholesale price inflation (WPI) was 1.81% in January, above the expected 1.25%.
The latest data shows WPI inflation rose more than forecast. This suggests stronger price pressures at the wholesale level in January.
Wholesale Inflation Upside Surprise
January WPI inflation came in at 1.81%, well above our 1.25% estimate. This points to price pressures building faster than expected. Alongside January CPI, which stayed firm at 5.2%, this makes the Reserve Bank of India’s path to rate cuts more complicated. We expect markets to scale back expectations for a near-term RBI rate cut. Keep an eye on the OIS (Overnight Indexed Swap) market, where rates may edge higher in the coming weeks. The RBI acted strongly to bring inflation down in 2024, and this new data could push it to stay cautious. For equity traders, the inflation surprise may weigh on the Nifty 50, which has been trading near record highs. Buying put options on the index could help protect against a pullback, especially with the India VIX around 14, which keeps options relatively cheap. Rate-sensitive sectors such as financials and autos may face the most pressure. In FX, the outlook for USD/INR is less clear. Higher inflation is usually a headwind for a currency, but the possibility of a more hawkish RBI could support the rupee. With mixed signals, we expect higher volatility. Long-volatility setups, such as straddles on USD/INR futures, may look attractive.Sector Positioning And Relative Trades
This print also changes how we think about sector positioning. Commodity-linked companies may outperform because they can benefit from higher producer prices. One approach is to go long metal index futures while also considering short positions in consumer discretionary stocks, which may be hit by weaker purchasing power and higher borrowing costs. Create your live VT Markets account and start trading now.Nguyen says the ECB expanded EUREP access for non-euro central banks, boosting global euro liquidity and strengthening the euro’s status
Commerzbank analyst Thu Lan Nguyen says the ECB has expanded its EUREP repo facility. This lets all eligible non-euro central banks access euro liquidity, unless regulators exclude them. The goal is to make euros available outside the euro area, especially when markets are disrupted.
This change follows EU efforts to strengthen the euro’s role in global finance. The ECB’s approach is simple: widen access so euros are available when needed.
Euro Liquidity Lines Still Lag The Dollar
Nguyen says demand for the ECB’s euro liquidity lines has been low compared with the US Federal Reserve’s arrangements. During the coronavirus pandemic in 2020, outstanding drawings on the Fed’s US dollar lines to foreign central banks peaked around USD 450 billion. The Federal Reserve also has permanent swap lines with five major central banks: the ECB, Bank of Japan, Bank of England, Swiss National Bank, and Bank of Canada. This comparison highlights a key point: in times of global stress, demand clusters around US dollars, not euros. The ECB’s wider goal is to increase the use of euros for cross-border payments, including transactions between third countries. The ECB wants to make the euro more attractive internationally by making euro liquidity easier to access. But when markets are in turmoil, demand still concentrates on the US dollar. This reality continues to limit how far the euro can strengthen against the dollar.Implications For Eurusd Positioning
Recent data supports this view. The January 2026 SWIFT report showed the dollar holding nearly 47% of global payments, while the euro stayed near 23%. The ECB’s own data for Q4 2025 also showed that usage of the expanded EUREP facility was under €15 billion. That is small compared with the liquidity the Fed provides during periods of stress. From the perspective of 2025, this pattern is well-known. In 2020, dollar liquidity lines surged to about $450 billion as institutions raced to secure dollar funding. Similar flight-to-safety behavior appeared again during the 2022 energy crisis. Both episodes reinforced the dollar’s role as the world’s main reserve and crisis currency. For derivatives traders, positioning in the coming weeks should reflect this. Any rise in global risk stress—driven by geopolitics or financial instability—can be treated as a bearish signal for EUR/USD. In that case, buying EUR/USD put options or selling futures can be practical ways to position for a stronger dollar. This is also a volatility story, not only a direction call. Because dollar demand often jumps quickly in a crisis, a useful approach can be to own options that benefit from a volatility spike. That can help capture a sharp drop in EUR/USD before broader market fear becomes obvious. Create your live VT Markets account and start trading now.AUD/USD rises 0.17% to 0.7085 in early European trade as the higher 20-day EMA signals potential gains
AUD/USD rose 0.17% to around 0.7085 early Monday in the European session, as the Australian Dollar outperformed other major currencies. Markets were waiting for the Reserve Bank of Australia (RBA) minutes from its February meeting, due Tuesday.
At that meeting, the RBA raised its Official Cash Rate by 25 basis points to 3.85%. It also left the door open to more rate hikes if inflation risks stayed high.
The US Dollar was mostly steady. Expectations for a more cautious Federal Reserve in March and April remained in place. The US Dollar Index (DXY) ticked up to about 96.95.
US inflation continued to cool. Headline Consumer Price Index inflation fell to 2.4% year-on-year in January, down from 2.7% in December.
On the daily chart, AUD/USD held near 0.7085, while the 20-day exponential moving average (EMA) rose to 0.6982. The RSI was 66, showing bullish momentum without signaling overbought conditions.
A rising trendline from 0.6669 supported the pair near 0.6997. A break below that line could shift focus back to the 20-day EMA as the next support level.
We remember the optimism in early 2025, when the pair pushed toward 0.7100. Back then, the RBA had just lifted its cash rate to 3.85% and sounded open to more tightening. That view was helped by falling US inflation, which dropped to 2.4% year-on-year and hinted at a less aggressive Fed.
Since then, the picture has flipped, creating a different setup for traders. The RBA has softened its tone as domestic demand slowed. The cash rate is now 4.10% after a period of holding steady. Meanwhile, US inflation stayed higher than expected last year, remaining above 3%. That forced the Fed to keep its “higher for longer” stance.
This policy gap has pulled AUD/USD down to around 0.6550, well below the bullish trend seen in early 2025. Old support near 0.7000 is now key resistance. Over the next few weeks, traders may want to focus on range-trading strategies or position for more downside.
One approach is to buy put options to hedge against a further decline, especially with major US data releases coming up. Another is to sell out-of-the-money call spreads to collect premium, based on the view that the pair may struggle to retake its 2025 highs. Central bank messaging remains crucial, as any surprise shift could quickly change the outlook.
AUD/JPY climbs above 108.50 as weak Japan Q4 GDP lowers BoJ rate-hike expectations and pressures the yen
AUD/JPY climbed back above the mid-108.00s in Asian trading on Monday. This ended a four-day decline after the pair hit a nearly two-week low on Friday. The rebound followed weaker Japanese data, which pressured the Yen.
Japan’s Cabinet Office reported that GDP rose 0.1% in Q4 2025, after a 0.7% drop in the prior quarter. The figure missed forecasts and lowered expectations for an early Bank of Japan rate hike. That, in turn, weakened the JPY.
The Australian Dollar stayed supported after the Reserve Bank of Australia kept a hawkish tone. The RBA Governor said rates could rise again if inflation becomes entrenched. An RBA official added that inflation is likely to stay above the 2%–3% target for some time, and that the labour market has stabilised.
Hopes for more Chinese fiscal and monetary support also lifted demand for the AUD. However, gains in AUD/JPY may be limited by talk of possible Japanese action to curb JPY weakness, and by expectations for a Bank of Japan rate hike later this year.
We see a clear policy divide between Australia and Japan. That makes AUD/JPY attractive. Japan’s weak 0.1% GDP growth in Q4 2025 has pushed back expectations for any near-term BOJ hike. This makes holding the higher-yielding Aussie versus the Yen more appealing.
The RBA is also keeping a firm stance. Q4 inflation last year came in at 3.8%, still well above the target band. This supports the Aussie. For traders, it strengthens the case for buying AUD/JPY call options to benefit from a potential rise, while limiting downside risk.
Japan’s economy is soft, but core inflation is still 2.5%. That keeps the chance of a BOJ hike later this year alive. At the same time, hopes for Chinese support—especially after China’s central bank cut a key lending rate last month—are giving the Australian dollar another boost. Overall, this backdrop points to further gains, though the path may be choppy.
We also need to watch for possible intervention from Japanese authorities to support the Yen. They used this approach in 2022 when USD/JPY broke key levels. With AUD/JPY now above 108.00, the pair is moving into a zone that may worry officials. Levels near 110 could trigger a response. For that reason, using options to define risk, or placing tight stop-losses on futures positions, looks prudent in the weeks ahead.
Gold prices in Saudi Arabia fell, reflecting a decline in the metal’s value, FXStreet data shows.
Gold prices in Saudi Arabia fell on Monday, according to FXStreet data. Gold was priced at SAR 600.09 per gram, down from SAR 606.75 on Friday.
Gold also dropped to SAR 6,999.29 per tola, from SAR 7,077.07 per tola on Friday. Other quoted prices were SAR 6,000.87 for 10 grams and SAR 18,664.83 per troy ounce.
Saudi Gold Price Reference Notes
FXStreet calculates Saudi gold prices by converting global prices into SAR using the USD/SAR exchange rate and local weight units. Prices are updated daily at the time of publication and are for reference only, as local rates may differ slightly. Gold is used as a store of value and as a way to exchange money. People often buy it during market stress. It is also used to protect against inflation and a weaker currency. Central banks hold the most gold as part of their reserves. They use it to diversify and reduce risk. In 2022, they added 1,136 tonnes (about $70 billion), the highest yearly total on record. China, India, and Turkey led much of that buying. Gold often moves in the opposite direction to the US Dollar and US Treasuries. It can also move against risk assets like stocks. Prices can change due to geopolitical events, recession concerns, interest rates, and shifts in the Dollar.Macro Drivers For Traders
Looking back at last year, we saw small dips, like in early 2025 when gold briefly fell to around SAR 600 per gram. These moves did not last long. For traders today, the bigger issue is the wider economic backdrop, not small day-to-day changes from a year ago. Interest rates matter most because gold does not pay interest. Inflation has cooled to 2.5% in the latest CPI report. Futures markets are now pricing in a better than 70% chance of a US rate cut by summer. If rates fall, gold can look more attractive than interest-paying assets. This view also shows up in currency markets, which strongly affect gold. The US Dollar Index (DXY) often moves opposite to gold and has already fallen about 3% since the start of the year. A weaker dollar makes gold cheaper for buyers using other currencies, which can increase demand. Central bank buying still provides strong support for prices. Following the trend from 2022 and 2023, central banks around the world added more than 1,037 tonnes to their reserves in 2025. This points to an ongoing shift toward gold during periods of geopolitical uncertainty. Steady buying like this can help put a floor under the market. For derivatives traders, this backdrop may favor strategies that benefit from rising prices. Buying call options can capture upside while keeping risk defined, especially as volatility increases. Another approach is selling cash-secured puts during pullbacks to earn income, with the goal of buying gold at a lower price if the puts are assigned. Create your live VT Markets account and start trading now.GBP/USD pulled back from 1.3700, but buyers stayed active as it traded quietly just below 1.3650
GBP/USD began the week in Asia trading in a tight range just below the mid-1.3600s. Trading was quiet as markets waited for key UK and US data.
The UK jobs report is due on Tuesday, followed by CPI inflation on Wednesday. Markets are pricing in a 25-basis-point Bank of England rate cut in March, and these releases could shift that view.
Key Data In Focus
In the US, the Federal Open Market Committee minutes are due on Wednesday. Traders will look for clues about the Federal Reserve’s rate-cut path, which could move the US Dollar and GBP/USD. Last week, GBP/USD bounced from 10-day lows at 1.3509 and rose early in the week. It later faced selling near 1.3700, with a five-day high around 1.3710. The rise came as the US Dollar weakened, even after a stronger-than-expected January Nonfarm Payrolls report. The Dollar also fell as USD/JPY dropped, with the Japanese Yen gaining after Prime Minister Sanae Takaichi’s snap election win and talk of possible FX intervention. GBP/USD is now moving sideways in a narrow band around 1.2750 at the start of the week. This range trading signals uncertainty ahead of major UK and US releases. Traders should stay cautious, as a long consolidation can lead to a sharp breakout.Risk Management And Strategy
The focus is on Tuesday’s UK jobs report and Wednesday’s CPI data. UK inflation recently eased to 2.9% in January 2026, and markets now price a 45% chance of a BoE rate cut in May. That makes this week’s data especially important. The uncertainty is also lifting short-term implied volatility, which may make options strategies like straddles attractive for traders expecting a large move in either direction. In the US, Wednesday’s FOMC minutes will be studied for signals on the Fed’s rate-cut timing. A stronger January 2026 jobs report, showing 215,000 jobs added, has reduced expectations of an early cut and helped support the US Dollar. If the minutes sound hawkish, GBP/USD gains may be limited, and resistance near 1.2800 could hold. This setup is similar to early 2025, when the pair struggled to break above resistance at 1.3700. At that time, the market was also split between BoE cut expectations and uncertainty about Fed policy. That consolidation later broke lower after key data was released. With event risk elevated, traders may want to use derivatives to control risk. Put options can hedge long positions if UK inflation prints below expectations. If you expect a bullish breakout on strong UK data, a bull call spread can give upside exposure while limiting the premium paid. Create your live VT Markets account and start trading now.FXStreet data shows gold prices in the Philippines fell today, lowering rates for local buyers
Gold prices in the Philippines fell on Monday, based on FXStreet data. Gold was priced at PHP 9,274.39 per gram, down from PHP 9,378.88 on Friday.
Gold also slipped to PHP 108,174.30 per tola from PHP 109,393.40 on Friday. The listed reference prices were PHP 92,747.66 for 10 grams and PHP 288,475.40 per troy ounce.
FXStreet calculates local gold prices by converting international prices using the USD/PHP exchange rate and local measurement units. Prices are updated daily using market rates at the time of publication, and local rates may vary slightly.
Central banks hold the largest gold reserves. World Gold Council data shows central banks added 1,136 tonnes of gold worth about $70 billion in 2022, the biggest annual purchase since records began.
Gold often moves in the opposite direction of the US Dollar and US Treasuries. It can also move against risk assets. Its price can change with geopolitical events, recession worries, interest rates, and swings in the US Dollar because gold is priced in dollars (XAU/USD).
This small dip in gold is less important than the bigger economic trend. The main drivers matter more, especially shifting expectations for US interest rates through the rest of 2026. The slight drop is a good time to step back and review the forces shaping the market.
We think the US Federal Reserve is close to the end of its tightening cycle, which has been underway since 2024. Inflation data for January 2026 showed core inflation finally cooling. The Consumer Price Index fell to a two-year low of 2.5%. This points to possible rate cuts in the second half of the year. If that happens, the US dollar could weaken and gold prices could rise.
With that in mind, we should consider buying call options on gold futures that expire in late 2026. This gives upside exposure while capping the initial risk at the premium paid. A move above the key $2,450 per ounce level—a resistance area seen in late 2025—looks more likely if the Fed clearly shifts to a more dovish stance.
Central bank buying also continues to support the market. Central banks bought a record 1,136 tonnes in 2022, and final 2025 figures showed another 950 tonnes added to official reserves. This steady demand suggests that large price declines may attract buyers. That could make selling out-of-the-money put options appealing as a way to collect premium.
Geopolitical tensions are also helping to support prices. Uncertainty has increased again around global shipping routes and upcoming elections in several major economies. During the 2024 global trade disputes, gold jumped as a key safe-haven asset. Because these risks remain, keeping some exposure to gold volatility through strategies like straddles could pay off.
Gold does not pay interest, so it tends to look better when interest rates fall. The high-rate environment in 2025 limited gold’s upside. Now, a shift in monetary policy is the main catalyst to watch. We should be ready to use futures to build a core long position in the coming weeks, in anticipation of that change.


