USD/CHF trades near 0.7660 in Asia ahead of nonfarm payrolls, giving back earlier modest gains
USD/CHF gave back small gains and traded near 0.7660 in Asian hours on Wednesday, drifting toward 0.7650. The pair weakened as the US Dollar fell ahead of the delayed US jobs report due later Wednesday.
Markets expect January Nonfarm Payrolls to rise by 70,000. The Unemployment Rate is expected to stay at 4.4%. US Retail Sales were flat at $735 billion in December, after a 0.6% rise in November. This missed forecasts for a 0.4% increase.
Data show that gold prices rose in the United Arab Emirates, according to FXStreet figures
Gold prices rose in the United Arab Emirates on Wednesday, according to FXStreet data. Gold traded at AED 596.78 per gram, up from AED 593.98 on Tuesday.
The price per tola rose to AED 6,960.80 from AED 6,928.05 the previous day. Other prices listed were AED 5,967.87 for 10 grams and AED 18,562.06 per troy ounce.
FXStreet calculates these prices by converting global gold prices into AED and adjusting for local units. The prices are updated daily using market rates at the time of publication, though local rates can differ slightly.
Central banks are the biggest holders of gold. They bought 1,136 tonnes worth about $70 billion in 2022, according to the World Gold Council. This was the largest annual purchase since records began.
Gold is often seen as a store of value and is widely used in jewellery. Its price often moves in the opposite direction to the US Dollar and US Treasuries. It can also move against risk assets like shares.
Gold can also react to geopolitical tension, recession worries, and shifts in interest rates. It is priced in US dollars as XAU/USD, so changes in the dollar can affect gold.
With gold only slightly higher, the market is sending mixed signals. This points to volatility as the main opportunity. A stronger-than-expected US jobs report for January 2026, with more than 280,000 jobs added, has supported the dollar. That dollar strength is a major headwind and may limit near-term gains in gold.
The Federal Reserve meeting in January 2026 was also more hawkish than markets expected. As a result, traders have priced out rate cuts in the first half of the year. This has lifted implied volatility in gold options, especially in shorter-dated contracts. Many traders are buying puts to protect against a drop below the $1,980 per ounce support level if the Fed holds its position.
At the same time, rising tensions in Eastern Europe are helping to support prices by keeping safe-haven demand in place. This backdrop reduces the chance of a sharp sell-off and makes outright short trades riskier. More cautious traders are using low-cost call options to benefit if a sudden escalation pushes gold higher.
Central-bank demand also matters. It was a key driver of the rally through 2024 and 2025. Data for the full year 2025 shows buying stayed strong, but slowed sharply from the record pace seen in 2023. That suggests one major source of support may be fading, which could make gold more sensitive to economic data.
For the next few weeks, the most practical approach may be to trade the range rather than rely on a clear trend. One option is a long straddle, which means buying a call and a put with the same strike price and expiry. This strategy can profit from a large move in either direction. The next US inflation report will be crucial. If inflation comes in higher than expected, it would likely strengthen the dollar and could trigger the next move lower in gold.
Driven by yen strength, GBP/JPY extends its three-day weekly decline, hovering in the mid-209s near two-month lows
GBP/JPY fell for a third day and hit its lowest level since 19 December during Asian trading on Wednesday. It traded in the mid-209.00s, down nearly 0.50% on the day.
Japan’s ruling Liberal Democratic Party won a landslide lower house election victory on Sunday under Prime Minister Sanae Takaichi. This cut domestic political uncertainty and boosted expectations of more fiscal stimulus and further Bank of Japan rate rises.
The Japanese yen strengthened, which added pressure to the pair. Concerns about possible official action to support the currency also weighed on GBP/JPY. Together, these factors extended the pair’s weekly decline.
Sterling weakened as UK political uncertainty grew around Prime Minister Keir Starmer after the resignation of his chief aide, Morgan McSweeney. Calls for Starmer to step down from the leader of the Scottish Labour Party increased the uncertainty. At the same time, Bank of England guidance continues to point to future rate cuts.
On the charts, GBP/JPY broke below the 50-day simple moving average for the first time since November 2025. This move leaves the pair vulnerable to a drop below 209.00 and towards support at 208.20–208.15.
GBP/JPY is showing a clear breakdown and is now trading in the mid-209.00s after three straight daily declines. The main drivers—a stronger yen and a weaker pound—suggest the downtrend may have further room to run. Traders may consider positioning for more downside in the coming weeks.
The Bank of Japan’s hawkish tone is supported by strong domestic data. Japan’s national core CPI for January 2026, reported last week, came in at 2.8%, well above the central bank’s target. This sharply contrasts with other major central banks and creates a policy gap that favors the yen. The LDP’s landslide win on Sunday also adds to the sense of political stability behind the move.
In contrast, the British pound is under pressure from rising political uncertainty around Prime Minister Starmer’s leadership. This comes as the economy struggles: Q4 2025 GDP figures released last month confirmed the UK entered a technical recession after a 0.2% contraction. These conditions support the Bank of England’s recent signals that rate cuts are getting closer.
With this bearish outlook, buying GBP/JPY put options is a simple way to benefit from a continued decline. Consider puts with strike prices below 209.00, such as 208.50 or 208.00, which align with the support levels mentioned. A bear put spread can also reduce the upfront cost.
Implied volatility is rising because of political headlines and fears of currency intervention, which makes options more expensive. The Cboe/JPX JPY Volatility Index recently reached its highest level since August 2025. In this environment, option spreads can be a better way to control costs while keeping downside exposure.
Another approach is to short GBP/JPY futures contracts for direct exposure to falling prices. For risk control, consider a stop-loss just above the recently broken 50-day moving average, currently near 210.20. This level—where the pair had held since last November—now stands out as a key resistance area.
The US dollar index slips to around 96.65 after flat retail sales as attention shifts to upcoming US jobs data
The US Dollar Index (DXY) fell to around 96.65 in early European trading on Wednesday after weakening during Asian hours.
US Retail Sales were unchanged at $735 billion in December. This followed a 0.6% rise in November and missed forecasts for a 0.4% increase. Year over year, Retail Sales rose 2.4% in December, down from 3.3% previously.
Markets Focus Shifts To Jobs Data
Markets are now watching the delayed US January employment report due on Wednesday. Nonfarm Payrolls are expected to rise by 70,000, while the Unemployment Rate is forecast to hold at 4.4%. The US Dollar is the world’s most traded currency. It accounts for more than 88% of global foreign exchange turnover, or about $6.6 trillion per day in 2022. It became the main reserve currency after World War II, and it stopped being backed by gold after the 1971 Bretton Woods change. Federal Reserve policy strongly influences the dollar through its goals of price stability and maximum employment, including a 2% inflation target. Quantitative easing (QE) increases credit by buying bonds and can weaken the dollar. Quantitative tightening (QT) stops reinvesting maturing bonds and can support the dollar. In early 2025, the US Dollar Index was under pressure and slipped toward 96.50 after December 2024 retail sales came in flat. That weak reading increased expectations that the Federal Reserve would need to cut interest rates. At the time, markets focused almost entirely on the January 2025 Nonfarm Payrolls report, which was expected to show only 70,000 new jobs. The jobs report was indeed weak. During spring 2025, the Fed began cutting interest rates, starting in March. This matched market expectations and pushed the Dollar Index down further, breaking below 94.00 by mid-year. A similar example is the Fed’s 2019 pivot, when a move toward rate cuts limited dollar strength and supported risk assets.Derivative Strategies For A Weaker Dollar
In that 2025 setting, the best derivative strategies focused on ongoing dollar weakness and higher volatility. Traders who bought put options on the dollar, or call options on currencies such as the Euro and Swiss Franc, benefited from the move. Uncertainty ahead of the Fed’s decision also lifted bond market volatility, measured by the MOVE index. This favored traders who bought options rather than holding outright short positions. Today, February 11, 2026, some similar signals are appearing as the dollar trades near 101.50 after a strong run. Recent PMI data has weakened. The ISM Services index fell from 53.4 to 51.2, and weekly jobless claims are starting to rise. These are similar to the early warning signs seen in late 2024. This may suggest the cycle is turning again, creating conditions for a possible Fed policy shift later this year. Because of this, derivative traders may want to revisit the 2025 playbook in the coming weeks. That means tracking key employment and inflation releases closely for any further weakening. It may also make sense to start building positions that could benefit from a weaker dollar, such as buying out-of-the-money puts on the UUP ETF or using bearish risk reversals to help fund long-volatility positions. Create your live VT Markets account and start trading now.NZD/USD rebounds from a mild dip to a fortnightly peak of 0.6065 as the dollar weakens
NZD/USD climbed to a near two-week high during Wednesday’s Asian session, trading around 0.6065 after a small dip the day before. The move came as the US Dollar stayed weak ahead of the US Nonfarm Payrolls (NFP) report.
Markets are watching the NFP release for clues on the Federal Reserve’s next steps, with rate-cut expectations stretching into 2026. Worries about the Fed’s independence also kept the Dollar near its lowest level in more than a week.
Risk Appetite Supports The Kiwi
Better risk sentiment lowered demand for the US Dollar and supported the New Zealand Dollar. This helped offset softer inflation data from China, which signaled weak household demand and ongoing deflation risks. China’s Consumer Price Index rose 0.2% year on year in January, down from 0.8% the month before. Producer prices fell 1.4% year on year, marking the 40th straight month of contraction. These China figures increased expectations for more fiscal and monetary support, which can boost antipodean currencies. However, New Zealand’s higher unemployment rate in Q4 2025 reduced the likelihood of tighter Reserve Bank of New Zealand policy and could limit further NZD/USD gains. NZD/USD is now testing a two-week high near 0.6065, driven mainly by broad US Dollar weakness. The key near-term catalyst is the upcoming US Nonfarm Payrolls (NFP) report, which could trigger a sharp move. This setup may appeal to options traders looking to position for potential volatility.Options Positioning Ahead Of Nfp
Bearish sentiment on the Dollar is tied to strong expectations for Federal Reserve rate cuts. Fed funds futures currently price in an 85%+ chance of at least one rate cut by the Fed’s June 2026 meeting. This has pushed the US Dollar Index (DXY) below 103.00, an important psychological support level. Several NFP reports in the second half of 2025 triggered sharp, multi-day reversals in major currency pairs. That history suggests option straddles—strategies that can profit from a large move in either direction—may be a sensible way to trade the event risk. A payrolls number that is far from the consensus forecast will likely shape the Dollar’s direction for the rest of February. The New Zealand Dollar also faces challenges that may limit upside. The rise in New Zealand’s unemployment rate to 4.3% in Q4 2025 has largely removed the case for Reserve Bank of New Zealand rate hikes. Along with ongoing deflation pressure from China, New Zealand’s biggest trading partner, this suggests the Kiwi’s strength could be fragile. Given this backdrop, traders may consider buying near-term NZD/USD call options to take advantage of the current upward momentum into the NFP release. However, these positions should be hedged with put options or backed by a clear exit plan. A stronger-than-expected US jobs report would quickly challenge the rate-cut story and could send the pair sharply lower. Create your live VT Markets account and start trading now.Dividend Adjustment Notice – Feb 11 ,2026
Dear Client,
Please note that the dividends of the following products will be adjusted accordingly. Index dividends will be executed separately through a balance statement directly to your trading account, and the comment will be in the following format “Div & Product Name & Net Volume”.
Please refer to the table below for more details:
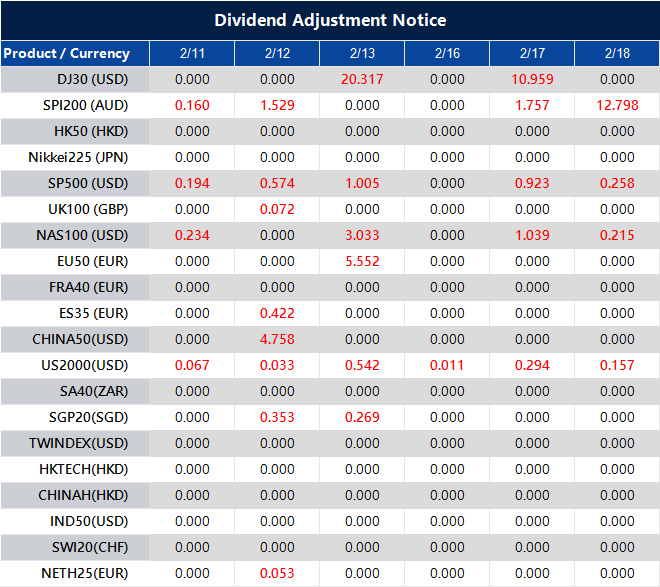
The above data is for reference only, please refer to the MT4/MT5 software for specific data.
If you’d like more information, please don’t hesitate to contact [email protected].
Wall Street Journal reports that House lawmakers rejected Johnson’s bid to stop votes disapproving of President Trump’s tariffs
The US House of Representatives rejected an effort by Speaker Mike Johnson to block votes on resolutions that would overturn President Donald Trump’s tariffs, the Wall Street Journal reported on Tuesday. This opens the door to votes that could challenge the tariff policy and allow Democrats to push to remove US tariffs on Canada.
The procedural vote failed 217 to 214. Three Republicans joined 214 Democrats in voting against it. In markets, the US Dollar Index (DXY) was near 96.65 at the time of writing, down 0.22% on the day.
The uncertainty around US tariff policy points to higher market volatility. The quick drop in the US Dollar Index suggests markets expect a weaker dollar if protectionist policies are rolled back. This new political setup supports buying volatility using options.
With Canada in focus, we are watching USD/CAD closely. The pair has broken below the 1.3400 support level that held through late 2025. The move could accelerate if the chance of removing tariffs increases. Derivatives traders may consider Canadian dollar call options to position for more strength versus the US dollar.
This shift is likely positive for US equities, especially multinational firms hurt by trade restrictions. The CBOE Volatility Index (VIX) has jumped from 14 to above 17 in the last day, showing that investors expect more turbulence ahead. One way to express a moderately bullish view while limiting risk is to sell out-of-the-money put spreads on the S&P 500.
The trade disputes of 2018–2019 showed how sensitive markets can be to tariff headlines. Markets often rallied sharply on any sign of de-escalation. That period also showed that political news can overpower economic data in the short term. This pattern may return, so it is important to track legislative updates closely.
Recent data shows US exports to Canada fell 4% year over year in the last quarter of 2025, largely blamed on trade frictions. Rolling back these policies would likely help key sectors such as autos and agriculture. For more targeted exposure, call options on sector ETFs could be a practical approach.
Traders await US NFP as USD/CAD slips to 1.3525–1.3520, lifting the Canadian dollar to near two-week highs
USD/CAD fell for a fourth straight day, sliding to a near two-week low around 1.3525–1.3520 in Asia. The pair had traded both ways the day before, but a softer US Dollar and firmer crude oil helped lift the Canadian Dollar.
Attention now turns to the US Nonfarm Payrolls report as the next major catalyst. The US Dollar has been under pressure as markets price in more Federal Reserve rate cuts and worry about the Fed’s independence.
On the charts, USD/CAD is trading below the 50-day EMA (1.3757) and the 200-day EMA (1.3854) after topping near 1.3928 in early January. The pair fell 0.25% on Tuesday to 1.3525. Key support sits at 1.3481, then 1.3500, while resistance is around 1.3600–1.3650.
The early-February rebound stalled near 1.3700. The Stochastic Oscillator (14, 5, 5) has also turned down from the midline. In Canada, January unemployment dropped to 6.5% and wage growth held at 3.3%. In the US, Retail Sales were flat (0.0%) versus a 0.4% forecast, and the Employment Cost Index rose 0.7% versus 0.8% expected.
We view CAD strength versus USD as a trend that still has room to run, driven by mixed signals between the two economies. The technical setup also supports this view: USD/CAD is in a clear downtrend channel and trading well below key moving averages. That keeps “sell-on-rallies” as the preferred approach, even on small rebounds.
Higher crude oil prices are an important part of this story. West Texas Intermediate has recently held above $80 a barrel, which supports the commodity-linked Canadian dollar and puts added pressure on USD/CAD. This outside support for the loonie makes short USD/CAD positions more attractive.
The next major event risk is the US Nonfarm Payrolls report. With volatility elevated, options may be a better way to express a bearish view while controlling risk. For example, buying USD/CAD put options could benefit from further downside, especially if the jobs data is weaker than expected.
Late-2025 data already pointed to this split. The US economy showed signs of slowing, while Canadian labour markets stayed tight. The US added 216,000 jobs in December 2025, but underlying details hinted at cooling. That backdrop has continued and supports the case for future Fed rate cuts.
Canada looks different. January inflation came in at a still-firm 2.9%, which can keep the Bank of Canada more cautious. This policy divergence is the core theme. As the gap widens between US and Canadian rate expectations, USD/CAD should stay under downward pressure.
From a technical standpoint, 1.3481 is the key support level. A clean break below it would raise the odds of a move toward 1.3400. Bearish option structures, such as put debit spreads, could target that next leg lower with strictly defined risk.
History suggests this may not be a quick move. When central bank policy paths diverge, trends can last for months, as seen in 2015–2017. The current setup looks similar, so positioning for further downside in USD/CAD over the coming weeks still appears to be the more prudent approach.
RBA deputy governor Hauser says inflation is still too high and pledges the central bank will act to bring it back within its target band
RBA Deputy Governor Andrew Hauser said inflation is still too high, and the bank will take whatever action is needed to bring it back into the target band. He added that some price increases may ease, while others seem tied to supply constraints.
At the time of writing, AUD/USD was near 0.7095, up 0.29% on the day. The RBA targets inflation of 2–3% by adjusting interest rates. It can also use quantitative easing or tightening to influence credit conditions.
Australian Dollar Key Drivers
The Australian Dollar is mainly driven by RBA interest rate policy and commodity prices, especially iron ore. Iron ore is Australia’s biggest export, worth $118 billion a year based on 2021 data, and China is the main buyer. China is Australia’s largest trading partner, so China’s growth affects demand for Australian exports and the AUD. The trade balance matters too: when export earnings are stronger than import costs, it usually supports the currency. The RBA’s message is clear: inflation is too high, and it will do what it takes to bring it down. Inflation stayed above the target band through the last quarter of 2025, reaching 3.9%. This points to interest rates staying higher for longer, and it leaves open the possibility of another hike. Higher rates are typically supportive for the currency. That hawkish tone is also backed by iron ore prices. In recent weeks, prices have held above $125 a tonne on the Singapore Exchange. Strong iron ore prices can improve the trade balance and provide fundamental support for the Australian dollar.China Demand And Trading Approach
Even so, demand from China needs close attention. China’s economy reportedly grew 5.1% in 2025, but the latest manufacturing PMI readings have been near the 50 level. This suggests the recovery remains uncertain. Any clear slowdown could weigh on the Aussie dollar. With the RBA focused on inflation, traders may want to be positioned for possible AUD strength in the weeks ahead. With AUD/USD already near 0.7095, buying call options may offer a way to gain upside exposure while limiting downside risk if weak Chinese data surprises the market. Pullbacks in the currency could be viewed as potential buying opportunities, since the domestic policy direction still looks firm. Create your live VT Markets account and start trading now.As China’s January CPI rises, the Australian dollar holds firm; AUD/USD rebounds near 0.7090 in Asia
AUD/USD traded near 0.7090 during Asian trading on Wednesday, recovering from earlier losses. The rebound followed China’s January CPI, which rose 0.2% year-on-year. That was down from 0.8% in December and below the 0.4% forecast.
China’s CPI rose 0.2% month-on-month in January. This matched the previous reading but missed the 0.3% expectation. In Australia, Westpac Consumer Confidence fell 2.6% month-on-month to 90.5 in February, the lowest level in 10 months, after a 25 basis-point rate hike.


