Dutch manufacturing output rose 0.5% in December after a 0.5% decline in November
The Netherlands’ manufacturing output rose 0.5% month on month in December. In the previous month, output fell 0.5%.
This is a 1.0 percentage point swing from the prior month. The latest figure shows output increased compared with the previous month.
EUR/USD slips to around 1.1905 in early European trade, snapping a two-day winning streak ahead of US data
EUR/USD slipped to around 1.1905 in early European trade on Tuesday, snapping a two-day rally. Traders stayed cautious ahead of delayed US jobs and inflation data, after a four-day government shutdown.
White House economic adviser Kevin Hassett said US job growth could slow in the coming months. He blamed slower labour force growth and higher productivity.
Us Jobs Data In Focus
The US Nonfarm Payrolls report is due on Wednesday. Forecasts point to a 70,000 increase in January. The Unemployment Rate is expected to hold at 4.4%. If the data comes in weaker than expected, the US dollar may fall and EUR/USD could rise. If jobs data is stronger, the dollar could strengthen against the euro. Last week, the ECB left its benchmark interest rate unchanged at 2.0% for the fifth meeting in a row, in line with expectations. ECB President Christine Lagarde said decisions will stay data-dependent and will be made meeting by meeting. She added that the bank will not commit to a set path for rates.Ecb Policy Outlook
A Reuters poll in January found that about 85% of economists expect the ECB to keep rates unchanged through the rest of 2026. This suggests markets are pricing in a long pause. EUR/USD is now trading near 1.0750 and looks soft as markets prepare for this week’s US inflation data. This setup is similar to periods of uncertainty seen in 2025 ahead of major releases. The main focus is the Consumer Price Index (CPI), which is likely to shape the Federal Reserve’s next move. US inflation in January 2026 was 2.8%, still well above the Fed’s 2% target. At the same time, last week’s jobs report was strong, with 215,000 jobs added. Together, these signals give the Fed little reason to cut rates soon. This supports the US dollar. In contrast, the ECB says it will stay data-dependent and will not lock in a rate path. Eurozone inflation has cooled faster than US inflation and recently came in at 2.2%. That gives the ECB room to keep rates steady. This gap between a firmer Fed and a more patient ECB is weighing on EUR/USD. The volatility seen in 2025 showed that policy differences between central banks are a key driver for this pair. The rate gap between the US and the Eurozone has widened to more than 1.5 percentage points. That makes it expensive to bet against the dollar. We expect this situation to persist. For traders, this backdrop supports a stronger dollar in the weeks ahead. Options strategies that benefit from a drop in EUR/USD, such as buying puts, may work well. With the CPI report approaching, short-term volatility may also rise. As a result, staying short EUR/USD not only aligns with the data, but can also capture positive carry. This means earning the interest rate difference between the two currencies. We see the easiest path still pointing lower, with 1.0600 as a likely test. Create your live VT Markets account and start trading now.Dividend Adjustment Notice – Feb 10 ,2026
Dear Client,
Please note that the dividends of the following products will be adjusted accordingly. Index dividends will be executed separately through a balance statement directly to your trading account, and the comment will be in the following format “Div & Product Name & Net Volume”.
Please refer to the table below for more details:
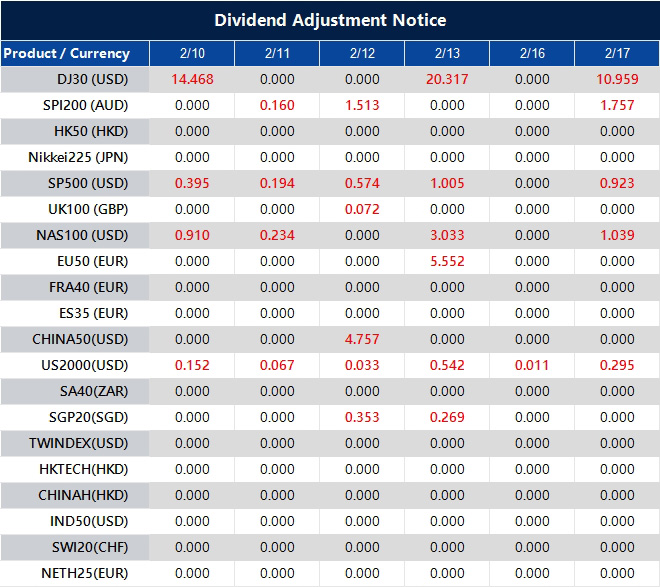
The above data is for reference only, please refer to the MT4/MT5 software for specific data.
If you’d like more information, please don’t hesitate to contact [email protected].
GBP/USD slips near 1.3685 in the European session as UK politics and BoE rate-cut bets weigh
GBP/USD fell in early European trading on Tuesday. It hovered near 1.3685 and stayed below 1.3700. The Pound weakened against the US Dollar as political uncertainty in the UK increased.
UK Prime Minister Keir Starmer faced a leadership challenge after Scottish Labour leader Anas Sarwar called for his resignation. The call followed fallout linked to the Jeffrey Epstein scandal. Starmer said he would not step down and would stay in office.
The Pound also came under pressure as markets increased bets on near-term Bank of England (BoE) rate cuts. These expectations added to the downside move in GBP/USD during the session.
With the Prime Minister under political pressure and more talk of BoE rate cuts, the Pound Sterling may weaken further. Derivative positioning should account for a potential decline in GBP/USD. Buying put options is a simple way to benefit from a move lower. This approach captures downside risk while limiting losses to the premium paid.
This setup is similar to the political turmoil in late 2022 during the short Truss premiership. In that period, the pound fell sharply against the dollar and hit a record low near 1.03. That episode shows how fast political uncertainty can lead to major currency losses.
Expectations for a BoE rate cut are rising, especially after UK inflation cooled to 4.0% in the final quarter of 2025. That is a large drop from earlier highs. In contrast, the US Federal Reserve still signals a “higher for longer” stance, which supports the US Dollar. This policy gap keeps steady downward pressure on GBP/USD.
Implied volatility for the Pound will likely rise as the political story develops, which would make options more expensive. During the 2022 stress, one-month implied volatility in GBP/USD jumped above 20%. Today it is closer to 8%. Buying options sooner could be cheaper than waiting if the situation worsens.
Key technical levels also matter. The 1.3500 area is an important support level that was tested in late 2025. A clear break below 1.3500 could trigger a faster sell-off toward the 1.32s. As a result, put option strikes near or below 1.3500 may work well in the coming weeks.
FXStreet data shows gold prices in the Philippines have declined, according to compiled figures
Gold prices in the Philippines fell on Tuesday, according to FXStreet data. Gold was priced at PHP 9,448.18 per gram, down from PHP 9,547.87 on Monday.
Gold dropped to PHP 110,201.70 per tola from PHP 111,364.50 the day before. Other listed prices were PHP 94,479.42 for 10 grams and PHP 293,871.40 per troy ounce.
FXStreet converts global gold prices into Philippine pesos using the USD/PHP exchange rate and local units. Prices are updated daily using market rates at the time of publication, and local prices may differ slightly.
Central banks hold the largest gold reserves. In 2022, they bought 1,136 tonnes worth about $70 billion, according to the World Gold Council. This was the biggest yearly purchase on record, led by higher reserves in China, India, and Turkey.
Gold often moves in the opposite direction of the US Dollar and US Treasury yields. It can also move differently from risk assets like stocks. Prices can change due to geopolitical events, recession worries, interest rates, and the US Dollar because gold is priced in dollars (XAU/USD).
Even though the dip in gold prices is small, it may be creating an opportunity as broader markets shift. The January 2026 US jobs report was much weaker than expected. Non-Farm Payrolls rose by only 95,000 jobs, which has led many to think the Federal Reserve could pause rate hikes. This has pressured the US Dollar, which often moves opposite to gold.
Bond markets are reflecting these shifting rate expectations. In early February 2026, the US 10-year Treasury yield fell to near 3.8%. Since gold does not pay interest, it tends to look more attractive when yields fall because the “cost” of holding it is lower. A similar pattern appeared in the second half of 2025, when falling yields came before a strong rally in precious metals.
Geopolitics is also supporting prices. Trade disputes and maritime tensions in the South China Sea are increasing demand for safe-haven assets. With this level of uncertainty, price dips may not last long. For traders, this may favor strategies that look for upside while limiting risk, such as buying call options.
Looking back at 2025, weaker US economic data often led to higher implied volatility. That suggests bigger price swings could return in the weeks ahead. Because of that, defined-risk options strategies may be safer than holding futures positions outright. The goal is to position for a weaker dollar and lower rates while protecting capital if the market suddenly reverses.
It is also important to note the strong institutional demand behind the market. The World Gold Council’s final 2025 report said central banks—especially in emerging markets—kept buying heavily, adding more than 950 tonnes last year. This steady demand supports prices over the long term and reduces the risk of a sharp collapse.
Compiled data shows that gold prices in the United Arab Emirates have fallen from previous levels
Gold prices in the United Arab Emirates fell on Tuesday. Gold was priced at AED 593.43 per gram, down from AED 599.78 on Monday.
Gold also dropped to AED 6,921.66 per tola, compared with AED 6,995.70 a day earlier. Other listed rates were AED 5,934.32 for 10 grams and AED 18,458.13 per troy ounce.
Uae Gold Price Calculation
FXStreet calculates UAE gold prices by converting global prices using the USD/AED exchange rate and local units. Prices are updated daily using market rates at the time of publication, though local rates may vary slightly. Central banks are the biggest holders of gold. In 2022, they added 1,136 tonnes worth about $70 billion—the highest annual total on record—according to the World Gold Council. Gold often moves in the opposite direction to the US Dollar and US Treasuries. It can also move against risk assets such as shares, and it may react to changes in interest rates, geopolitics, and recession concerns. The recent small drop in gold prices reflects the current strength of the US Dollar, which has been a major headwind for the metal. Comments from the Federal Reserve last week suggest it is not in a hurry to cut interest rates. That makes a non-yielding asset like gold less appealing in the very short term. This backdrop supports a cautious stance for traders holding bullish positions.Market Outlook And Trading Approaches
Still, strong underlying support from central banks remains a key feature of the market. Full-year data for 2025 shows central banks added another 950 tonnes to their reserves. This continues the steady buying trend seen since 2022. This persistent demand helps support prices and reduces the chance of a sharp sell-off. The US Dollar Index has held firm, hovering around 105.5 for the past few weeks. Historically, levels like this can limit gold’s upside. Also, January’s inflation report showed inflation still stuck at 3.2%, strengthening the case for higher interest rates for longer. That keeps upward pressure on Treasury yields, which compete with gold for safe-haven demand. A similar pattern played out through much of 2024 and 2025. Gold stayed resilient and even rose despite high rates, largely due to geopolitical risks. With these forces pulling in different directions, volatility could rise quickly. Traders looking for a low-cost way to prepare for a sudden rally could consider out-of-the-money call options, which may benefit if an unexpected global event drives prices higher. With mixed drivers in play, gold could also trade in a range over the next few weeks. Traders may consider buying puts to hedge long positions if prices fall toward key support levels. This can limit downside risk while keeping exposure to the longer-term bullish case supported by central bank demand. Create your live VT Markets account and start trading now.Gold prices in Pakistan fell, according to FXStreet-compiled data
Gold prices in Pakistan fell on Tuesday, based on data compiled by FXStreet. Gold was priced at PKR 45,033.45 per gram, down from PKR 45,526.33 on Monday.
Gold also dropped per tola to PKR 525,260.80, from PKR 531,010.20 a day earlier. Reference prices were PKR 450,330.40 for 10 grams and PKR 1,400,716.00 per troy ounce.
Pakistan Gold Price Snapshot
FXStreet converts global gold prices into PKR using the USD/PKR exchange rate and local units. Prices are updated daily at the time of publication, and local market rates may vary slightly. Central banks hold the most gold. They use it to diversify their reserves. In 2022, central banks bought 1,136 tonnes of gold worth about $70 billion. This was the highest annual total on record. Gold often moves in the opposite direction to the US Dollar and US Treasury yields. It can also move differently from risk assets like stocks. Key drivers include geopolitical events, recession fears, interest rates, and changes in the US Dollar, since gold is priced in dollars (XAU/USD). Gold is showing small day-to-day moves. But the bigger story started after the aggressive interest-rate hikes seen through most of 2025. Markets are now pointing to a major shift in central bank policy later this year.Market Outlook And Strategy
Gold does not pay interest, so it is very sensitive to expectations of lower rates. The latest US inflation report for January 2026 showed inflation at a two-year low of 2.9%. As a result, the US Dollar has weakened. This inverse link is one of the main signals we watch for bullish gold setups. Strong demand from central banks is also hard to ignore. After record buying in earlier years, global central banks added another 1,037 tonnes in 2025. That was the second-highest year on record. Much of this buying was aimed at reducing reliance on the US Dollar. This demand can help support gold prices during major sell-offs. Gold’s safe-haven role is also becoming more important. The stock market has been mostly flat since the start of 2026, which suggests investors are cautious. That tends to lift demand for assets that can hold up in uncertain conditions. We also expect trade tensions to keep pushing some capital into precious metals. With this view, we see opportunities to use derivatives for upside exposure while limiting risk. One approach is to buy call options with strike prices above the recent trading range. This can be a lower-cost way to benefit if gold breaks higher as rate-cut expectations grow. Create your live VT Markets account and start trading now.USD/CNH falls for the fourth day in Asia, nearing a May 2023 low around 6.9060
USD/CNH dropped for the fourth day in a row during Tuesday’s Asian session, hitting its lowest point since May 2023. It traded close to 6.9060, down over 0.10% for the day.
This decline is part of a medium-term trend that started after the peak in April 2025. The price has also slipped below the bottom of a short-term downward channel.
MACD indicators show the MACD line is below the Signal line, hovering around the zero level. The negative histogram has expanded slightly, indicating growing downward momentum.
The daily RSI stands at 27, suggesting oversold conditions that may prevent further losses in the near future. A change in momentum would involve the MACD moving back toward zero and the RSI rising above 30.
If there is a price rebound, the downward trend may still limit gains. The first resistance level to watch is 6.9495, near the upper channel boundary.
This analysis was supported by AI tools.
Looking back, the bearish sentiment from late 2025 unfolded as expected, with USD/CNH breaking out of its downward channel. That strong downtrend brought the pair to multi-year lows by the end of last year. At that time, technical indicators pointed to significant downward momentum.
Since then, the situation has changed. The pair has now bounced back to around 6.9800. This change is mainly due to differing policies: the People’s Bank of China lowered its one-year Loan Prime Rate last month to help an economy that underperformed with Q4 2025 GDP. Meanwhile, strong US jobs data from January 2026 keeps the Federal Reserve cautious about cutting rates.
In the upcoming weeks, traders might want to prepare for further gains, as the fundamentals now favor a stronger dollar. One strategy could be to buy call options with strike prices near the key level of 7.0000. Another option is to use bull call spreads to manage costs, especially as implied volatility may rise with the shift in trends.
Caution is advised, as the daily RSI is nearing overbought levels above 65, which could trigger some short-term profit-taking. If the price fails to break and stay above the recent highs around 6.9950, it may indicate that this rebound is losing strength. A drop below 6.9500 would put the current bullish outlook at risk.
Asian trading places XAG/USD at approximately $82.65 as the dollar recovers and profit-taking occurs, with a focus on US retail sales.
Silver (XAG/USD) dropped to around $82.65 during Tuesday’s Asian session, down 1.50% for the day. Traders are taking profits as the US Dollar strengthens. This shift comes as the market reassesses US growth and inflation before the delayed January employment and inflation data this week.
Data from the US last week boosted the Dollar and created pressure on Dollar-priced metals. The University of Michigan Consumer Sentiment Index increased to 57.3 in February, up from 56.4 in January, surpassing the expected 55.
Geopolitical tension is still a concern that may increase demand for safe-haven assets. Iran’s President Masoud Pezeshkian described last week’s nuclear talks with the US as “a step forward” while Iran’s foreign minister warned of potential strikes on US bases in the Middle East if attacked.
On Tuesday, US Retail Sales data is expected to show a 0.4% increase for December, following a 0.6% rise in November. Also, the market anticipates January Nonfarm Payrolls will grow by 70,000, with an Unemployment Rate of 4.4%, as detailed in a report scheduled for Wednesday.
Silver is facing some selling pressure and is retreating towards the $82.50 level after a significant increase. Profit-taking is typical as we assess the economic situation this week. The current high price makes silver sensitive to any changes in US economic data.
Looking back to this time in 2025, we expected a disappointing jobs report showing only 70,000 new jobs and an unemployment rate of 4.4%. Consumer sentiment was also low, at just 57.3, creating a very different outlook for silver. This economic weakness was a key factor supporting gold prices last year.
In contrast, the recent January 2026 jobs report showed a strong increase of 195,000 jobs, exceeding expectations and indicating a tight labor market. Additionally, the latest CPI inflation rate was a persistent 3.3%, while January retail sales rose by a solid 0.5%. These numbers suggest a resilient US economy that could keep the Dollar strong.
This strong economic data implies the Federal Reserve might delay any interest rate cuts, which could put downward pressure on non-yielding assets like silver. Traders might consider selling call options with strike prices above $85 to earn premiums. This strategy would be profitable if silver’s rise is limited by strong economic challenges.
However, the safe-haven demand from last year remains strong and could prevent significant price drops. Geopolitical tensions, especially about shipping routes in the Red Sea, continue to be a source of market uncertainty since the escalations in 2024 and 2025. This ongoing risk supports precious metals and makes outright short positions risky.
A wise strategy in the upcoming weeks could include setting protective put options below the $80 mark to shield against a sudden drop. Pairing this with selling out-of-the-money calls allows for upside potential while managing risk. This approach can help navigate the conflicting signals from a strong economy and ongoing global uncertainty.
AUD/USD hovers around 0.7100 as February Westpac confidence drops, putting pressure on the Australian Dollar in Asia
AUD/USD traded near 0.7090 during Asian hours on Tuesday after two days of gains, staying close to 0.7100. The Australian Dollar weakened as market sentiment turned cautious due to mixed local data.
Westpac Consumer Confidence dropped 2.6% month-on-month to 90.5 in February, marking a 10-month low, following a 25 basis-point rate increase. Conversely, NAB’s Business Confidence Index rose to 3 in January from a revised 2, its highest since October.


