Back

Asia’s economic calendar is light today, with no impactful data for major currency movements.

The economic calendar for Asia on Tuesday, June 24, 2025, is quite empty. No major releases are expected that could greatly influence foreign exchange markets.

Calendar Features

The calendar displays times in GMT. The last column shows previous results from the last month or quarter. If applicable, the column right before it gives the consensus median expectation. With few figures scheduled in the region, market participants might look for other signals. While data from Asia is crucial for local currencies and bonds, the lack of new information limits immediate price changes. Traders may need to shift their focus to other global events that could impact momentum. We see this quiet period as a challenge rather than a lull. When there’s little direct news, markets often react more strongly to surprises. Even slightly unexpected figures from Europe or North America later in the day can lead to big reactions across different asset classes, especially when there’s less liquidity in the Asian session.

Previous Numbers and Consensus

The last column of each listing shows previous numbers, which serve as a reference point, paired with the second-to-last column showing consensus. It’s not just about what happened, but what was expected and how it compares to reality. When expectations are closely grouped, the surprise threshold shrinks, leading to stronger moves from even minor differences. In quieter weeks, our focus shifts to watching market positioning more closely. We look for quick moves due to technical factors or unwinding rather than new information. Longer positions held during low-volatility times can quickly change if stop-losses trigger in unexpected ways. That’s where the true opportunities—and risks—lie. During these weeks, looking at commodities like oil and metals becomes useful. Movements in these markets may not always align with currencies, but when they diverge from expectations, they often reveal more about risk appetite than headlines or formal economic data. We’ve noticed that bond yields tend to react more quickly than major currencies during similar times, which is worth observing closely. Focusing on the sparse calendar is about understanding that volatility doesn’t wait for scheduled events. With fewer data points in a session, there’s more room for momentum-driven actions and instinctual trading. Responses can be quicker, sometimes going too far without immediate fundamentals. This is where the difference lies between disciplined and reactive positions. The current calendar emphasizes the need for vigilance; it offers no false signals and no security. Days like this can pivot on futures flow rather than early reports or central bank notes. We pay attention to the rising options volume in recent days for insights on where protection lies. When few factors tie prices down, those volumes often help define the ranges. Stay flexible. Being aware often outperforms predictions, especially when headlines are lacking, but positioning remains active. Create your live VT Markets account and start trading now.

here to set up a live account on VT Markets now

Market participants notice rising gold prices due to concerns over Iran and anticipation of Powell’s testimony.

Gold prices are rising again due to increasing geopolitical tensions between Iran and the U.S. This spike in tension follows U.S. airstrikes on Iranian nuclear sites, which triggered Iran’s retaliatory actions. As a result, more investors are turning to Gold as a safe investment. Additionally, the Federal Reserve’s potential interest rate cuts are affecting Gold prices. Fed Governor Michelle Bowman’s recent comments have sparked speculations in this direction. Everyone is now paying attention to Chair Jerome Powell’s upcoming testimony. Geopolitical risks, along with rising oil prices due to potential supply issues, are shaping this situation.

Technical Analysis Of Gold

Gold is trading just under a resistance level, supported by the 20-day and 50-day Simple Moving Averages. It faces key resistance around $3,400. If prices drop, they may retest $3,342. Investor sentiment varies as some look for risk while others prefer safe havens like Gold during uncertain times. Market sentiment determines whether investors feel “risk-on” or “risk-off.” In risk-on phases, certain currencies tend to rise due to their strong ties to commodity exports. In contrast, currencies like the U.S. Dollar and Swiss Franc usually strengthen in risk-off periods. Last week, we witnessed a significant shift in capital as geopolitical events and monetary policy signals influenced markets. Fresh military tensions have invigorated Gold, which has historically been a safe haven during times of doubt. This recent increase isn’t coincidental—it came after military escalations. The link between safe-haven assets and news events is now more evident than ever. When the Fed discusses possible interest rate changes, the impact goes beyond just treasury bonds and credit markets. It affects various assets. Bowman’s comments created speculation that caused yields to fall, making non-yielding assets like Gold more attractive. What Powell says next could shift market momentum again, so we can expect interest rate indicators to be more responsive to upcoming guidance. We do not anticipate immediate solutions, which keeps the demand for safe havens, like Gold, high for now.

Implications Of Oil Prices

Rising oil prices, driven by fears of production disruptions, are important to consider. They suggest inflation pressures and highlight how quickly supply chain issues can resurface. This trend affects not only energy traders but impacts inflation predictions, rate expectations, and short-term commodity relationships. Technically, Gold is trying to break through levels it has struggled to surpass recently. Support from the 20-day and 50-day SMAs is important, but slight pullbacks to $3,342 would not necessarily end the current trend. The key question is whether it can push above recent highs with strong trading volume. $3,400 is more than just a number; it’s where past rallies have faltered. A clear breakthrough could attract new investment from momentum traders. Investors are continually reassessing their risk exposure. In risk-off scenarios, the dollar usually strengthens while higher-risk currencies decline. Watching how these flows interact with interest rate indicators and commodity-linked currencies in forex markets is crucial. Not all currency pairs will behave the same, with stronger reactions likely from emerging markets or commodity-focused pairs. Ultimately, traders need to evaluate their positions at key levels. Recent fluctuations in option premiums reveal a surge in uncertainty. It’s essential to adapt quickly around resistance levels since price movements are more abrupt than usual, rather than gradually rising. Delaying entries based on slow indicators may not provide the needed edge. We are seeing more rapid price changes than typical. Expect temporary shifts in investor sentiment leading up to the next central bank announcement. Chart patterns and open interest in derivatives may guide decision-making, but external factors are driving current momentum. Fresh news events can quickly change pricing. Staying responsive, especially with higher-leverage strategies, requires clear guidelines for adjusting stops and targets. From a broader perspective, the dollar’s strength during risk-off periods remains a reliable reference point, but its timing will continue to depend on perceptions of safety and real yield trends. Keep positions flexible. Create your live VT Markets account and start trading now.

here to set up a live account on VT Markets now

Gold Slips As Middle East Truce Eases Market Jitters
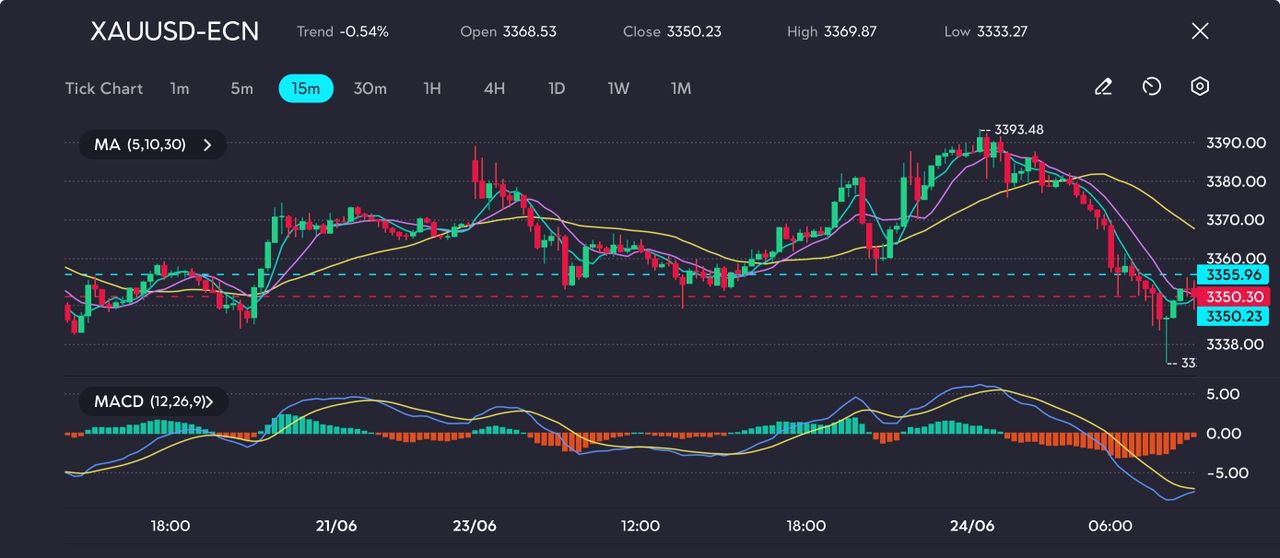
Gold prices saw a notable decline on Tuesday after US President Donald Trump declared a ‘complete and total’ ceasefire agreement between Israel and Iran. Spot gold slipped by 0.6% to $3,349.89 per ounce, while US gold futures dropped 0.9% to $3,364.20, marking their lowest point since 11 June.

The truce, expected to take effect within 12 hours, followed a direct phone conversation between Trump and Israeli Prime Minister Benjamin Netanyahu. Reports also suggest that US officials discussed with Tehran to finalise the terms. According to a White House spokesperson, the ceasefire hinges on Iran refraining from further strikes, a condition Tehran appears willing to honour.

This abrupt easing of tensions has reduced demand for traditional safe-haven assets like gold. With the immediate threat of conflict subsiding, investors have begun rotating out of bullion as geopolitical premiums fade.

Technical Analysis

A glance at the 15-minute XAUUSD chart reveals the MACD crossing below its signal line, with a widening negative histogram, suggesting mounting bearish momentum. Price action has recently touched a low of $3,333.27 and is trading below all major short-term moving averages (5, 10, and 30), which supports a short-term bearish view.
Bearish pressure mounts on gold as short-term moving averages cross lower, as shown on the VT Markets app.

Unless the ceasefire breaks down, gold is likely to remain under pressure below $3,360.00 in the near term. A decisive move beneath $3,333.00 could expose the $3,315.00 support area. Any upward recovery is expected to be limited around the $3,370.00 region unless market sentiment turns risk-averse once more.

Hopes for Rate Cuts Emerge, but Fed Stays Cautious

Attention now shifts towards the US monetary policy outlook. Federal Reserve Vice Chair Michelle Bowman hinted that the time for rate reductions may be nearing. Her comments coincided with data showing only a slight cooling in US economic activity in June, though renewed import tariffs under Trump have reintroduced inflation concerns.

Fed Governor Austan Goolsbee remarked that the economic fallout from these tariffs has been ‘more moderate’ than originally anticipated. Still, with inflation creeping higher and job creation slowing, the Fed remains in no rush to adjust policy. Markets are currently anticipating a rate cut at the 18 September meeting.

All eyes now turn to Fed Chair Jerome Powell, who will testify before the House Financial Services Committee later today. While traders are hoping for clearer direction, Powell has thus far remained non-committal. Futures markets may experience increased volatility ahead of his appearance.

Should Powell adopt a more dovish tone, gold could find intraday support near $3,345.00. However, any signal of continued policy restraint from the Fed, especially in a calmer geopolitical climate, may place renewed pressure on gold prices.

Create your live VT Markets account and start trading.

The Australian dollar rises above 0.6400 against the US dollar amid mixed US economic data

AUD/USD has bounced back to over 0.6400 after mixed US PMI data reduced demand for the US Dollar as a safe haven. The S&P Global US Composite PMI dipped slightly; manufacturing held steady, but services weakened while still surpassing expectations. The Australian Dollar (AUD) rose against the US Dollar (USD) after hitting a one-month low due to rising tensions in the Middle East. AUD/USD was trading around 0.6426, regaining much of its earlier losses.

US Manufacturing and Services

In June, the S&P Global Composite PMI for the US fell to 52.8 from 53 in May. Manufacturing held steady at 52, but the Services PMI dropped to 53.1. These mixed results reduced demand for the US Dollar and helped AUD/USD rebound. Comments from Fed Governor Michelle Bowman about steady progress on inflation towards the 2% target and possible rate cuts also weakened the US Dollar. This shift allowed the Aussie to gain as the US Dollar Index fell below 99.00, settling around 98.70. Australia’s private sector showed growth, especially in services, which reached a three-month high according to S&P Global data. Technically, the AUD/USD pair has support near 0.6400. If it closes above 0.6450, it might rise toward 0.6500–0.6550. However, if it fails to stay above 0.6400, it could drop to around 0.6300. As the US Composite PMI eased and key sectors showed mixed trends, the decline in US Dollar demand was quick. Manufacturing stalled but didn’t fall, while services, despite softening, did better than expected. The sharp rise in AUD/USD indicates how the market reacted to these details, suggesting potential weakening in the US economy.

Domestic Momentum and Market Tension

Bowman’s recent comments signal a shift in expectations for US monetary policy. Her cautious remarks on inflation and openness to rate cuts have led to US Dollar weakness. This, in turn, has eased pressure on higher-risk currencies like the Australian Dollar, at least for now. It shows that interest rate expectations continue to drive the market, especially when broader demand signals fluctuate. In Australia, positive signs from the private sector, particularly in services, provide a buffer against downturns. The three-month high indicates that domestic momentum remains strong, even amid global market tensions. It’s crucial to monitor local data alongside external risk events, as they are becoming more significant in shaping short-term price movements than they were during much of the second quarter. Technically, 0.6400 has proven to be a reliable support level. This area continues to serve as a crucial point for directional movements. If we see a daily close above 0.6450, market strategies may shift, aiming for the next resistance level around 0.6550. Activity near these levels often triggers mechanical flows that can speed up price changes. On the downside, any drop below 0.6400—especially with renewed demand for the US Dollar or weakening domestic sentiment—could pave the way toward lower levels seen in prior defensive phases, particularly around 0.6300. Such moves often lead to swift reactions, driven by short-term traders exiting quickly. Given how sentiment is linked to policy statements, it’s important to stay alert to Fed communications, especially anything that could change expectations for rate cuts. Recent sessions have shown how slight adjustments in outlooks—without significant changes in data—can lead to sharp currency movements. This context should not be overlooked when assessing directional risk. Create your live VT Markets account and start trading now.

here to set up a live account on VT Markets now

Governor Bowman is open to lowering the policy rate if inflation pressures stay manageable.

FOMC Governor Michelle Bowman recently mentioned that if inflation stays stable, she would support lowering the policy rate at the next meeting. This would help align the rate with its neutral level, ensuring a healthy job market. Bowman is open to possible rate cuts starting at the July meeting. She highlighted the importance of assessing risks to the job market and noted that trade policies have minimal effects on inflation.

Trade Policies And Inflation

Tariffs are expected to have a small impact on inflation, while improvements in trade help reduce uncertainty. The ongoing conflict in the Middle East could drive up commodity prices. Despite a strong job market, there are early signs of weakness. The AUD/USD pair bounced back from its lowest level since May, supported by positive global sentiment after a ceasefire announcement between Israel and Iran. The USD is facing pressure, bolstered by renewed expectations of a Fed rate cut in July, affecting USD/JPY and influencing gold prices. The cryptocurrency market also rose as major assets recovered, driven by the ceasefire. However, concerns about the potential closure of the Strait of Hormuz, a vital shipping route, are resurfacing. Trading foreign exchange comes with high risks and leverage, which can result in significant financial losses. It’s crucial to understand these risks and consult a financial advisor when needed.

Shifts In Monetary Policy Expectations

Bowman’s comments mark a noticeable shift from some previous communications. She suggests that the threshold for easing may be lower than markets previously thought. If inflation remains steady or declines, a July rate cut becomes more likely. It’s important to note that she still views the job market as a strong pillar, although some cracks are starting to appear. This suggests that the economy is resilient enough to implement some monetary easing without immediately threatening employment. She downplayed the inflationary effects of trade policies, reducing the emphasis on tariffs. Even as trade disputes continue, their impact on core inflation seems to be diminishing. This may give the central bank more freedom to focus on domestic factors. However, if conflicts in the Middle East escalate, energy markets may feel the pressure again. For now, the resolution between Israel and Iran prompted a global sigh of relief, positively affecting various asset classes. The bounce in AUD/USD was not driven by domestic data. Instead, easing global tensions restored confidence and increased appetite for carry trades. Markets began to expect a more dovish stance from Washington, leading to a pullback in USD strength and a decrease in defensive positions. This trend was supported by reduced safe-haven investments in the yen and a rise in gold as the dollar weakened. These foreign exchange movements illustrate how sensitive current market sentiment is to international news—value is not solely determined by fundamentals. There were also notable effects in the cryptocurrency market, which appears to be increasingly responding to geopolitical changes. However, these digital assets are still influenced by central bank expectations. Their bounce likely indicates a market anticipating looser financial conditions, especially if risks in the Middle East remain controlled. That said, there are still concerns about the possible closure of the Strait of Hormuz. This issue extends beyond oil shipping to affect various logistics and pricing chains. From a trading perspective, the possibility of a Fed policy shift brings both opportunities and volatility. Rate-sensitive assets are already adjusting. Some short-term contracts may be anticipating more dovish outcomes faster than the fundamentals may warrant, creating room for abrupt changes if economic data contradicts these expectations. It’s essential to closely monitor job data, wage growth, and fresh inflation figures before July. Any signals inconsistent with rate cuts could trigger a quick sell-off, especially since positioning has become more one-sided. Using leverage in these markets requires careful execution. Volatility from news or policy changes affects not just foreign exchange but can also ripple through commodities, metals, and sectors linked to policy shifts. Given the close relationship between gold and USD/JPY sentiment, traders making directional bets should be cautious of broader correlation changes during sudden geopolitical events. This environment requires thoughtful evaluation of news, timing, and liquidity when placing trades. Relying solely on rate expectations without considering political risks may lead to unexpected setbacks. Create your live VT Markets account and start trading now.

here to set up a live account on VT Markets now

Buyers of USDJPY faced challenges at the 38.2% retracement, causing a pullback to support levels.

USDJPY recently went above the 38.2% retracement level from December to April, reaching 147.11, but failed to hold its position. This led sellers to push the price back to the established range between 145.92 and 146.24. If USDJPY drops below this range, it might show a bearish trend. Key levels to watch are 145.47, a minor pivot from May, 144.66, the 200-hour moving average, and 144.42, the 100-hour moving average. On the other hand, if the price holds and rebounds from the swing band, it could indicate a bullish trend. The first challenge would be to reclaim the 38.2% retracement level at 147.11, with a target of 147.49, today’s peak price. The price movement within the range of 145.92 to 146.24 will dictate the next direction. Observing momentum on either side will be crucial to confirm the upcoming trend. This situation reflects a typical response to a failed breakout attempt. After moving slightly above the 38.2% retracement of the recent decline, the pair quickly retreated. Such rejections near retracement levels often shift focus back to short-term balance points, resulting in traders driving the price back into the familiar zone between 145.92 and 146.24. The earlier rise past 147.11 suggested bullish interest, possibly due to hopes for a more assertive policy from decision-makers or better economic conditions. However, the lack of follow-up buying indicates weak conviction or dependency on an absent catalyst. Once the upward movement stalled, sellers re-emerged, particularly those waiting to profit from any strength near technical resistance. Now, it’s crucial to observe the behavior near the lower edge of this range. If the price falls below 145.92 and stays there, it may encourage deeper retracements within the larger range developed over the last few weeks. The initial targets would be 145.47, where there was a brief pause during May, followed by the moving averages at 144.66 and 144.42. Momentum often picks up around these levels, as shorter-term traders view them as key balance points. We focus on price flow and reactions rather than just proximity to specific levels. A breakout from the swing band would be more convincing if it comes with increasing volume or aligns with broader market shifts. For example, if stocks decline or yields remain low, the pair might not stabilize near support levels. Still, a rebound from the current levels would not be unexpected. This wouldn’t be the first time buyers have defended this band. If the price stabilizes here, a move towards retesting 147.11, and ideally up to 147.49, is likely. Breaching that level could support a stronger retracement of the earlier decline this year. In either direction, we are relying on real-time reactions instead of speculation. Observing how the price behaves in and out of this tight range will provide clear positioning insights. The next two sessions could offer more confidence in this analysis. Static levels matter only if behavior confirms them. For tactical positioning, we remain mindful of the defined swing band and momentum indicators. Moving averages, especially the 100-hour and 200-hour lines, are important—they indicate when control is shifting decisively. We look for movements beyond these averages when volatility increases or when major pairs show wider fluctuations. Even if the market remains compressed longer, patience is a better strategy than guessing at turning points. Waiting for movement beyond 147.49 or below 145.92 will clarify direction. Until then, movements within the band are more likely to be noise than signals.

here to set up a live account on VT Markets now

FactSet Research quarterly earnings fall short of expectations, reporting $4.27 per share instead of $4.31

**FactSet Revenue Trends** Since the beginning of the year, FactSet shares have dropped by 12.1%. In contrast, the S&P 500 has grown by 1.5%. The future stock price will depend mainly on the company’s next earnings calls and commentary. The current consensus for earnings per share (EPS) is $4.13, with anticipated revenues of $591.59 million for the next quarter. For the current fiscal year, earnings are expected to be $17.10, with revenues reaching $2.31 billion. Rollins, a company in the same sector, will soon announce its quarterly results, predicting earnings of $0.29 per share and revenues of $976.52 million. This represents a 9.5% revenue increase from the same period last year. **FactSet’s Performance Outlook** FactSet’s recent earnings of $4.27 per share were slightly below expectations, which were set at $4.31. Although this shortfall might seem small, it’s significant when compared to last year’s earnings of $4.37 for the same quarter. This indicates a slight decrease in efficiency, despite revenue growth. In terms of revenue, FactSet performed well, generating $585.52 million, which was a positive surprise of 0.72% and well above last year’s $552.71 million. This shows that sales are strong, but there may be challenges in managing costs or profit margins, which have dipped slightly below expectations. From a trading standpoint, it’s crucial to understand why revenue continues to rise while earnings are decreasing. This trend isn’t sustainable over the long term in data analytics firms, where profit margins often shrink during periods of investment or restructuring. Although factors like platform expansion or internal cost pressures should not be overlooked, we should be cautious about overly optimistic views until we get clearer insights from company commentary or filings. Watching the upcoming earnings calls will shift focus from just the numbers to the reasoning behind them. Analysts will likely seek explanations regarding operational efficiency, especially since shares have declined over 12% since January. With the broader market rising, like the 1.5% gain of the S&P 500, any underperformance stands out more. Looking forward, analysts have slightly lowered expectations, forecasting EPS of $4.13 for next quarter and projecting revenues to grow to $591.59 million. A gradual drop in earnings, while revenue continues to increase, puts pressure on operating margins. The outlook for the full year suggests an annual EPS of $17.10 and revenues just exceeding $2.31 billion, indicating a cautious revenue forecast. In the same sector, Rollins provides an interesting comparison. It expects earnings of $0.29 per share and a 9.5% revenue increase, totaling $976.52 million. Although the scale differs, the growth trends are similar. The key difference lies in how effectively each company turns that growth into actual earnings. For those monitoring derivative markets linked to these stocks, it’s time to adjust any positions that relied on consistent strong earnings. Previously expected high-probability earnings beats may now lead to increased volatility in EPS outcomes. This situation could create opportunities for strategies that anticipate intermittent weakness, especially where implied volatility is underestimated. It’s more about broadening the hedge than just exiting positions. Create your live VT Markets account and start trading now.

here to set up a live account on VT Markets now

US dollar drops sharply as markets respond positively to oil prices and rising risk appetite

Market conditions are changing. Oil prices are falling, and stock prices are rising, while the US dollar is losing value. This shift came after Iran took a symbolic action against a US base in Qatar, which seemed more like a domestic stage play than a serious escalation. The US dollar has experienced a significant fall, reversing early gains into substantial losses. In contrast, the euro has gained 41 pips overall and has recovered 140 pips from its earlier lows, getting closer to the 1.1600 level.

Market Reaction To Geopolitical Events

So far, it appears that geopolitical events aren’t causing long-term market anxiety. The market seems to view Iran’s response as more for domestic purposes rather than a large-scale conflict. Consequently, the euro, which was previously oversold, found support and has nearly regained all its losses, moving back up and nearing a key psychological level. Simultaneously, the US dollar’s abrupt fall fits a pattern seen when geopolitical tensions ease, allowing macroeconomic trends to take the forefront. After earlier gains were lost, the dollar weakened across the board, despite Treasury yields remaining stable. This indicates that traders are unwinding their positions rather than adjusting rates. We’ve seen such reversals happen before when traders heavily bet in one direction ahead of known risks. For those tracking options and short-term market volatility, there has been a reduction in pricing for near-dated euro-dollar pairs. This suggests that expectations for policy differences are now more measured. The earlier demand for euro downside protection has decreased, and volume in put spreads has lightened, confirming that initial fears were quickly alleviated.

Implications For Traders And Markets

In this context, the focus shifts to adjusting rate expectations—not just for the Federal Reserve, but also for the European Central Bank. Goolsbee’s recent comments haven’t significantly influenced terminal rate forecasts, but they’ve created some uncertainty, pushing sentiment towards more patience instead of aggressive tightening. This sentiment is reflected in swap pricing, which now slightly favors an earlier Fed rate cut than what was anticipated just a week ago. For traders looking to time market moves with derivatives, this shift provides new opportunities. We prefer strategies that benefit from moderate dollar weakening without expecting major shifts. Short-term risk reversals are beginning to reflect this approach, and the euro-dollar movement suggests that betting against the dollar could offer good prospects, especially with upcoming PMI data and consumer inflation expectations. Moreover, rising equities amid a weaker dollar is not a coincidence. There’s renewed interest in reflation trades, with tech and cyclical sectors attracting buyers as the New York market opens. A lower dollar enhances profitability for multinational companies, which is now being factored into option strategies. Open interest in call spreads on large-cap indices has increased, particularly for expirations in late February. Due to this broader shift, volatility selling in US index futures has markedly increased. This makes future shocks likely to cause sharp adjustments in positions. We are closely monitoring volatility surfaces for any steepening that might indicate further market stress. So far, there are no signs of such stress, reinforcing the idea that traders have moved past initial geopolitical responses and are returning to macroeconomic trends instead of seeking safety. Our focus is now on global data surprises. Upcoming economic reports will help determine whether the recent gains in risk assets can hold or fade away. For now, downside protections in euro-dollar seem well secured, and the probability indicators in rate futures suggest that fixed income markets are easing off aggressive tightening expectations. We will continue to look for clearer signals in the next few sessions. Create your live VT Markets account and start trading now.

here to set up a live account on VT Markets now

Daniel Ghali notes critically low copper inventories, leading to changes in convenience yields within TDSLME.

LME Copper convenience yields show that inventories are extremely low, with metal leaving the system recently. This is driven by rising demand from China and the US, creating a need for metal to return to avoid running out of stock. In Shanghai, traders have sold a significant amount of Copper positions, totaling 84.5k metric tons this month. Even so, deliveries are still sparse. However, increased buying from Commodity Trading Advisors (CTAs) may push LME flat prices and the curve upwards. By June, the AUD/USD hit resistance around 0.6550 but recovered to above 0.6400, influenced by a sell-off in the US Dollar. Similarly, EUR/USD approached 1.1630 due to hints of possible interest rate cuts from the Fed. Gold prices are hovering near $3,400 due to geopolitical tensions, particularly after Iran’s missile activities. Former Coral Capital executives are planning a $100 million investment in cryptocurrency, coinciding with a 4% gain in BNB. As geopolitical tensions rise, the threat of closing the Strait of Hormuz resurfaces, especially as tensions between Israel and Iran escalate. Trading foreign exchange carries risks, and using leverage can lead to losses. It’s crucial to understand your investment goals and risks before engaging in trading. The current situation in copper markets reveals a risk framework beyond just supply and demand. The decline in LME convenience yields indicates extremely low warehouse stocks, at a historic low. The recent drawdown signals a severe shortfall likely caused by increased building activity in the US and changes in forward booking from Chinese buyers. As metal continues to be pulled from visible exchange inventories, the tightness in supply remains a significant concern. This scarcity is evident as the curve shows a premium over the spot price, especially in the near months. If short-term stock levels do not improve soon, we expect further steepening in backwardation. This steepening is no coincidence; it reflects genuine concerns over securing physical delivery rather than just paper returns. Additionally, even with the recent unloading of over 84,000 metric tons of copper contracts on the Shanghai exchange, we haven’t seen a corresponding increase in immediate deliveries, highlighting an underlying scarcity of metal. The involvement of CTAs has started to influence flat pricing again. These strategies, driven by price trends and momentum, could amplify market movements. When inventory shortages collide with model-driven orders, both the curve shape and spot prices can react sharply. While timing is challenging, it appears that the risks are skewed, especially for those closing short positions or rolling forward contracts. In the FX markets, the AUD/USD rebound past 0.6400 coincided with a decrease in demand for the dollar. This isn’t just a technical overshoot; it’s a strategic shift based on expectations regarding the US central bank’s direction. The resistance near 0.6550 should not be seen only as structural; it likely indicates a pause as macro players assess future rate expectations. Similarly, movements in EUR/USD towards 1.1630 suggest investors are positioning themselves ahead of potential rate cuts. Data supports an increased commitment to the European currency, likely at the expense of short-term loyalty to the dollar. Gold has once more taken on the role of a geopolitical hedge, with current prices suggesting more than mere sentiment. The rise toward $3,400 follows heightened risks around the Strait of Hormuz, fueled by recent missile launches. These issues are significant for global shipping, as volatility in crude and natural gas prices often starts from concerns in that area. Traders should stay alert for potential cross-sector impacts. Rising tensions between Israel and Iran, specifically regarding potential maritime blockades, add complexity to risk models. These developments should be viewed as primary triggers rather than mere theoretical risks, changing correlations and affecting relative value trades across metals, energy, and increasingly, digital assets. Speaking of digital assets, the planned $100 million crypto fund by former Coral Capital executives comes at a time when BNB has gained 4%, amidst a broader sector rally. Although still a small part of most derivative portfolios, money flowing into token-based assets is becoming harder to overlook, especially as traditional safe-haven assets like gold adjust in price. For those managing derivative strategies, the upcoming weeks will demand close attention to physical indicators, particularly metal stockpile reports and shipping data, along with momentum model signals. Both of these inputs can serve as tipping points that standard macro filters may overlook. We continue to keep a close watch.

here to set up a live account on VT Markets now

Goolsbee states that the effects of tariffs are milder than expected, with uncertainties impacting economic data.

Chicago Fed President Austin Goolsbee noted that the impact of tariffs has been milder than expected. He likened these tariffs to oil shocks, indicating potential stagflation concerns. The limited effect of the tariffs comes from their relatively low levels and specific exemptions. Goolsbee highlighted that uncertainty is present now and emphasized the need to watch soft economic data during this changeable period. He stated that there are no clear signals about interest rate changes at this time. Goolsbee’s comments hint at larger trends beneath the headlines about policy changes and economic data. When he compares import tariffs to past oil shocks, he raises concerns that go beyond inflation and growth; there is a troubling mix of both pressures arising simultaneously. This comparison, drawn from the 1970s, carries historical weight that markets generally dislike—specifically, the worry of slow economic growth alongside rising prices. However, things haven’t unfolded exactly as feared. The tariffs we see remain quite restrained by global standards, with enough exceptions to lessen their impact. It’s one thing to apply tariffs for strategic reasons; it’s another to keep them relatively low from a broader economic viewpoint. So far, the consequences appear manageable. That said, don’t treat this as a reason to relax. The focus on soft data is significant. These indicators—like surveys and sentiment readings—often reflect shifts in mood and expectations before these changes show up in more concrete data like GDP or consumer spending. When these measures start to decline or consistently rise, they often signal the next move in policy or pricing. The lack of a clear message about interest rates shouldn’t be seen as indifference from policymakers. Quite the opposite; it indicates how much they are considering incomplete signals. There’s hesitation—not from uncertainty, but from a careful approach to avoid overreacting to a trend that remains unclear. For those of us analyzing short-term trends and planning for longer-term scenarios, the implications are direct. Patience is necessary. Volatility pricing may not fully capture shocks caused by shifts in sentiment. These changes don’t always follow a trend but can switch rapidly. It may be wise not to assume that the relationship between economic data and market pricing will remain stable. We might begin to adjust our strategies alongside updated expectations, rather than waiting for signals from policy changes themselves. Anticipatory pricing often reacts faster than official statements during transitional times. Right now, there’s a notable gap between tangible data and future expectations. Being slow to adjust could be costly. It may be better to monitor how short-term instruments respond to changes in survey data instead of waiting for slower-to-release top-line figures. While fundamentals seem solid for the moment, upcoming volatility is rarely aligned with risk-focused news—especially when central bank communications lack clarity. Observing how pricing reacts to sentiment will likely provide more insight than waiting for speeches or meeting minutes. There’s no need to hurry, but there’s equally no room for complacency.

here to set up a live account on VT Markets now

Back To Top
Chatbots