Key Takeaways
- The index rose 1.02% on Monday, recovering losses linked to the Middle East conflict and returning to levels seen before the war-related sell-off.
- Oil prices remained volatile, with Brent crude at $97.90 and WTI at $96.75, as the market reacted to tensions around the Strait of Hormuz.
- While energy stocks benefited from higher oil prices earlier, tech stocks have recently taken the lead as market momentum shifted back toward growth sectors.
- Earnings season is now a key focus, with major banks such as JPMorgan Chase, Wells Fargo, and Citigroup set to report.
The S&P 500 has shown notable resilience in recent sessions, with futures holding steady even amid ongoing geopolitical tensions and the breakdown of peace talks between the US and Iran.
On Monday, the index climbed 1.02%, reversing losses tied to the rising Middle East conflict and wiping out declines seen since the war began.
Even though peace talks between the US and Iran collapsed over the weekend, the index regained its ground, showing that investors still have confidence in the market.
President Trump’s remarks that Iran may be open to more talks helped calm some investor fears.
Despite the ongoing conflict, investors are confident in the long-term economic outlook, focusing on factors like company profits and growth rather than short-term political issues. This recovery highlights the market’s ability to adapt and stay focused on what drives economic strength.
Oil Prices Rise Amid Middle East Tensions
While the S&P 500 has remained steady, the oil market has been much more volatile. Brent crude futures fell 1.47% to $97.90 per barrel, while U.S. West Texas Intermediate (WTI) declined 2.35% to $96.75.
These price decreases are driven by rising tensions in the Middle East, especially in the Strait of Hormuz, where the US has started a blockade, tightening oil supply and pushing prices lower.
As tensions in the Middle East continue to affect the oil market, experts are weighing in on the situation. Rusty Hutson Jr., founder of Diversified Energy, provides his insight into the current dynamics driving oil prices that are not fully reflected in the market, suggesting that prices should be trading above $100 per barrel.
Although higher oil prices present challenges for energy consumers, they have boosted energy stocks, which are seeing gains. Despite these fluctuations, the broader market remains focused on economic recovery, maintaining its emphasis on stability and progress.
Tech Outperforms as Energy Stalls
Energy stocks have been strong performers, driven by rising oil prices that boosted expectations for higher profits in energy companies. However, as oil prices stabilise, the tech sector has regained momentum and is now outperforming energy stocks.
The graph below clearly shows the shift in sector performance, with tech stocks surging since March 30, while energy stocks have started to decline. This reversal highlights how tech, which had lagged behind, is now leading the market.
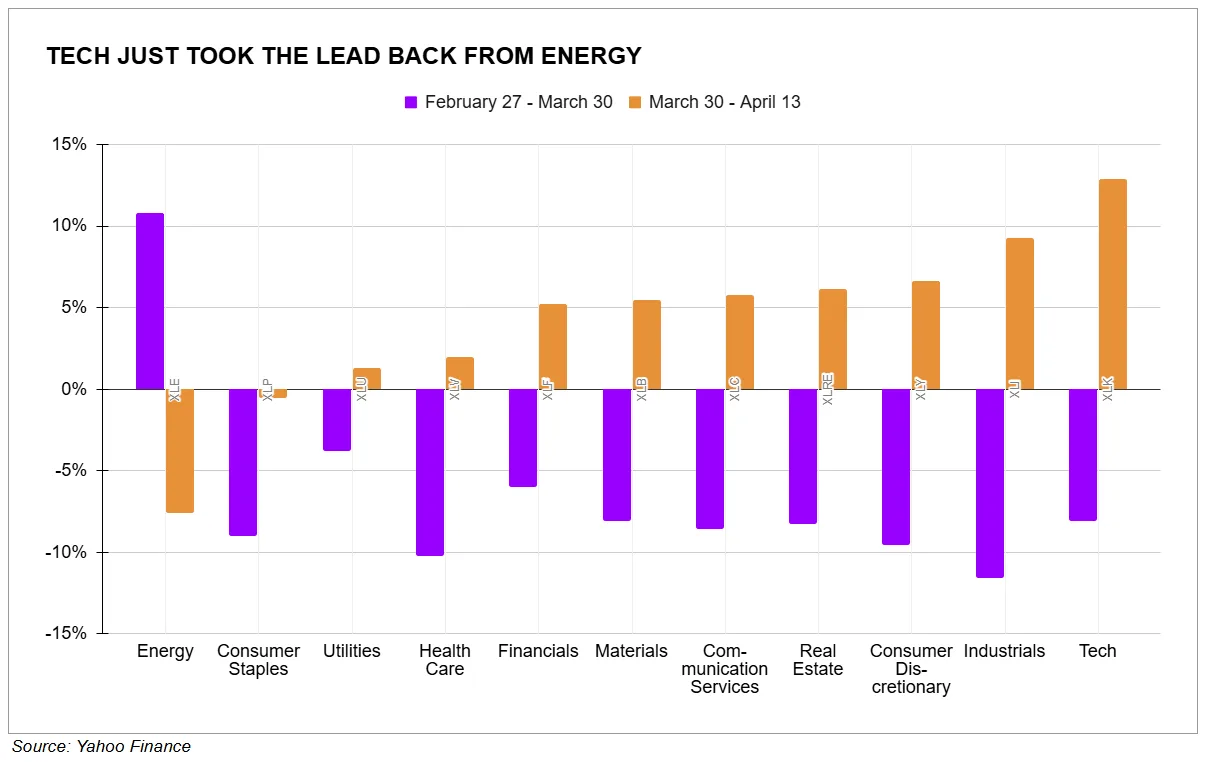
Source: Yahoo Finance
The recent rally in the Nasdaq Composite reflects this shift, with tech making strong gains as investors move back into growth stocks.
Although energy continues to benefit from rising commodity prices, it’s clear that the tech sector has reclaimed the lead, showing a strong recovery despite earlier concerns. This change suggests a return to a more traditional market dynamic, where tech sectors tend to lead during periods of economic recovery.
Earnings Season to Offer New Insights
As earnings season unfolds, the market will carefully scrutinise the results from key financial institutions.
Banks such as JPMorgan Chase, Wells Fargo, and Citigroup are set to report their quarterly earnings this week, offering critical insights into the financial health of the economy and how well the corporate sector is navigating rising geopolitical risks.
The performance of the banking sector is particularly significant this quarter, as investors will be seeking indicators of stability amid global uncertainties.
Goldman Sachs recently reported impressive earnings, with $17.55 per share and $17.23 billion in revenues, surpassing expectations despite challenges.
However, the results were somewhat mixed, as a notable decline in fixed-income trading revenue was counterbalanced by strong gains in investment banking.
With this backdrop, attention now shifts to how other major banks will fare. Solid earnings from these institutions could reinforce the belief that the economy is effectively managing geopolitical challenges, further bolstering the positive sentiment propelling the S&P 500.
Technical Analysis
The index established a local bottom near 6318.04 on March 30. Since then, it has maintained a consistent upward trajectory, characterised by higher highs and higher lows. The current price of 6906.75 is hovering just below the recent peak of 6907.00, suggesting the market is testing immediate resistance.
The MACD indicator shows a bullish crossover that occurred around April 6. While the MACD histogram is currently positive (green bars), the momentum appears to be flattening slightly as the bars get smaller. A tightening of these lines could signal a brief consolidation or a minor pullback before the next leg up.
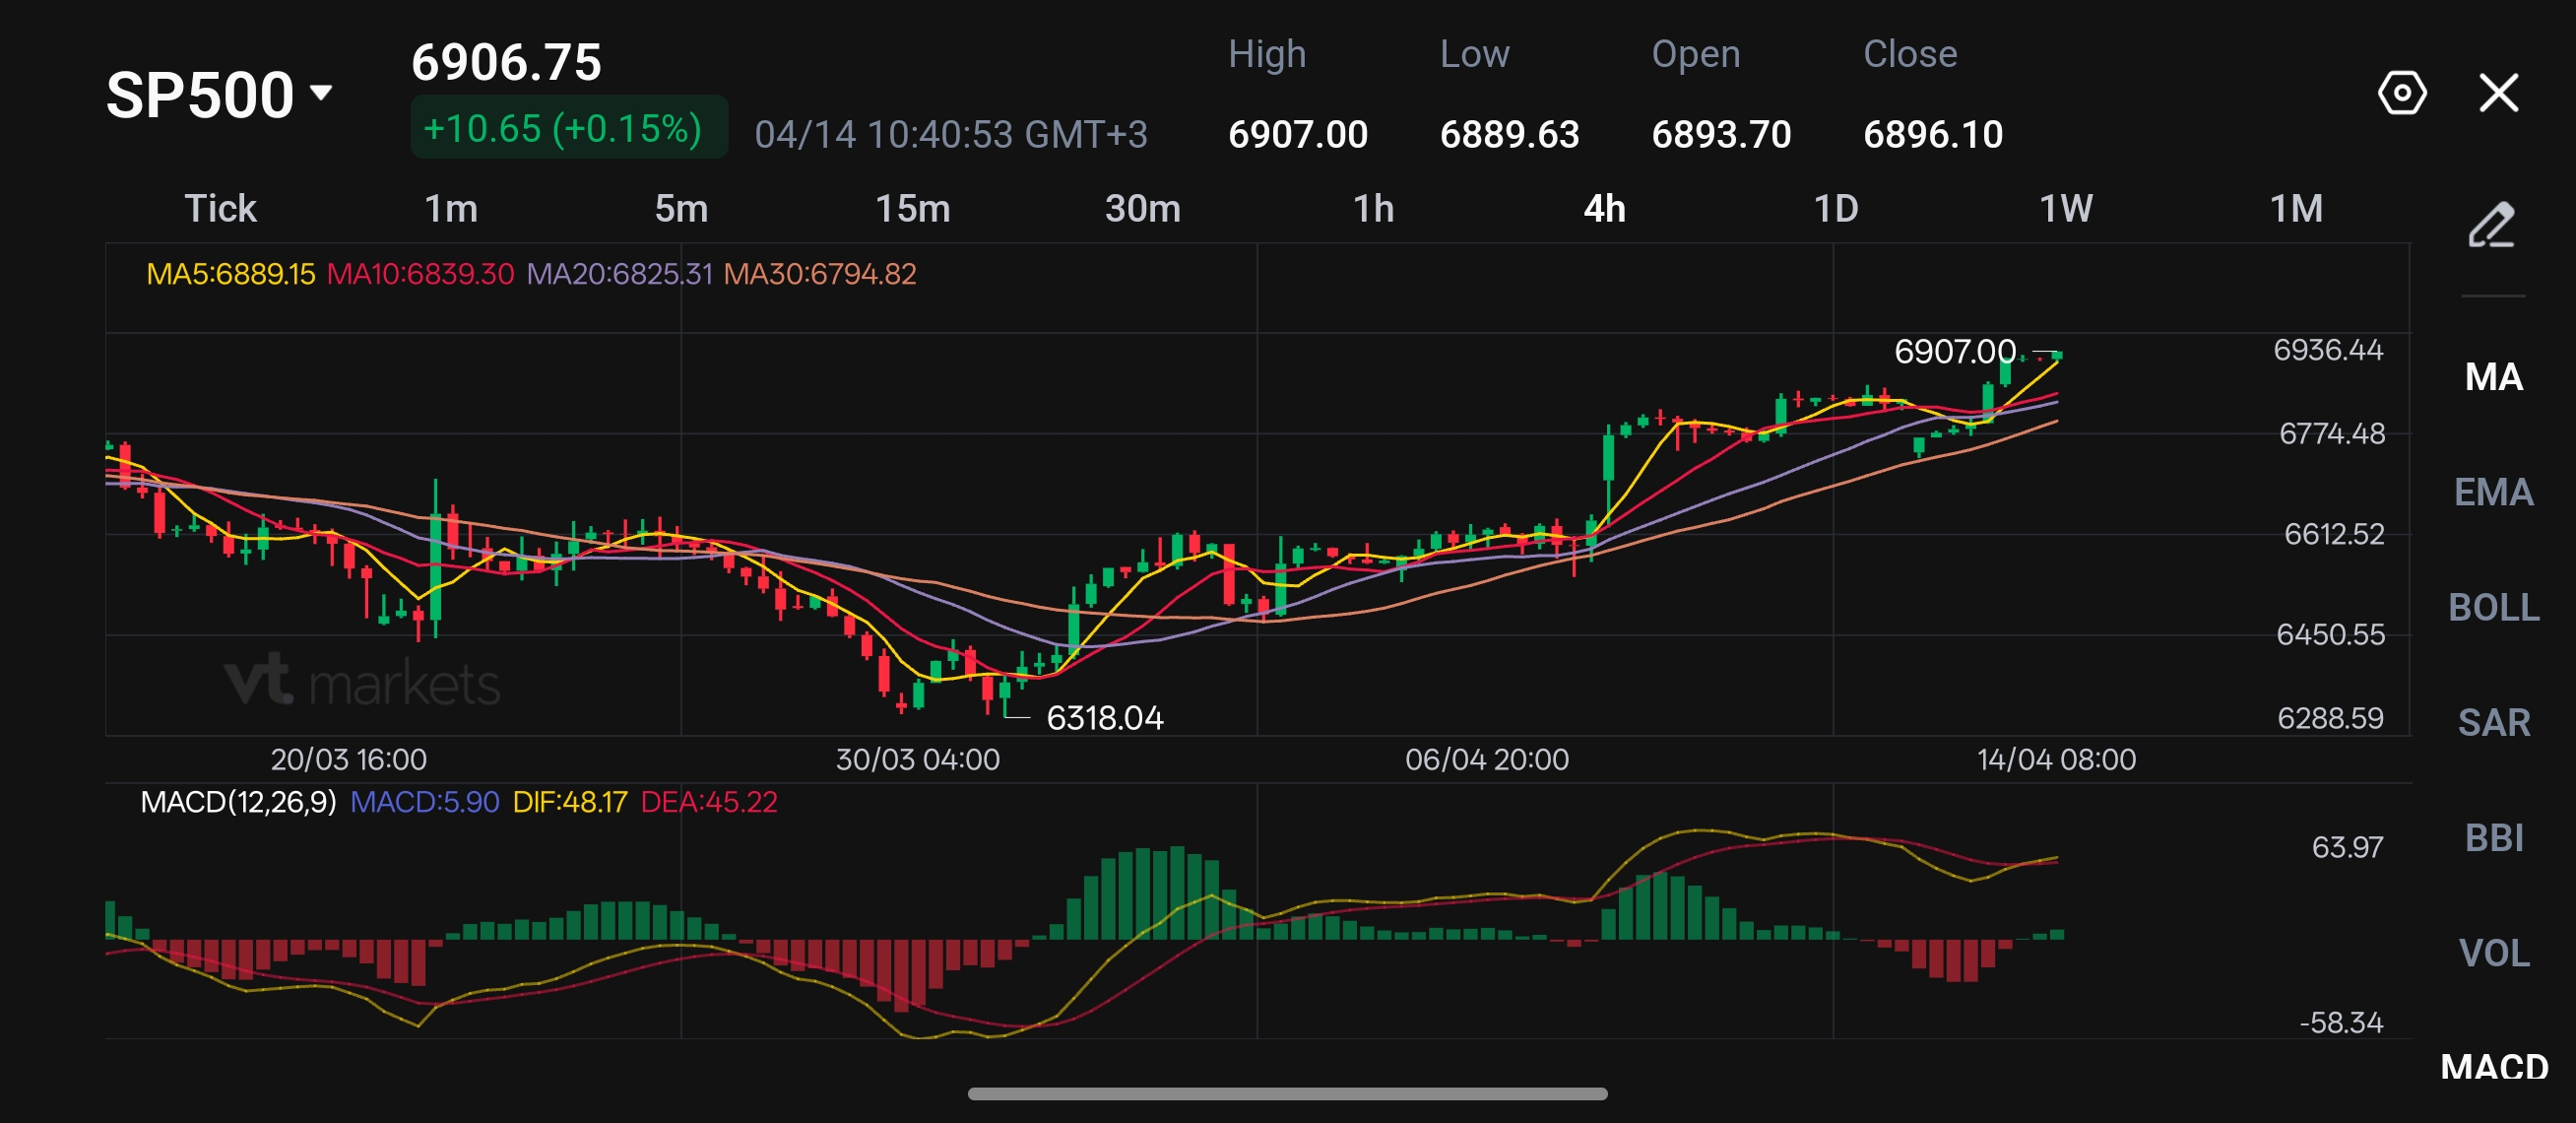
Key Levels To Watch:
- Support: 6889
- Resistance: 7000
What Traders Should Watch Next
The next move for the S&P 500 depends on how the market reacts to the upcoming earnings reports from major banks and whether geopolitical tensions, particularly in the US-Iran conflict, escalate or stabilise.
Traders will also be keeping an eye on oil prices, as any significant changes could influence both energy stocks and broader market sentiment. If tech continues its upward momentum and energy stocks stabilise, the S&P 500 may maintain its gains.
However, if energy prices spike again or geopolitical risks heighten, the index could face challenges holding its current levels.
Learn more about trading Indices on VT Markets today.
Trader Questions
1. Why did the S&P 500 recover even after US-Iran peace talks collapsed?
The S&P 500 recovered because the market believed the conflict might not escalate further. Hopes for renewed US-Iran talks helped reduce panic, while traders shifted their focus back to company earnings, economic strength, and the broader market outlook.
2. How are Middle East tensions affecting the S&P 500?
Middle East tensions are affecting the S&P 500 mainly through oil prices and market sentiment. Rising conflict risk has made the oil market more volatile, but the index has remained relatively steady as traders continue to focus on earnings season and economic resilience.
3. Why are oil prices important for the stock market right now?
Oil prices matter because they influence inflation, energy company earnings, and overall market confidence. When crude prices rise sharply, they can support energy stocks but also raise concerns about higher costs across the economy, which can affect the broader stock market.
4. Why is tech outperforming energy now?
Tech is outperforming energy because market momentum has shifted back toward growth stocks. Energy stocks benefited earlier from rising oil prices, but as that move cooled, traders returned to technology shares, helping the Nasdaq and other growth sectors lead the latest rally.
5. What should traders watch during earnings season?
During earnings season, traders should watch results from major banks and large US companies. These reports can show how strong business activity remains, how companies are handling uncertainty, and whether the current S&P 500 rally has enough support to continue
Start trading now – Click here to create your real VT Markets account