Back

GBP/USD falls to around 1.3405 as safe-haven flows rise amid geopolitical tensions

Rising Tensions and Market Dynamics

The US has launched airstrikes on Iranian nuclear sites, escalating geopolitical tensions. President Trump announced that Iran’s facilities were “obliterated” and warned of more action unless Iran seeks peace. In response, Iran has pledged to retaliate, driving up demand for safe-haven assets. In the UK, retail sales fell by 2.7% in May, reversing a previous increase and putting pressure on the Pound. The Bank of England kept interest rates unchanged at 4.25%, with possible cuts in future meetings due to uncertain economic forecasts. The Pound Sterling is affected by the Bank of England’s policies and economic data. The Trade Balance is another factor that impacts the Sterling by influencing currency strength based on export and import differences. As GBP/USD trades lower around 1.3405 in early Monday sessions, new patterns are emerging that warrant attention. Increased demand for the Dollar, driven by geopolitical risks from US military actions against Iran, has led to higher volatility. This situation often pressures GBP-based pairs during uncertain times.

Impact of Geopolitical and Economic Factors

The recent airstrikes have prompted Washington to intensify its warnings of further military options, while Tehran has vowed to respond. Consequently, markets are pricing in greater instability, which historically benefits the Dollar in times of tension. Although the current pricing of Cable reflects this, there are deeper issues at play. In the UK, the economy experienced a significant drop in consumer spending last month. Retail sales plunged by 2.7% in May, marking a major reversal from previous resilience. This decline puts additional pressure on growth forecasts and complicates future monetary decisions. The Bank of England decided to keep interest rates steady at 4.25% in its latest meeting. However, with slowing growth data and flattening inflation, speculation about a rate cut before summer’s end is growing. Markets have taken notice, with short-term interest rate futures adjusting prices, impacting institutional demand for the Pound in yield-seeking contexts. Later today, the purchasing managers’ index (PMI) reports will be closely monitored by institutional investors. PMI data for both manufacturing and services, covering the UK and the US, can significantly shift market sentiment if they differ from expectations, especially with current tight trading ranges. The market’s reaction will likely set the tone for the week. Moreover, Britain’s trade data remains crucial. A widening trade deficit, whether due to increased imports or declining exports, puts added pressure on the domestic currency. In light of disappointing retail figures, weak trade performance further paints a fragile economic picture that many did not anticipate weeks ago. All this underscores the focus on interest rate direction. If US indicators show continued strength and the Federal Reserve maintains a relatively hawkish stance, the differences in monetary policies between the US and UK will be hard to overlook. In this environment of short-term volatility and data releases, it’s vital to reassess risks and fine-tune exposure. Movements in GBP/USD are now more closely linked to macroeconomic updates than to technical factors. Timing market entries based on high-probability outcomes may yield better results than relying solely on static price levels. This week is expected to remain volatile. Keeping an eye on data releases and geopolitical events is crucial, especially during US afternoon sessions when Dollar trading volumes increase. Currently, the directional trend favors the Dollar, but its persistence will depend more on the length of this wave of risk aversion than on previous price levels. Create your live VT Markets account and start trading now.

here to set up a live account on VT Markets now

Dividend Adjustment Notice – Jun 23 ,2025

Dear Client,

Please note that the dividends of the following products will be adjusted accordingly. Index dividends will be executed separately through a balance statement directly to your trading account, and the comment will be in the following format “Div & Product Name & Net Volume”.

Please refer to the table below for more details:
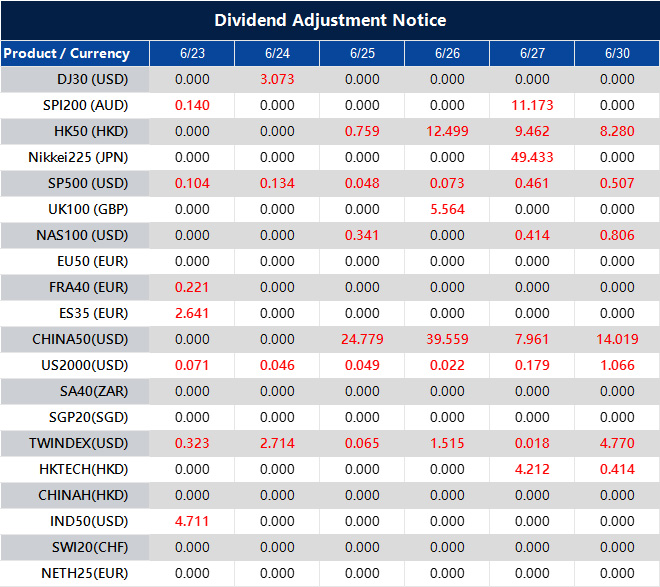
Dividend Adjustment Notice

The above data is for reference only, please refer to the MT4/MT5 software for specific data.

If you’d like more information, please don’t hesitate to contact [email protected].

The People’s Bank of China sets the USD/CNY reference rate at 7.1710, an increase from 7.1695.

On Monday, the People’s Bank of China (PBOC) announced the USD/CNY central rate at 7.1710, up from the previous rate of 7.1695. This is lower than the Reuters estimate of 7.1914. The People’s Bank of China aims to maintain stable prices and exchange rates while fostering economic growth. It also focuses on financial reforms to enhance its financial market.

Influence of the Chinese Communist Party

The PBOC is owned by the People’s Republic of China and is affected by the Chinese Communist Party. The current governor, Mr. Pan Gongsheng, also serves as the Secretary of the CCP Committee. The PBOC uses various monetary policy tools, including the Reverse Repo Rate, Medium-term Lending Facility, and Reserve Requirement Ratio. The Loan Prime Rate is crucial in shaping loan and mortgage rates, as well as the Chinese Renminbi’s exchange rates. China’s financial sector has 19 private banks, with WeBank and MYbank as notable digital lenders. In 2014, China allowed privately funded banks to operate, diversifying its state-dominated financial sector. The PBOC’s setting of the USD/CNY central rate at 7.1710 suggests a careful intervention. Although slightly higher than the previous rate, it’s well below the market expectation of 7.1914. This indicates a subtle effort to counteract depreciation pressures on the Renminbi while managing volatility. A rate below expectations usually signals that policymakers are wary of the yuan weakening too much, especially given the fragile consumer confidence and low export activity. The central bank’s decision shows a desire for stability. Instead of allowing the currency to drop further, they chose a more stable reference point. This can indicate a reluctance to let capital outflow concerns grow or to cause speculative issues. The central rate serves as a guiding tool. When markets receive a lower value than expected, it suggests a careful strategic approach. Gongsheng plays a key role in both policy implementation and party alignment, linking political goals with economic tools. Monetary decisions are generally influenced by domestic targets like GDP and employment, as well as managing systemic risks. The use of policy instruments like the Medium-term Lending Facility and Reverse Repo supports this approach.

Adjustments and Financial Sector Dynamics

Recent cautious liquidity adjustments indicate that while easing may happen, it’s done with consideration of currency pressures. Although there’s ongoing talk of broad stimulus, the actions taken appear targeted, aiming to boost areas like infrastructure lending or support for small and medium-sized enterprises (SMEs) without causing broad inflation. This is evident in the stable Loan Prime Rate, which helps guide borrowing costs for households and businesses downwards. China’s financing model has evolved over time. The emergence of banks like WeBank and MYbank, along with the introduction of privately funded institutions since 2014, shows a willingness for reform. However, these new players still play a peripheral role, with state-linked lenders and policy intermediaries remaining dominant. In this context, any shifts in liquidity or capital flows need careful monitoring. While tools like the Reserve Requirement Ratio could change if growth declines sharply, current strategies focus on measured adjustments. This includes managing expectations regarding exchange rate flexibility, which is vital for exports and offshore derivatives. Practically, this means we should expect currency guidance to be used more openly, especially if foreign exchange reserves decline or trade data falls short of expectations. The Renminbi will likely be kept within specific limits rather than allowing quick, sentiment-driven changes. In the short term, anything related to USD/CNY fluctuations or offshore Renminbi instruments should be approached with caution, as Beijing isn’t ready for sharp disruptions. They appear focused on managing volatility rather than letting the market dictate outcomes. Thus, forward pricing or hedging strategies should account for tighter currency controls rather than unexpected shifts. We should also be alert to where foreign exchange pressures might arise if global sentiment on emerging markets changes. Monitoring signals from official sources and market indicators — especially swap rates and repo spreads — will help us understand how tightly liquidity is being controlled underneath the surface. Create your live VT Markets account and start trading now.

here to set up a live account on VT Markets now

WTI oil price nears $75.50 per barrel after US strikes on Iranian nuclear sites

The price of West Texas Intermediate (WTI) oil went up over 2%, reaching about $75.50 per barrel. This increase is due to U.S. military strikes on three Iranian nuclear facilities, raising concerns about oil supply. U.S. President Donald Trump mentioned that the strikes hit Fordow, Natanz, and Isfahan, coordinated with an Israeli operation. Tensions with Iran could escalate further, as Tehran has promised to retaliate.

Impact Of Potential Closure Of Strait Of Hormuz

Traders expect oil prices to rise even more because of fears that Iran might close the Strait of Hormuz, a crucial route for about 20% of the world’s crude oil supply. Even though there are alternative pipeline routes, a significant amount of oil may remain unexported if access to the strait is blocked. WTI Oil is produced in the U.S. and transported through the Cushing hub. It serves as an important benchmark in the oil market. Prices for WTI Oil can change based on supply and demand, political situations, and global economic factors. Weekly oil inventory reports from the API and EIA also influence prices by showing supply and demand changes. OPEC’s decisions, which involve major oil-producing countries, play a critical role in determining WTI Oil prices. The recent increase in WTI crude oil, which rose over 2% and settled around $75.50 per barrel, is linked to heightened tensions in the Middle East. This tension stems from U.S. and Israeli military actions targeting Iranian nuclear sites in Isfahan, Natanz, and Fordow. President Trump confirmed the strikes, describing them as a strategic response, which raised urgent concerns about oil supply. Iran’s strong condemnation of the attacks and its threat of retaliation poses a real danger to maritime logistics in the region, especially concerning the Strait of Hormuz. This narrow route is essential for transporting nearly one-fifth of the world’s crude oil. Although there are alternative pipeline options, they cannot fully compensate for a potential closure of this key maritime route. Consequently, the oil market is adjusting to this supply chain risk.

Geopolitical Influence On Oil Pricing

We’ve seen this happen before—the markets react quickly when geopolitical events occur in key energy areas. As we move forward, contract holders should watch for changes in oil pricing, specifically looking for signs of increased short supply. If this trend continues over the next week, those positioned for tight supply could benefit. One aspect often overlooked during geopolitical events is how supply chains respond. Even without extended disruptions, market sentiment tends to stay high until political stability returns. This sentiment impacts refining margins and transportation costs, influencing how traders develop strategies around fuel derivatives and energy-related indices. Weekly inventory data from the API and EIA can provide temporary insights into domestic supply, but they likely won’t overshadow the broader geopolitical factors at play. For instance, last week’s unexpected drop in commercial stocks was largely ignored as traders focused more on long-term risks rather than short-term supply adjustments. Regarding policy, OPEC’s decisions will be under close observation. Their production quotas, especially from Gulf countries, may be revised if regional shipping faces new challenges or insurance costs rise. They might be willing to help address global supply imbalances, though any changes could lag behind spot market shifts. Since WTI is settled at the Cushing delivery point, it’s also important to consider how much crude from the Gulf Coast is redirected inland. This could widen the Brent-WTI spread again, creating opportunities for arbitrage or different hedging strategies. Pay attention to any significant build-up in Gulf inventories, which may ultimately affect price differentials. As traders adjust their positions using options and swaps, we see that volatility pricing is already indicating higher uncertainty in the future. Traders are reevaluating costs for near-date crude options, which are seeing price increases. There’s also a rise in AI-generated alerts for refining operations as companies respond to this price spike. In addition to traditional supply-demand analytics, keep an eye on freight rates, insurance costs, and geopolitical risk indices—data increasingly integrated into quantitative models. These factors can influence trading positions on ICE and CME-linked energy contracts and impact overall market liquidity. Create your live VT Markets account and start trading now.

here to set up a live account on VT Markets now

Week Ahead: Healthcare Bets Back On The Table

Healthcare shares are typically viewed as a defensive stronghold in turbulent times. Yet, the past year defied this expectation. The sector tumbled 29%, making it the worst performer across all S&P 500 categories. This surprising downturn has prompted traders to ask: What exactly went wrong, and could this pullback present an opportunity?

In general, healthcare firms fare well even during economic slowdowns. People continue to require medications, medical equipment, and hospital care regardless of economic conditions. With an ageing global population and rising incidences of chronic illnesses, demand for healthcare remains structurally strong.

However, despite these favourable long-term trends, the healthcare sector came under pressure over the past 12 months.

A primary driver of the decline was surging costs, particularly for large firms like UnitedHealth Group (UNH). Post-pandemic, more patients, especially older individuals, sought medical services than expected. This led to a rise in medical expenditure, compressing profit margins. Concerns deepened when UnitedHealth’s CEO stepped down, followed by the company cutting its earnings outlook for the year.

Even so, UnitedHealth continues to post solid top-line growth. Revenues climbed beyond $400 billion in 2023, although elevated costs have weighed on profits. Looking ahead, the firm aims to recalibrate premium pricing and rein in expenses to restore earnings momentum.

Its financial fundamentals remain robust. UnitedHealth benefits from strong cash flow to support dividends and operations. That said, traders should monitor its increasing debt load, which reached $76.9 billion, well above levels seen ten years ago. While debt-funded expansion may be strategically sound, prudent debt management remains essential.

For traders, UnitedHealth shares currently appear undervalued. With an intrinsic value estimated around $570 per share, its forward price-to-earnings ratio of 13.2 looks appealing. If cost controls succeed, its stock could rebound once temporary pressures abate.

Meanwhile, Novo Nordisk presents a contrasting picture. The Danish pharmaceutical powerhouse recorded strong revenue gains, primarily driven by its high-demand diabetes and weight-loss treatments. Profit margins stood at a remarkable 48%, outpacing many healthcare peers.

Nonetheless, Novo Nordisk faces risks stemming from lofty market expectations and reliance on regulatory approval of new drugs. Rising competition, particularly from Eli Lilly, could also challenge its future dominance.

In 2023, Novo increased its debt to over $14 billion after acquiring three Catalent manufacturing sites. While the move enhances production capabilities, it also introduces financial risks. However, Novo’s cash flow remains sufficiently strong to fund dividends and strategic investments.

Importantly, the company’s Return on Invested Capital (ROIC) consistently exceeds its cost of capital, an indicator of sound management. Analysts place its intrinsic share value at approximately $150, well above its current trading price of $80. Despite a higher forward P/E of 19.5, the valuation is justified given Novo’s superior growth outlook.

Given today’s macro backdrop, healthcare stocks could start drawing fresh attention. Ongoing trade tensions, persistent inflation, and waning global growth may remind investors of healthcare’s defensive appeal.

While the sector has recently faltered, underlying demand remains intact. For some traders, the current weakness could represent a prudent re-entry point.

Nonetheless, investors should remain vigilant to firm-specific risks, such as UnitedHealth’s mounting debt and Novo Nordisk’s regulatory exposure. Still, with attractive valuations and strong fundamentals, healthcare may gradually regain favour over the coming months.

Market Movements This Week
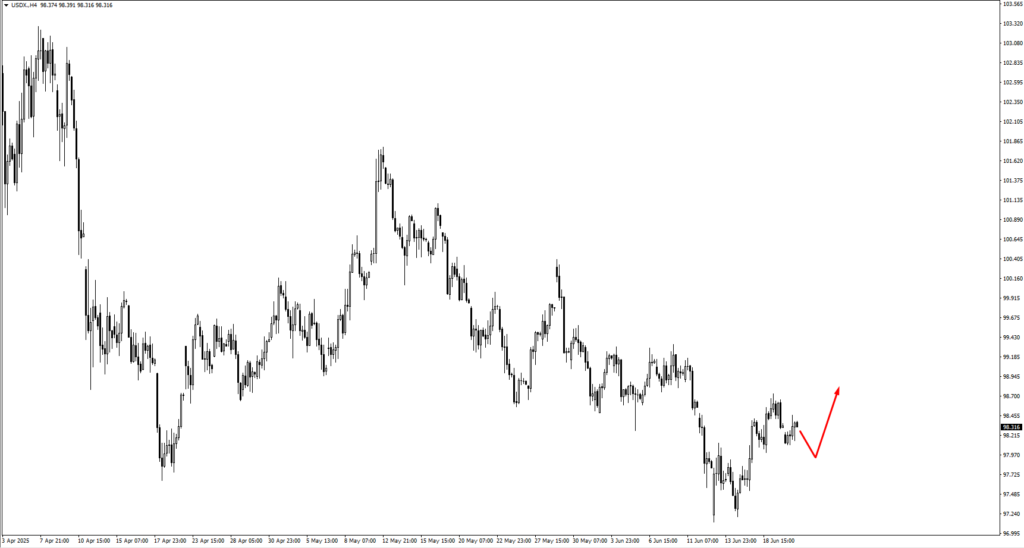
The US Dollar Index (USDX) recently rebounded from the 98.20 region but struggled to attract committed buyers. If this hesitation continues, the index could soften before attempting another move higher. Watch closely for potential support near 97.70. Should strength return, the next resistance lies around the 99.00 level.

EURUSD has broken above 1.15297, signalling possible upside momentum. However, resistance near 1.1550 may cap further gains. If prices retreat, keep a close eye on support around 1.1420.

GBPUSD encountered firm resistance near the 1.3510 zone. Traders should closely monitor for bearish signals around 1.3485, particularly if the market consolidates at current levels. In the event of further upward pressure, 1.3560 would become another critical resistance area. Conversely, downside movements will test supports around 1.3360 and possibly 1.3315.
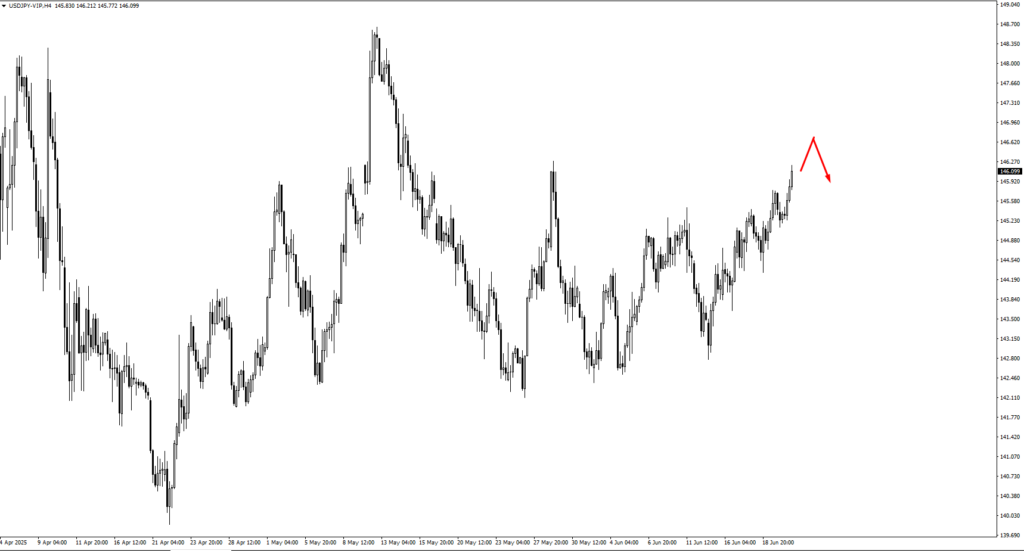
USDJPY continues to move higher after pausing near resistance around 145.75. Potential bearish pressure may re-emerge around the 146.55 area, an important zone to monitor in upcoming sessions.

USDCHF currently sees limited selling activity around 0.8220. Prices could edge higher, targeting the 0.8200 level, but any new upward swing would likely invite fresh bearish activity at the 0.8220 level once again.

AUDUSD faces stiff resistance at the closely monitored 0.6500 zone. A critical test will be the upcoming encounter with its underlying trendline. Traders should be ready for decisive price action once this occurs.

NZDUSD has recently declined from the 0.6025 resistance area. Further downside pressure could test levels around 0.5940 or even down to 0.5900, presenting critical zones to watch for potential reactions.

For USDCAD, the 1.3715 area provided only minor resistance, suggesting upward momentum remains possible. Traders should carefully observe price actions approaching the next critical zone at 1.3795.
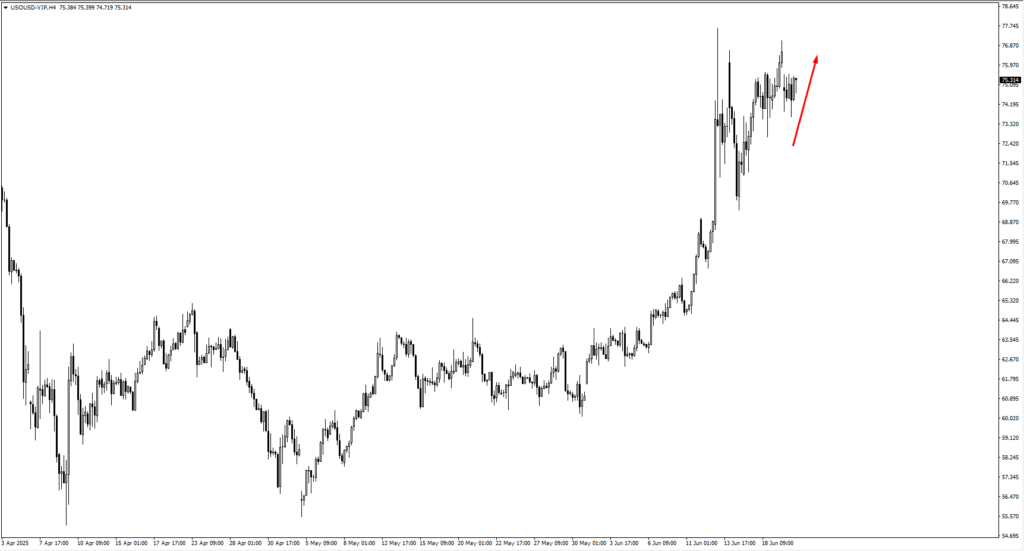
Turning to commodities, US crude oil remains volatile amid escalating geopolitical tension between the US and Iran. The next resistance to watch lies around the 83.90 mark.
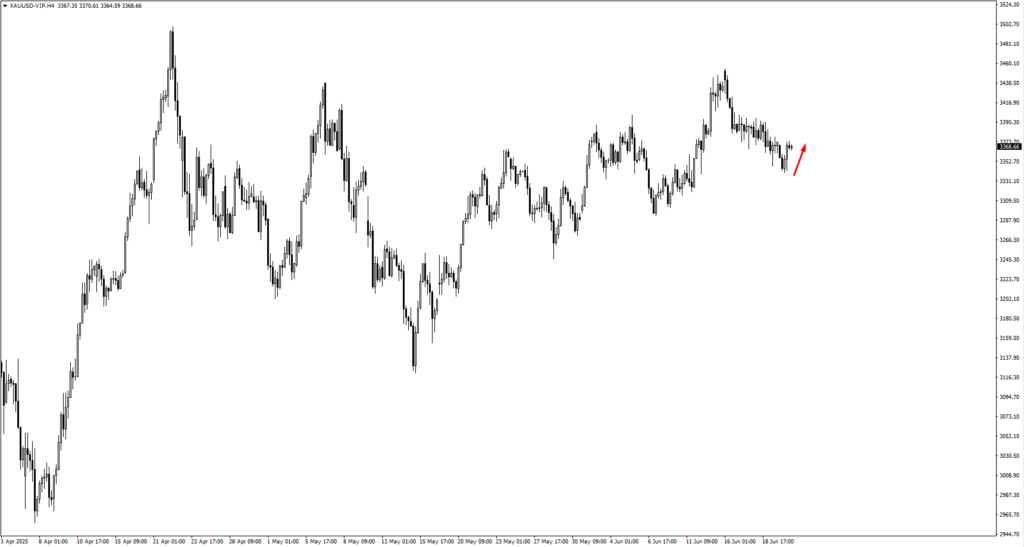
Gold has stabilised at support near 3330, and upward momentum could see a test of resistance at 3410.

As for indices, the S&P 500 remains under pressure in light of geopolitical unrest. Key support to watch is the 5810 area.
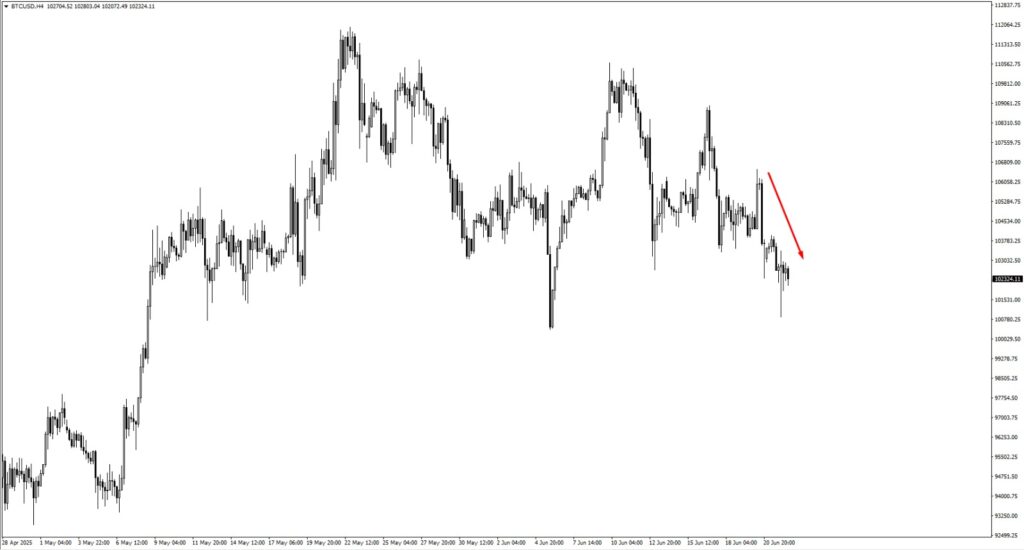
In cryptocurrency markets, Bitcoin (BTC) declined sharply from the 106825 area, subsequently breaking below the 103358 support. The ongoing geopolitical tensions involving the US and Iran could intensify pressure on Bitcoin. If the critical low at 100396 breaks, traders should anticipate deeper consolidation or further downward moves.

Finally, Natural Gas prices sharply retreated after nearing the resistance at 4.06. Further consolidation at current levels could push prices toward a lower critical support zone at 3.57. Traders should watch for clear signals at this level for directional guidance.

Key Events This Week

On Monday, 23 June, attention turns to the Eurozone. Germany’s Flash Manufacturing PMI is forecast to edge up to 48.9 from 48.3, while Services PMI is projected to rise to 47.8 from 47.1. This slight improvement could offer the euro some support to start the week.

In the UK, expectations are for a small increase in Flash Manufacturing PMI to 46.9 (from 46.4), and Services PMI to tick up to 51.2 from 50.9. Better-than-expected readings may offer sterling a modest lift early in the week.

In the US, PMI data suggests a slightly softer outlook. Flash Manufacturing PMI is expected to fall to 51.1 (from 52.0), and Services PMI to 52.9 (from 53.7), potentially exerting downward pressure on the US dollar index.

On Tuesday, 24 June, Canada’s CPI (m/m) is forecast to rise by 0.5%, reversing last month’s -0.1%. This could initially push USDCAD higher, though a retracement may follow soon after.

Come Wednesday, 25 June, Australia will release its annual CPI figure, expected to remain steady at 2.4%. Traders should pay attention to the prevailing price structure around this event.

By Thursday, June 26, the US Final GDP quarterly data will be reported, holding steady expectations at -0.2%. This unchanged forecast prompts traders to focus closely on market structure and price patterns rather than expecting major volatility from this data alone.

Lastly, Friday, June 27, brings the US Core PCE Price Index monthly figures, expected unchanged at 0.1%. Like previous events, market participants should reference existing technical structures and cautiously gauge market reactions accordingly.

Overall, these economic updates provide crucial insights, helping traders navigate currency and equity markets with informed caution this week.

Create your live VT Markets account and start trading now.


Yuan reference rate set at 7.1710, lower than expected 7.1914.

The People’s Bank of China (PBOC) is in charge of setting the daily midpoint for the yuan, or renminbi (RMB). It uses a managed floating exchange rate system that allows the yuan to fluctuate within a range of +/- 2% around a central reference rate. Recently, the yuan closed at 7.1820. To manage liquidity, the PBOC added 220.5 billion yuan through 7-day reverse repos with an interest rate of 1.40%. Since 242 billion yuan is maturing today, the net effect is a decrease of 21.5 billion yuan from the system. This action shows the PBOC’s continued efforts to control and stabilize the currency market. This update highlights the PBOC’s current monetary actions, which aim to adjust liquidity in short-term lending while guiding the yuan’s value. Each day, when the People’s Bank sets its reference rate, it acts as a daily benchmark, helping keep market fluctuations in check. Although the exchange rate system appears market-driven, it is closely managed within narrow limits. A key point in this report is the reduction of overall liquidity through short-term reverse repos. The net withdrawal of 21.5 billion yuan, while not large, indicates a tighter control on cash markets. This deliberate move suggests that the PBOC wants to prevent excessive easy money from flowing freely, which could help slow down any depreciation of the renminbi. Zhou and the PBOC team clearly aim to keep the currency stable without causing market disruptions. Rapidly weakening the yuan could lead to unwanted capital outflows and complicate inflation management. However, keeping it too strong might hurt exporters already facing weak global demand. The PBOC is carefully steering the situation in a measured way. For those looking at market speculation, it’s important to consider the effects of tighter repo flows and the meaning behind short-term interest rate choices. A 1.40% return on 7-day repos may not seem significant on its own, but the direction is more important than the amount. If liquidity is tightening slightly, it could influence expectations around interest rate differences. Future actions should be viewed in light of these changes. Anything sensitive to exchange rate fluctuations or short-term funding conditions needs close attention. If Beijing decides to tighten liquidity or change policy guidance, it will likely impact options pricing. Traders should be careful not to assume straightforward shifts—especially with this central bank, it’s better to anticipate adjustments rather than bet on extremes. Timing is crucial; carry costs and forward pricing will adjust before spot rates shift from current levels.

here to set up a live account on VT Markets now

Analysts warn against being overly optimistic, noting ongoing risks in maritime transport through the Strait of Hormuz.

RBC analysts advise being careful when assessing the risks to maritime transport through the Strait of Hormuz. They highlight Iran’s ability to target individual tankers and ports. Their analysis shows that disruptions can happen without a complete halt to operations. The market might not fully recognize these extra risks. RBC recommends being patient. It could take days or weeks to see how Iran will respond. They caution against thinking the problems are resolved.

RBC Initial Assessment

RBC’s initial assessment takes a careful approach, noting vulnerabilities in shipping that the market may overlook. They emphasize that threats to ship safety and port operations can occur without a total shutdown. This is important for pricing models that expect clear outcomes. Iran can disrupt maritime activities in smaller, unpredictable ways, which could still strain supply chains and increase freight rates. Given this context, it’s wise to avoid becoming complacent. Traders who react only to major news may miss the broader picture, which includes indirect actions, like targeting individual ships or logistics centers. These actions might not cause immediate price spikes but could reduce confidence in route reliability and impact how derivative positions are structured over time. The key takeaway is to stay flexible, avoid overcommitting in any direction, and prepare for a steady flow of information rather than a quick resolution. Volatility may appear sporadically based on how the situation unfolds. Changing exposure based on incomplete data, especially with staggered geopolitical actions, is reactive. This strategy can work in bursts but is difficult to maintain and risky if misjudged.

Options Pricing Strategy

From an options pricing view, implied volatility might not fully incorporate tail risks—leaving room for adjustments as new developments arise. Traders should keep delta exposure light, consider straddles or risk reversals for greater flexibility, and avoid leaning too heavily toward one side. A lack of complete disruption doesn’t remove the chances of rising costs, route inefficiencies, or insurance complications, all of which affect pricing models, whether recognized or not. Additionally, the call for patience is not about being inactive; it’s a suggestion to wait for better opportunities. There’s a temptation to react quickly after initial reports, but past events show that slow engagement and irregular updates from state actors can last well beyond initial headlines. This doesn’t favor sharp expiration profiles or narrow spread bets. In conclusion, pacing is more valuable than predicting. It’s easier to navigate a turbulent situation with options that offer flexibility instead of locking into a single scenario. Create your live VT Markets account and start trading now.

here to set up a live account on VT Markets now

Preliminary June 2025 data shows Japan’s manufacturing PMI at 50.4, services PMI at 51.5, and composite PMI at 51.4.

In June 2025, Japan’s Jibun Bank reported that the preliminary PMI for manufacturing rose to 50.4, up from 49.4. This rise suggests growth in the manufacturing sector, as values above 50 indicate expansion. The services PMI also climbed to 51.5, compared to the prior 51.0. The composite PMI, which includes both manufacturing and services, increased to 51.4 from 50.2. These numbers show a general improvement in Japan’s economic activity in both the manufacturing and service sectors. The recent increase in Japan’s purchasing managers’ index (PMI) suggests a slight but clear recovery in economic activity. The manufacturing PMI crossing above 50 is the first sign in months that output is growing instead of shrinking. While the rise from 49.4 to 50.4 might seem small, it is significant. It indicates renewed energy in factory production and supply chain orders, even though this momentum is still fragile. In the services sector, the increase to 51.5 from 51.0 shows steady progress. Demand for services that do not involve physical goods, like transport, hospitality, and finance, is slowly rising. Looking at the composite PMI of 51.4, there is synchronized improvement across both major areas of Japan’s economy. These readings suggest that a shift is happening, but it’s not a smooth process. Volatility in interest rate expectations and different global monetary policies mean that any new data can impact markets in unexpected ways. Traders should carefully consider the implications of these changes. A shift from contraction to growth, even slight, can alter perceptions of future growth. This could change pricing for instruments linked to regional stocks or JPY Forex crosses. Any sign of stronger industrial output could also affect the options market, leading to changes in implied volatility and delta calculations. The timing of this data release, coming before significant central bank meetings in the US and Europe, might prompt a re-evaluation. Policymakers in other regions may see Japan’s slight improvement as a sign that demand patterns are becoming more synchronized globally. This could lead to adjustments in interest rate expectations. We may also see changes in forward curve pricing in response to these figures. A rising PMI might lead to revisions in growth expectations reflected in swaps and futures contracts. The gap between short-term rates and long-term rates may start to change slightly if general optimism solidifies. However, it’s important to note that these changes are modest. A single reading isn’t enough to alter long-term views, but movements around the 50-mark are more impactful than similar shifts in other contexts. The crucial point is that these changes suggest underlying resilience and could provide a basis for future positive surprises. Looking ahead, how market participants respond to economic signals from other regional economies will be crucial. If manufacturing improves not just in Japan but also in other export-focused countries, this could enhance the current upward trend. Positioning in the market may need reassessment, particularly for those holding delta-neutral or volatility-based strategies tied to regional indices or JGB-linked derivatives. Pay attention to skew adjustments in shorter-term options, as pricing could start to favor upward movements if data released in early July confirms these initial trends. Ultimately, those who read the signals carefully may need to act swiftly, as consensus views may lag behind. Timing is key. Confidence may not recover smoothly, but markets frequently move ahead of public sentiment.

here to set up a live account on VT Markets now

Goldman Sachs predicts oil prices could surge to $110 per barrel due to risks

Goldman Sachs has outlined possible scenarios that could lead to higher oil prices. While there’s no current expectation of significant disruptions in oil and natural gas supplies, future risks could still impact energy prices. One significant risk is the Polymarket prediction of a potential disruption in the Strait of Hormuz by Iran in 2025. If Iran’s supply drops by 1.75 million barrels per day, Brent crude oil prices could rise to about $90 per barrel. If there are additional disruptions that cut oil flow through the Strait by 50% for one month and then reduce it by 10% for the next eleven months, prices could briefly hit $110.

Impacts On European Natural Gas Markets

The report mentions that European natural gas (TTF) and LNG markets could react to a higher risk of supply disruptions. TTF prices could jump to 74 EUR/MWh or $25/MMBtu. Goldman Sachs details market scenarios in case oil supply interruptions occur, especially due to geopolitical tensions in the Middle East. Currently, supplies are stable, but the balance between demand and geopolitical risk is delicate. A key worry arises from Polymarket’s inference that Iran might disrupt navigation through the Strait of Hormuz in 2025. This strait is crucial, as it handles a large portion of global oil exports. A significant drop in Iranian exports—like a decrease of 1.75 million barrels per day—would send Brent crude prices near $90 per barrel. This isn’t just a guess; it’s based on past market reactions to similar supply constraints. Even more troubling would be if half of the Strait’s exports were halted for a month, followed by a 10% reduction for almost a year—possibly pushing crude prices up to $110. Natural gas is also part of the analysis. The European TTF benchmark could be affected; disruptions in LNG supply might push TTF to €74 per megawatt hour, or about $25 per million BTU. Europe’s reliance on LNG has grown, especially after reducing dependence on Russian pipeline gas. This means prices are more sensitive to logistics and shipping issues, even if demand stays steady.

Strategic Adjustments And Monitoring

What can we learn from this? For short-term trading strategies based on price derivatives, it’s crucial to consider potential volatility linked to geopolitical events rather than just market fundamentals. Options pricing may rise with any escalation in regional tensions or risks affecting the Strait’s passage. This volatility, which had been declining, might widen again. Gas-related contracts will need careful tracking of global LNG movements and storage levels. Any signs of congestion at LNG terminals or delays in tanker transit could quickly shift market balances. Watch for weather-related disruptions in key areas like the Suez or Panama Canals. Traders should be adjusting their exposure as summer cooling demand approaches, factoring in risks for later-month contracts. Short-term positions might stay stable unless explosive events happen sooner than expected. Political developments and valid shipping warnings require ongoing attention. The market is currently expecting stability, but there’s a defined range where this assumption might falter. Volatility hasn’t vanished; it’s just been repriced. Meanwhile, differences in crude benchmarks or LNG hubs could present trading opportunities. Positioning across markets might be more appealing if Brent and WTI react differently to shipping risks in various areas. Also, monitoring gas contracts in Asia could help gauge demand, especially if it begins pulling cargoes eastward, tightening balances in Europe before autumn. Overall, staying flexible in response to uneven risk scenarios is not just advisable—it could determine trading success. Create your live VT Markets account and start trading now.

here to set up a live account on VT Markets now

Reuters reports that the PBOC is expected to set the USD/CNY reference rate at 7.1914.

The People’s Bank of China (PBOC) is the central bank that sets a daily midpoint for the yuan, also known as the renminbi (RMB). This system uses a managed floating exchange rate, allowing the yuan to fluctuate within a specific “band” around a reference rate. Every morning, the PBOC determines the yuan’s midpoint based on a basket of currencies, primarily the US dollar. This midpoint is affected by market supply and demand, economic indicators, and trends in international currency markets. The trading band permits the yuan to shift within +/- 2% of the midpoint. This means the yuan can rise or fall by up to 2% from the midpoint during each trading day. If the yuan approaches the band limits or shows excessive volatility, the PBOC may step in. They can buy or sell the currency to stabilize its value, helping to control its fluctuations. This system allows the PBOC to guide the yuan’s direction while still giving the appearance of a market-driven rate. The daily midpoint adjustments reflect short-term currency trends without losing overall control. Traders expect this mixed approach — a visible anchor with hidden limits. When the yuan nears the band limits, it often leads to speculation about possible intervention. This speculation can cause short-term fluctuations and increased trading volumes, especially in offshore markets where reactions can be swift. In the past, central bank actions have not only affected the yuan directly but also had broader impacts on risk indicators in Asia. Recently, the midpoint settings have shown a consistent pattern that doesn’t match market expectations. The reference rates have been stronger than what spot markets suggest, indicating that authorities are trying to prevent depreciation. This is typically seen as a policy choice to maintain currency stability, possibly to reassure foreign investors or manage capital outflows. We see this as a call for careful risk management during times of cash flows in Asia. For those involved in currency derivatives, like options or non-deliverable forwards, the key focus is not just on levels but on the trends and consistency between official rates and market quotes. We’re closely monitoring this gap, as it indicates intent — traders should be cautious of straying from it. A series of stronger fixes can influence implied volatility, especially if traders decide to unwind dollar-long positions. Chen’s recent comments about keeping yuan flexibility while maintaining a solid anchor reinforce this approach. While the rhetoric was calm, the message was clear: short-term fluctuations are acceptable, but they are actively working against long-term depreciation. This implies that positions heavily betting on yuan weakening might be at risk in the coming weeks. Market depth has also been thinner than usual during early Asian trading hours, which makes pricing more prone to sudden changes. Those using leveraged strategies may need to reevaluate their hedging thresholds, as assuming volatility will stay low could be a mistake, especially if official guidance continues to differ from current realities. We are closely examining the basket composition and trade-weighted references, particularly with recent weakness in the euro and yen. If the central bank starts focusing less on dollar parity and more on overall competitiveness, this could change expectations on how the midpoint is managed. That adjustment may also impact curve spreads during times of low liquidity. Finally, it’s noteworthy that domestic corporates are shifting back towards hedged exposures in the onshore forward market. This subtle signal, often missed, combined with a firmer fixing tone, suggests a lower tolerance for one-sided market trends. This indicates we should keep our positions flexible and limit bias until we observe clearer patterns in the daily midpoint adjustments.

here to set up a live account on VT Markets now

Back To Top
Chatbots