The People’s Bank of China keeps the Loan Prime Rate steady, meeting market expectations and promoting stability
The People’s Bank of China has kept its 5-year Loan Prime Rate at 3.50%, which matches expectations and last month’s rate. Likewise, the 1-year Loan Prime Rate remains at 3%, consistent with forecasts and the previous month.
Last month was the first time the Loan Prime Rates were cut since October. The 1-year rate went down from 3.1% and the 5-year rate fell from 3.6%. Additionally, the 7-day reverse repo rate was reduced by 10 basis points to 1.4% earlier that month. This shows that Loan Prime Rates are becoming less important as tools for monetary policy.
The People’s Bank of China is now concentrating on the seven-day reverse repurchase agreement rate as its main tool for monetary policy. This shift started in mid-2024 and aligns China with global practices. Major institutions like the U.S. Federal Reserve and the European Central Bank typically rely on a single short-term policy rate to manage market expectations and liquidity.
The People’s Bank of China has chosen to keep rates steady for now, resisting pressure to make further cuts soon. This decision follows last month’s unexpected rate decreases, which gave the market a brief boost. While unchanged 1-year and 5-year Loan Prime Rates may seem like inaction, they likely indicate a careful recalibration.
Zhou’s bank has shifted its attention from the longer-term Loan Prime Rates, which were once used to influence broader credit costs. By stabilizing these rates, it suggests that the phase of broad credit easing is paused, not abandoned. Meanwhile, the 7-day reverse repo rate has become the main tool for managing market liquidity and communicating policy intent. With this shorter-term rate already adjusted last month, it aligns more closely with strategies used by major Western central banks.
The key takeaway is this focus on short-term rates. This strategy emphasizes flexibility and precision. Short-term tools allow policymakers to respond quickly to domestic conditions without changing broader rate benchmarks. When the focus is on overnight or seven-day tools, it usually signals an aim to keep markets well-supplied with cash instead of aggressively addressing slow demand.
If current rates remain unchanged, capital costs across various periods should not see surprises. However, the shape of the rate curve may shift slightly, especially with ongoing liquidity injections in the market. Recent data from China does not suggest an urgent rise in inflation or credit demand, so there is no expectation for aggressive tightening at this time. Instead, we might observe gradual adjustments around liquidity, as authorities seek to avoid sudden changes in funding conditions.
Economic charts from the last six months show limited fluctuations. While the policy approach is stable, it may be hiding concerns about weaker domestic demand. This could lead cash-rich institutions to explore slightly riskier options, especially if forward guidance remains stable for too long.
Traders should watch for minor changes in liquidity tools and monitor interbank funding pressures closely. An increase in repo volumes or small rate changes could indicate subtle shifts in direction. Even though headline rates remain steady, the underlying message may still evolve. Changes often begin quietly before they are obvious.
If trading structured options or futures tied to short-term rates, observing overnight SHIBOR and repo market trends might provide clearer signals than the prime rates themselves. These small movements show real-time demand for cash and can indicate the central bank’s level of comfort with current liquidity. The appeal of short-dated instruments may stay strong unless there is an unexpected reversal in flows.
As a practical strategy, monitoring the spread between short-term and medium-term instruments could give early signals. If tighter repo windows appear, that would be a more dependable indicator than any carefully crafted press release. The PBOC’s communication isn’t always straightforward, so market responses can provide insight into institutional thinking.
The time of long forward rate guidance in China seems to be fading. We’re now in a period where even small moves are significant. Whether this is a chance or a warning—well, it depends on your perspective.
Gold prices in India have declined, according to recent data analysis from various sources.
Gold prices in India fell on Friday. The cost per gram decreased from 9,388.94 INR to 9,341.84 INR. A tola of gold also saw a drop, from INR 109,510.80 to INR 108,961.30.
Gold is commonly bought as a safe investment and a way to protect against inflation. Central banks, especially in emerging economies, are significant buyers and acquired 1,136 tonnes in 2022.
Gold’s Relationship with Other Assets
Gold typically moves in the opposite direction of the US Dollar and US Treasuries. When these assets lose value, gold often increases. Its price is affected by global events, interest rates, and shifts in currency values, notably the US Dollar. Pricing is based on adjusting international rates to the Indian Rupee and local standards. Although prices change daily, there may be slight differences from local rates. Factors like market conditions and currency exchanges influence gold prices, so thorough research is essential before investing. The recent decline in gold prices, seen in both per-gram and per-tola rates, may be a response to broader economic changes, particularly the strengthening of the US Dollar and stable Treasury yields. As gold usually moves against these trends, this dip follows typical patterns. Those monitoring price movements for short-term trading should assess whether this drop is just a pause or signals a trend change in the coming weeks. Historically, central banks in non-Western countries have accumulated gold, and the addition of 1,136 tonnes in 2022 was intentional. Policymakers recognize gold’s defensive advantages. This institutional demand tends to be focused on the long term and does not directly affect daily prices but can provide support during deeper declines. However, unless there’s an outside shock, this demand won’t significantly impact short-term price movements.Impact of Exchange Rate Changes
Exchange rate volatility is also important to consider. When the Rupee weakens, even steady or slightly falling international prices can lead to higher local prices. Currently, domestic rates are decreasing, suggesting either a stable or stronger Rupee or a sharper decline in global prices compared to exchange rates. We need to closely follow central bank statements and US macroeconomic updates to see if this trend continues or reverses. Price movements related to the Dollar are a key factor. If data continues to indicate a tight monetary policy in the US, then a hawkish stance from Washington could further suppress non-yielding commodities. A cautious approach might involve gradually entering the market rather than expecting immediate support. There’s no gain in overcommitting when key support levels haven’t been tested adequately. Additionally, geopolitical factors can create volatility in precious metals. Upcoming elections and possible international tensions should be monitored. While they may not immediately affect gold prices, they can trigger sharp reactions if risk sentiment changes. During such times, liquidity and leveraged positions can lead to unpredictable price behavior, impacting spreads and pricing during off-hours. It’s better to refine entry points rather than react impulsively. Indian gold prices reflect more than just global rates; local premiums, taxes, and spikes in consumer demand — especially during festivals or seasonal changes — should be taken into account. While these factors can offset broader trends, current seasonal demand isn’t strong enough to counter external pressures. Patience is key; wait for signs of stabilization or capitulation before adjusting your strategy. Recent data suggests we are in a phase where sentiment is shifting and expectations are adjusting, particularly among funds sensitive to interest rate changes. Therefore, it’s important to monitor sentiment indicators and shifts in open interest alongside price movements. This combination often provides earlier signals of change than price alone. Create your live VT Markets account and start trading now.The GBP/USD pair is rising, meeting initial resistance at the nine-day EMA of 1.3501.
Pound Stabilizes After Four-Week Low
The GBP/USD rose for the second consecutive day, trading close to 1.3500 during Asian hours on Friday. The pair showed a bullish trend, with the 14-day RSI above 50. However, it remained below the nine-day EMA, indicating weaker short-term momentum. On Thursday, GBP/USD bounced back above 1.3450 after a dip near 1.3400. This movement occurred as US markets paused for a holiday, easing some pressure on the US dollar. The Pound stabilized after hitting a four-week low of 1.3383, gaining strength following the Bank of England’s rate decision. Geopolitical uncertainties added pressure on the pair, while the US Dollar continued to rise. The BoE’s choice to keep rates unchanged, influenced by rising oil prices and tensions in the Middle East, reflects a weakening UK labor market. This raises concerns about potential rate cuts, keeping the financial landscape in focus. Sterling’s slight recovery, spurred by the Thanksgiving lull and reduced USD buying, doesn’t necessarily signal renewed optimism about the UK economy. It seems more like a temporary release of pressure due to thin liquidity and lower market participation rather than a solid bullish outlook. The Bank of England’s decision to maintain rates was not surprising, but the cautious tone caught attention. The divide among policymakers highlights worries about wage growth and slowing hiring trends, which are starting to affect monetary policy. Interestingly, the increase in GBP/USD happened despite no policy changes, showing how quickly sentiment can shift when market activity is low.Brent Highlights Inflation Expectations
The RSI remaining above 50 suggests continuing demand, but the failure to break above short-term averages dampens enthusiasm. This scenario indicates that traders have a slightly positive outlook but lack strong commitment—momentum appears weak. In short, the appetite for trading is careful, not aggressive. Brent prices remaining high have drawn attention to inflation expectations again, particularly in the energy market. While this typically supports rate-sensitive pricing, the BoE’s caution suggests that inflation alone may not warrant rate hikes, especially with the labor market softening. This brings discussions about potential rate cuts into sharper focus as we approach year-end. With GBP/USD hovering around 1.3500, a solid trading range is forming between 1.3400 and 1.3550. Breaks outside this range could encourage bolder trading, but as things stand, rallies are struggling to gain traction. For those monitoring the derivatives market, implied volatilities can be quite useful here. The demand for downside protection hasn’t surged, indicating that market participants are not anticipating drastic changes—at least, not yet. Still, there’s a notable lean toward GBP puts, particularly for shorter-term contracts. Recently, the yield gap between UK gilts and US Treasuries has narrowed, but this lack of correlation shows that broad dollar sentiment is still a major driver. GBP/USD seems to react more to external flows than domestic data. Caution is advised not to overemphasize BoE narratives unless they diverge significantly from expectations. The geopolitical backdrop adds another layer of complexity. While oil’s influence on headline inflation is significant, it seems that risk appetite is becoming more reactive rather than anticipatory. Movements in GBP/USD that align with oil price shifts tend to be temporary, fading quickly as larger macro themes come back into play. In terms of positioning, there is no strong evidence yet of a fundamental shift in sentiment. Commitment of Traders data shows that large speculative accounts are holding balanced positions, reducing both long and short bets slightly. This suggests that major players are taking a wait-and-see approach. As we enter December, quieter trading periods can lead to exaggerated price movements. This uncertainty promotes a focus on gamma flows and event-driven swings, with expectations for ranges to hold unless a significant catalyst shifts sentiment. That catalyst could come from NFP reports, inflation data, or unexpected central bank comments. The strategy here may be to trade around clear levels, observe shifts in implied volatility, and avoid getting caught up in broader macro narratives that aren’t currently influencing price action. Create your live VT Markets account and start trading now.Dividend Adjustment Notice – Jun 20 ,2025
Dear Client,
Please note that the dividends of the following products will be adjusted accordingly. Index dividends will be executed separately through a balance statement directly to your trading account, and the comment will be in the following format “Div & Product Name & Net Volume”.
Please refer to the table below for more details:
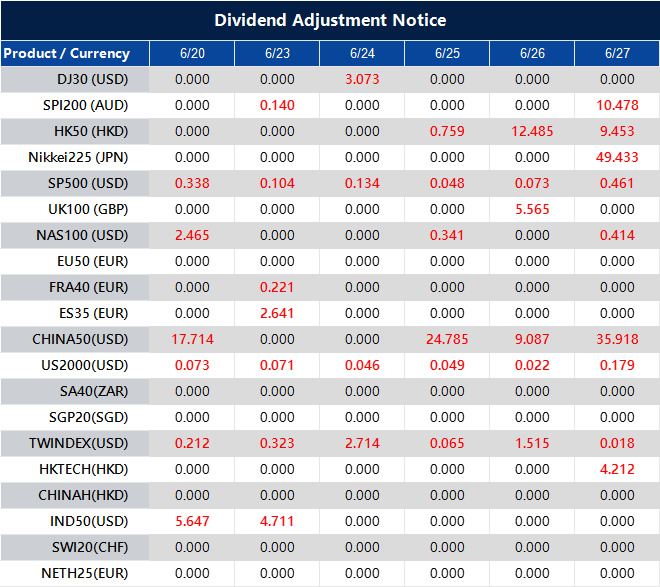
The above data is for reference only, please refer to the MT4/MT5 software for specific data.
If you’d like more information, please don’t hesitate to contact [email protected].
Improved short-selling access in South Korea boosts chances for future market classification upgrades
MSCI has announced that South Korea’s short-selling situation has improved, easing concerns ahead of the upcoming market classification review.
Right now, MSCI categorizes South Korea as an emerging market, even though it meets many criteria for developed markets. There is hope that South Korea may soon appear on MSCI’s watch list for a potential upgrade.
In March, South Korea ended a five-year ban on short selling. This decision responded to worries from foreign investors and MSCI. During its annual review, MSCI moved South Korea’s short-selling status from “–” (improvements needed) to “+” (no major issues, improvements possible).
The main takeaway from the report is that the removal of long-standing short-selling restrictions has caught MSCI’s positive attention. Until recently, short selling had been partially banned, which many institutional observers viewed as a barrier to a freer market. This change aims to bring South Korea’s regulations in line with developed market standards and to address pressure from global index providers.
While the upgrade in short-selling metrics doesn’t mean everything is perfect, it indicates that the basic infrastructure and regulations are no longer problematic for international evaluators. The timing of this change before a broader market review increases the chances that Korean stocks could be viewed more favorably in a future index reassessment.
For those analyzing regional indices and their weightings, this shift changes the assumptions we use. The enhanced short-selling conditions suggest that any issues caused by regulatory interference are now less concerning. It also clarifies how market dynamics may function during periods of volatility, which is crucial for leveraged or paired strategies.
When MSCI makes changes like these, they signal to global investors that previous obstacles have lessened. This means that a market that was hard to hedge may soon become more accessible, affecting borrowing costs and the availability of counterparty agreements. This will flow into option pricing models, volatility expectations, and overall risk assessments.
With this reclassification, we can now evaluate Korean derivatives without worrying about artificial limits on downside risks. This will enable more refined execution in strategies such as arbitrage or sector rotation as liquidity conditions improve in the coming weeks. Market players who had previously held back due to these restrictions may start to re-enter the market, leading to more pronounced price movements around corporate earnings or economic reports.
Lee from the Financial Services Commission previously suggested that Korea aims to reform more than just regulations; they want to enhance both appearance and function. Now that this regulatory piece better aligns with what we expect from developed markets, derivatives traders should assess how trading patterns may adjust, especially in the tech and large-cap industrial sectors.
We need to keep a close eye on borrowing rates. If they start to narrow, it will further indicate that price discovery is becoming clearer. This, in turn, will enable better pricing for structured products and volatility exposures, particularly in monthly roll strategies.
Now is the time to recalibrate our exposure metrics for Korean assets across all model portfolios that hold derivatives on regional indices. If the market progresses toward MSCI’s upgrade path, we may see spikes in tracking errors between futures and the spot market as flows adjust to potential index shifts. This could impact both hedged positions and strategies that depend on short-term liquidity.
This is a valuable moment for regulatory clarity, allowing for proactive adjustments rather than waiting for widespread confirmation of changes to the watch list.
In June, consumer confidence in the Netherlands improved slightly, increasing from -37 to -36.
In June, consumer confidence in the Netherlands improved slightly, rising from -37 to -36. This uptick indicates a small boost in how consumers feel about the economy.
The GBP/USD pair is climbing and testing the 1.3500 level during the Asian trading session. This pair shows an upward trend as it continues to move in an ascending channel.
Euro Dollar Movement
The EUR/USD is rising, trading at around 1.1520, supported by a possible pullback in the weakening US Dollar. Unrest related to the Middle East may affect the Dollar’s performance. Gold prices have dropped to a one-week low due to the Federal Reserve’s tough stance, which is outweighing uncertainties in the Middle East. Although risk sentiment is weak, the XAU/USD pair may not see significant losses unless conditions change. In cryptocurrency, major players like Bitcoin, Ethereum, and Ripple are stabilizing. Bitcoin remains above a crucial support level, but if this level is broken, we may see price corrections. Monetary aggregates are still important in the Eurozone, with the European Central Bank (ECB) keeping a close watch. This shows that quantitative theory still matters in shaping monetary policy. With consumer confidence in the Netherlands rising slightly to -36, this indicates a minor improvement in sentiment. While still negative, this increase suggests that Dutch households may feel a bit less pessimistic. However, this alone might not change market strategies significantly. It could, however, lessen the likelihood of more fiscal support or emergency policies from Dutch leaders soon.GBP USD Trading
The GBP/USD pair is moving up and trading near 1.3500 during Asian hours, reflecting strong interest in the British pound. This trend suggests broader weakness in the dollar and a belief that UK interest rates will stay stable. Since the pair is within a defined ascending channel, trend-following traders will likely continue buying unless the price drops below channel support. Keeping an eye on this support level in the coming sessions is crucial, as breaking it could trigger sell-offs among leveraged positions. Meanwhile, the euro-dollar is attracting consistent bids, lingering around 1.1520. This movement corresponds to the dollar’s decline, driven by geopolitical worries about the US’s role in the Middle East. Increased tensions have weakened the dollar’s status as a safe haven recently. Any rise in tensions or aggressive actions could further weaken the dollar. This scenario offers euro holders chances to position themselves above recent resistance levels. Gold’s drop to a one-week low presents a different story. While geopolitical issues usually boost gold prices, the Fed’s firm stance has outweighed this boosting effect. Strong comments about economic strength and inflation have pushed gold prices down. Still, the current context suggests potential sideways movement unless the Fed changes its tone or international tensions escalate. We are watching inflation expectations closely; if they remain stable, gold’s potential for a price increase may be limited. In the cryptocurrency market, major cryptocurrencies are not showing strong trends. Bitcoin is stabilizing above key support levels, which have held firm during previous declines. If these support levels break with strong volume, prices could become volatile. Currently, the lack of trading activity indicates no significant speculative pressure, but investment in altcoins has decreased significantly. Without new drivers, the market may remain stagnant as we move into the next quarter. Finally, from a policymaker’s perspective, heightened attention on monetary aggregates highlights the ongoing relevance of traditional tools. The ECB’s focus on these aggregates suggests they aim to align liquidity trends with price movements. With M3 growth low and real interest rates positive, expectations for easing in future quarters are understandable. While market narratives may fluctuate, the ECB’s quantitative analysis of economic signals likely supports the dovish view more than many realize. Create your live VT Markets account and start trading now.People’s Bank of China projects the USD/CNY reference rate at 7.1801
The People’s Bank of China (PBOC) sets the daily value of the yuan using a managed floating exchange rate system. This allows the yuan to change within a range of 2% above or below a central reference rate.
Every morning, the PBOC decides the midpoint for the yuan based on a mix of currencies, mainly the US dollar. This midpoint takes into account things like market supply and demand, economic data, and global currency trends.
Trading Band Overview
The PBOC permits the yuan to move within a 2% trading band from the midpoint each trading day. This band can change based on the economy and policy needs. If the yuan nears this band limit or shows too much volatility, the PBOC may intervene. The central bank can buy or sell yuan in the foreign exchange market to stabilize its value. This ensures adjustments happen gradually and under control. This approach gives the PBOC steady oversight instead of letting the currency float freely, as other central banks might. The midpoint, established daily, guides trading and serves as a reference against speculation and short-term trends. It’s about more than just the number; it also signals sentiment, policy stance, and their view on outside risks. Prices reflect traders’ expectations and their reactions to what the central bank communicates. A subtle shift in the midpoint can signal a change—sometimes small but usually intentional. Recently, we’ve noticed the morning fix bias in one direction while the spot market moved the other way. These discrepancies suggest caution in policy.Impact on Market Dynamics
For those tracking synthetic positions or option structures, we are paying close attention to the difference between market prices and the fixing level. A widening gap can influence carry trades or show stress in short-term risk. We also observe that around key economic announcements, the fixing often tightens to promote stability. When adjusting our expectations for market movements, it’s crucial to understand how carefully set these daily numbers are. Policymakers can subtly influence market activity through the midpoint boundary. This creates execution risk if political or economic events occur sharply in the evening, especially in the US or emerging markets. Overnight changes can affect the implied volatility the following morning. We watch where spot trades open in relation to the fixing. This matters because it influences volatility expectations and daily hedging decisions, especially for those with leveraged products or weekly expirations. The opening signal often leads to volume spikes and activity in dark pools around the midpoint. Moreover, we are seeing changes in how forwards are priced. Short-term tenors have shifted slightly, indicating that policy remains active. This influences rate expectations and derivative pricing. We see opportunities, but the approach has become more direct. Timing entries around the fix and assessing slippage from the midpoint are now vital, more so than simply having a directional bias. Market players should also focus on options skew. The differences in call and put premiums provide insights into pressure areas. When intervention risk rises, we often see a decrease in put demand, especially if the market feels supported from above. If spot pressures clear quickly and the midpoint adjusts, expectations for future trends can shift dramatically. We continue to view the daily setting not only as a reference point but as a decision being made. It’s not simply a calculation; there’s a level of discretion involved. For those managing delta or gamma exposures, monitoring continues past the morning print—we need to react to trades occurring around that print. As we approach the upcoming weeks, with global forces uncertain and rates active, it’s wise to consider how quickly midpoint adjustments are being made. This helps set limits on how aggressive short-term price movements can be, guiding how we approach directional positions. Create your live VT Markets account and start trading now.Gold prices in Malaysia dropped today due to a decline in value, according to compiled data.
Gold prices in Malaysia dropped on Friday. The price per gram decreased to 459.22 Malaysian Ringgits from 461.51 the day before. The price for a tola also fell to MYR 5,356.28, while a troy ounce was priced at 14,282.97 MYR.
In Malaysia, gold prices are determined by adjusting international rates and converting them into the local currency and units. Prices change daily based on market trends, although local rates may vary slightly.
Central Bank Gold Reserves
Central banks hold most of the world’s gold. In 2022, they bought 1,136 tonnes, worth about $70 billion, making it the largest annual purchase on record. Countries like China, India, and Turkey are rapidly increasing their gold reserves. Gold usually moves in the opposite direction of the US Dollar; when the Dollar weakens, gold prices tend to rise. Prices can change due to geopolitical issues or economic concerns. Generally, lower interest rates boost gold prices, while a strong Dollar can keep them in check. Recently, we saw a slight dip in Malaysian gold prices. The value per gram fell to 459.22 MYR, down over 2 Ringgits from the last session. Prices for tola and troy ounce formats also showed similar declines. This isn’t an isolated drop; it’s a local adjustment reflecting changes in global prices, currency conversions, and rounding in domestic rates. This suggests that local gold prices are closely following global trends rather than setting their own path. These trends become particularly important during times of macroeconomic uncertainty. The key issue is global reserves. Central banks from countries like China, India, and Turkey aren’t just making small adjustments—they’re significantly increasing their gold holdings. Last year, they acquired over 1,100 tonnes. This represents billions in USD at current prices. When central banks adjust their reserves, it’s usually a long-term strategy that aims to protect against currency fluctuations or support economic confidence during tight financial conditions.Gold And The US Dollar
Gold and the US Dollar have a long-standing inverse relationship. When the Dollar weakens, gold prices often rise. However, it’s important not to oversimplify this relationship. If the Dollar remains strong, it can limit gold’s upward movement. Additionally, in times of increased risk appetite, investors may shift funds from safe havens like gold to stocks or other higher-yield investments. Geopolitical or economic fears can also impact gold prices, sometimes in ways not directly related to inflation or interest rates. Price spikes can occur due to market sentiment rather than hard data, especially during times of conflict or when major economic policies change. Currently, we should pay attention to interest rate expectations from the Fed. Lower interest rates can support gold prices since it reduces the opportunity cost of holding non-earning assets. However, if inflation remains stable or increases in the US or Western Europe, the Dollar can still strengthen, which would put pressure on gold prices even if rates are lower. For those trading metals like gold, it’s essential to monitor central bank announcements, inflation data, and changes in emerging market policies. These factors can significantly influence market direction. Often, markets misprice future probabilities, leading to unexpected changes in futures contracts when guidance shifts or data surprises. As we look ahead, flexibility in hedging strategies is crucial. Relying solely on interest rate predictions for gold trading is no longer effective. It’s important to consider the relative strength of the Dollar, the pace of reserve buying, and current political statements. We must acknowledge that gold is highly sensitive—not just to central bank actions but also to traders’ perceptions about timing. Create your live VT Markets account and start trading now.Upcoming events: BOJ’s May meeting minutes and Governor Ueda’s speech
The Bank of Japan’s minutes from their May meeting will be available at 2350 GMT (1950 US Eastern time). A preview is already available based on the Summary of Opinions from the Monetary Policy Meeting held on April 30 and May 1, 2025.
Bank of Japan Governor Kazuo Ueda will address the Annual Trust Association Meeting, though the exact time of his speech is not yet confirmed.
In May 2025, Japan’s Consumer Price Index (CPI) stayed above the Bank of Japan’s target rate, continuing the central bank’s ongoing evaluations.
The summary from the late-April and early-May meetings gives some hints about the tone of the full minutes. These excerpts indicate a persistent inflation above the desired target. Although the central bank has made only gradual changes so far, there’s a growing belief that monetary support might need to decrease sooner than expected.
Governor Ueda’s upcoming speech may echo these concerns, especially given the steady CPI readings. Since inflation isn’t decreasing, it suggests that policies could become stricter, either soon or in the coming quarters. There’s also worry about waiting too long to make changes. Traders should pay close attention to Ueda’s words, as they often reveal more than official statements.
For short-term traders focusing on interest rate products and volatility linked to JPY-denominated assets, the focus should shift to the yield curve’s predictions for potential changes, not just the policy rate. There’s clear evidence of internal disagreements within the central bank. Some members are more vocal about ongoing inflation and currency weakness pushing prices up. This could lead to increased volatility following each new CPI report or economic forecast.
We should monitor the implied volatility in options for Japanese government bonds, especially as it might increase around key announcements from the monetary authorities. Even if no rate change happens at the next meeting, clearer forward guidance could lead swap markets to widen expectations, affecting cash bond yields and forward contracts. Traders should consider two key questions: what happens if the yen weakens further? What actions would lead to a sharper domestic tightening?
These signals are increasingly relevant now. The output gap has narrowed, labor markets are tight, and higher import costs are being passed on to consumers. Conditions that would not have prompted policy changes a year ago are now different. Members like Nakagawa are voicing concerns that inflation may not just be temporary, especially as energy costs continue to rise.
As a result, carry trades involving Japanese government bonds (JGBs) may now be priced too optimistically. Our models indicate a slight increase in market-based inflation expectations. While not alarming, this suggests a need to rethink any short-term holdings relying on long-term dovish policies. Upcoming option expirations should be evaluated accordingly, especially where gamma exposure is sensitive to sudden changes.
Overall, there’s a trend: comments from the monetary board are becoming less patient. While not overtly hawkish, they are not neutral either. Japan’s usually flat interest rate structure may soon begin to rise again if policy changes accelerate. Repricing will be inconsistent, but for those in swaps, futures, or leveraged bond ETFs, timing the sentiment shift could be more crucial than just predicting direction.
We believe that hedging strategies will need quick adjustments in the next few weeks. Keep an eye on changes not only in headline CPI but also in core readings that exclude fresh food and energy. These core figures will increasingly influence policy decisions from the board’s key members. A careful analysis of the next minutes will be crucial to understanding when—and not if—the next policy change will occur.
Silver’s decline continues as it falls below $36.00 for three consecutive days
Silver has seen strong selling pressure for three days in a row, bringing prices down to around $35.65, a level not seen in over a week during the Asian trading session. This decline follows a drop from a high not reached since February 2012.
From a technical standpoint, silver’s drop below $37.00 and the 23.6% Fibonacci retracement level suggests a bearish trend. The oscillators on the 4-hour chart show negative momentum, indicating the possibility of further declines. If the price breaks decisively below the mid-$35.00 range or the 100-period simple moving average (SMA) on the 4-hour chart, we could see deeper losses.
If the downward trend continues, silver might reach the 38.2% Fibonacci level around $35.15, potentially moving down to the psychological level of $35.00. Additional support is found at $34.75, with a further drop to the 50% retracement level at $34.45 signaling more downturn.
If silver attempts to recover above $36.00, it may face resistance in the $36.40 to $36.50 range. A sustained breakthrough could shift momentum towards bullish traders, targeting $37.00 and higher.
Silver’s price is affected by geopolitical tensions and the behavior of the US Dollar, with changes in industrial demand also influencing costs. The market’s reaction to technical levels and external factors will shape silver’s future direction.
Currently, silver’s prices are hovering at the lower end of their recent range, with ongoing pressure felt over several sessions. The drop from multi-year highs has gained attention and has broken through both technical and psychological support levels, such as the 23.6% Fibonacci retracement. This pattern suggests that a reversal is not likely yet; instead, the trend seems to continue downward.
On the charts, momentum oscillators on shorter timeframes like the 4-hour show a clear bearish trend. Since falling below $37.00, bears have regained control, evidenced by a downward bias in price action and a lack of support from demand. The recent movement below the 100-period simple moving average suggests trouble ahead; this average often serves as a key reference for mid-range traders. Remaining below this level opens the possibility of testing the $35.15 mark, and potentially lower levels at $34.75 or $34.45 if selling pressure persists.
These levels are not picked randomly; they align with key retracement zones from previous rallies where price has often paused or reversed. If we revisit these levels, it would indicate more than just daily fluctuations; it would suggest a change in market sentiment that has been riding high since early May.
We’re also closely watching the $36.00 level. This price point has repeatedly indicated whether stabilization attempts gain traction or fail quickly. A bounce above may only be short-covering unless the price convincingly holds above $36.50. Short-term traders may see a recovery opportunity, but without consistent buying support, we should approach any rebounds cautiously. A significant shift toward the upside cannot be expected until $37.00 is breached with volume and follow-through.
It’s important to remember that silver doesn’t trade in isolation. As an industrial material and a quasi-monetary asset, it reacts in complex ways. Currently, external factors, especially geopolitical stress and changes in dollar flows, are affecting how charts behave. A stronger US Dollar puts pressure on silver, while cooling tensions can reduce safe-haven demand. Traders need to consider these external macro cues alongside technical indicators that may signal changes.
As market positions adjust, we are monitoring how support and resistance levels hold up. The inability of silver to maintain February 2012 levels is significant; it shows potential overextension rather than underlying strength. Unless the broader context changes, we anticipate further tests of support, especially as sellers remain active for now.


